Characteristics of patients at baseline
Table 1 presents baseline characteristics of patients stratified by LAR tertiles (tertile 1 [Q1], tertile 2 [Q2], tertile 3 [Q3]). Significant intergroup differences were observed across most clinical variables (all p-values were less than 0.001). Patients in higher LAR tertiles demonstrated younger median age (67 years [Q1], 65 years [Q2], 61 years [Q3], respectively), with the Kruskal-Wallis test confirming age gradients (p < 0.001). Physiological parameters showed progressive deterioration, including heart rate, respiratory rate, and lactate levels (1.46, 2.85, 6.07 mmol/L), with similar trends in anion gap and SOFA scores (6, 8, 12 points). Laboratory markers revealed progressive organ dysfunction across tertiles, as evidenced by increasing INR (1.2, 1.4, 1.8), creatinine (82.1, 95.3, 123.7 µmol/L), and decreasing albumin (35.2, 32.1, 29.8 g/L) (all p-values were less than 0.001). Comorbidities including sepsis (23.0%, 43.7%, 51.8%), AKI (50.8%, 70.1%, 81.6%), and cirrhosis (27.0%, 39.2%, 46.8%) demonstrated tertile-dependent increases using the χ² test (p < 0.001). Mortality outcomes showed pronounced gradients: hospital mortality increased from 25.6% in Q1 to 60.3% in Q3, and 365-day mortality increased from 23.2 to 57.4% (both p < 0.001). No significant differences were observed for gender distribution, diabetes prevalence, or history of a myocardial infarction across tertiles.
Association between LAR and all-cause mortality
28-day mortality
In the Cox regression analysis of 28-day mortality, LAR was divided into tertiles (Q1-Q3), using Q1 as the reference group. Compared to Q1, Q2 showed a significantly higher mortality risk across all models (Model 1: HR = 2.08, 95% CI 1.58–2.73, p < 0.001; Model 2: HR = 2.12, 95% CI 1.61–2.79, p < 0.001; Model 3: HR = 1.48, 95% CI 1.10–1.97, p = 0.009). The association was more pronounced for Q3 (Model 1: HR = 4.94, 95% CI 3.67–6.65; Model 2: HR = 5.22, 95% CI 3.86–7.04; Model 3: HR = 3.02, 95% CI 2.14–4.24; all p < 0.001). A significant dose-response relationship was observed across all models (p for trend < 0.001).
90-day mortality
For 90-day mortality, Cox regression analyses revealed a significant link between higher LAR tertiles (Q1-Q3) and increased mortality risk. Compared to Q1 (reference), Q2 had a HR of 1.95 (95% CI 1.54–2.47, p < 0.001) in the unadjusted Model 1 and 1.97 (95% CI 1.56–2.50, p < 0.001) in Model 2 after adjusting for age and sex. Further adjustment for clinical and laboratory variables in Model 3 weakened the association (HR = 1.32, 95% CI 1.03–1.69, p = 0.029). The highest tertile (Q3) showed a stronger association, with HRs of 3.95 (95% CI 3.01–5.19, p < 0.001) in Model 1, 4.12 (95% CI 3.13–5.43, p < 0.001) in Model 2, and 2.29 (95% CI 1.68–3.11, p < 0.001) in Model 3. A significant dose-response association was found in all models (p for trend < 0.001).
365-day mortality
For 365-day mortality, Cox regression models also demonstrated a significant association between higher LAR tertiles (Q1-Q3) and increased mortality risk. Compared to Q1, Q2 exhibited an HR of 1.86 (95% CI 1.48–2.33, p < 0.001) in the unadjusted Model 1 and 1.88 (95% CI 1.50–2.36, p < 0.001) in Model 2 after age and sex adjustment. Further adjustment for clinical and laboratory covariates in Model 3 reduced the association but it remained significant (HR = 1.28, 95% CI 1.00–1.62, p = 0.047). For Q3, the association was stronger, with HRs of 3.68 (95% CI 2.82–4.81, p < 0.001) in Model 1, 3.83 (95% CI 2.93–5.01, p < 0.001) in Model 2, and 2.16 (95% CI 1.60–2.92, p < 0.001) in Model 3. A clear dose-response relationship was observed in all models (p for trend < 0.001). Further details are provided in Table 2.
Analysis of Kaplan-Meier and ROC curves
K-M analysis
K-M analysis showed that the Q3 group had significantly higher mortality rates than the Q2 and Q1 groups at all assessed time points. Specifically, the 28-day mortality rates were 52.5% in Q3 vs. 28.2% in Q2 vs. 14.8% in Q1 (P < 0.001). The 90-day mortality rates were 56.0% in Q3 vs. 36.3% in Q2 vs. 20.9% in Q1 (P < 0.001). Similarly, the 365-day mortality rates were 56.0% in Q3 vs. 36.3% in Q2 vs. 20.9% in Q1 (P < 0.001). All these differences were statistically significant (Fig. 2).
K-M survival analysis curves for all-cause mortality in patients with GIB at 28-day (A), 90-day (B), and 365-day (C) of hospital admission
ROC curve analysis
Receiver operating characteristic (ROC) curve analysis was performed to evaluate seven prognostic indicators: LAR, lactate, ALB, SOFA score, AIMS65, and the combined models SOFA + LAR and AIMS65 + LAR. LAR alone demonstrated moderate discriminative ability for predicting all-cause mortality, yielding AUCs of 0.681, 0.664, and 0.653 for 28-day, 90-day, and 365-day mortality, respectively. These values were higher than those of lactate, ALB, and the conventional AIMS65 score (AUCs of 0.644, 0.637, and 0.630, respectively), indicating the superior standalone prognostic value of LAR.
Furthermore, integrating LAR with existing scoring systems enhanced predictive performance. The addition of LAR to the AIMS65 model increased the AUCs to 0.710 (28-day), 0.694 (90-day), and 0.684 (365-day), suggesting that LAR provides incremental prognostic value beyond traditional scores. Similarly, combining LAR with the SOFA score further improved predictive accuracy, with the SOFA + LAR model achieving AUCs of 0.741, 0.723, and 0.719 for 28-day, 90-day, and 365-day mortality, respectively (Table 3; Fig. 3).
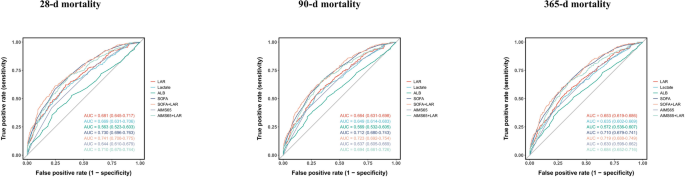
ROC curves for predicting all-cause mortality in patients with GIB at 28-d (A), 90-d (B) and 365-d (C) of hospital admission
Decision curve analysis
Supplementary Fig. 1 presents the DCA comparing SOFA alone with SOFA + LAR across three follow-up periods (28-day, 90-day, and 365-day). At all time points, the SOFA + LAR model showed a superior net benefit compared to the SOFA score alone. These findings suggest that incorporating LAR into the SOFA scoring system improves mortality risk stratification and enhances clinical utility.
Association between LAR and GIB prognosis: a restricted cubic spline analysis
To explore potential nonlinear relationships, RCS regression analysis was conducted. Results showed a significant linear correlation between LAR and adverse GIB prognosis (P -nonlinear > 0.05 at all time points, P -overall < 0.001). This correlation persisted across follow – up intervals at 28, 90, and 365 days. As LAR levels increased, clinical outcomes worsened. Figure 4 presents the RCS curves illustrating this relationship.
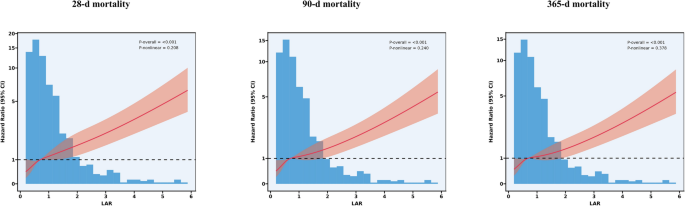
Association between LAR and Survival with the RCS function at 28-d (A), 90-d (B), and 365-d (C) after admission
Subgroup analyses of LAR on clinical outcomes in GIB patients
Stratified subgroup analyses were performed across prespecified variables, including age, sex, race, sepsis, diabetes, cirrhosis, CRRT, and mechanical ventilation, to assess potential interaction effects. Results indicated that LAR showed consistent predictive performance across all subgroups (P for interaction > 0.006), highlighting its robustness as a reliable prognostic biomarker. Detailed comparisons of subgroup analyses are presented in Fig. 5.
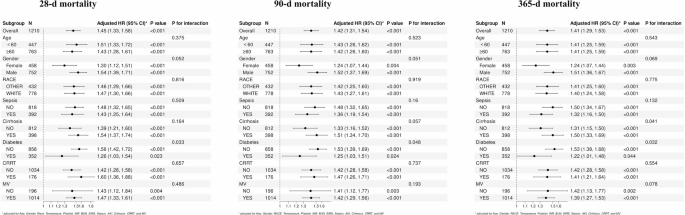
Forest plots of subgroup analysis of the relationship between all-cause mortality and LAR in patients with GIB admitted 28-d (A), 90-d (B), and 365-d (C)
Predictor screening and nomogram model construction
To create a clinically useful predictive model, the Boruta machine – learning algorithm was employed to identify 5 key prognostic factors: SOFA score, LAR, APTT, sepsis status, and blood urea nitrogen (Supplementary Fig. 2). Incorporating these factors into a nomogram enabled the prediction of individual survival rates at 28, 90, and 365 days (Fig. 6). The reliability of the model was confirmed by ROC analysis, which yielded AUC values of 0.780 (95% CI: 0.750–0.811), 0.777 (95% CI: 0.749–0.805), and 0.773 (95% CI: 0.745–0.800) for mortality at those time points, respectively, indicating high predictive accuracy. The nomogram’s ROC curve is presented in Supplementary Fig. 3.
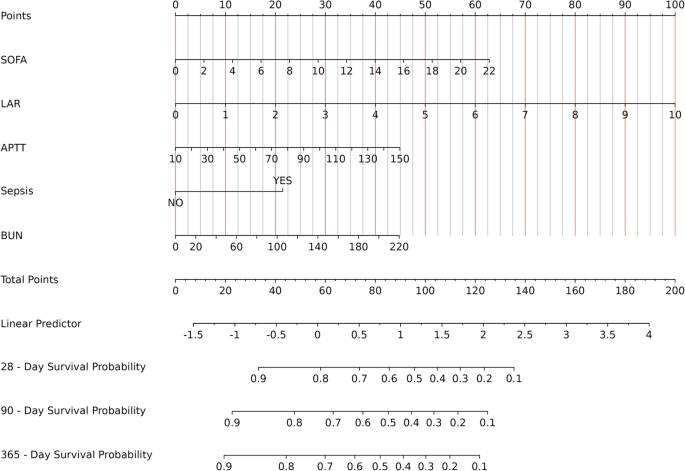
Nomogram for Assessing Mortality Risk in Critical GIB
To further assess the model’s internal validity and discriminative consistency, non-parametric bootstrap resampling with 1,000 iterations was performed. The bias-corrected Harrell’s concordance indices (C-indices) were 0.776, 0.772, and 0.768 for 28-day, 90-day, and 365-day mortality, respectively, indicating stable and reliable performance across all evaluated time points.
Calibration of the nomogram was assessed using calibration plots, which are presented in the revised Supplementary Fig. 4. These plots revealed close concordance between predicted and observed outcomes, confirming the accuracy and reliability of the model’s calibration.