Synthesis of HPMZIF NPs and changes in enzyme activity
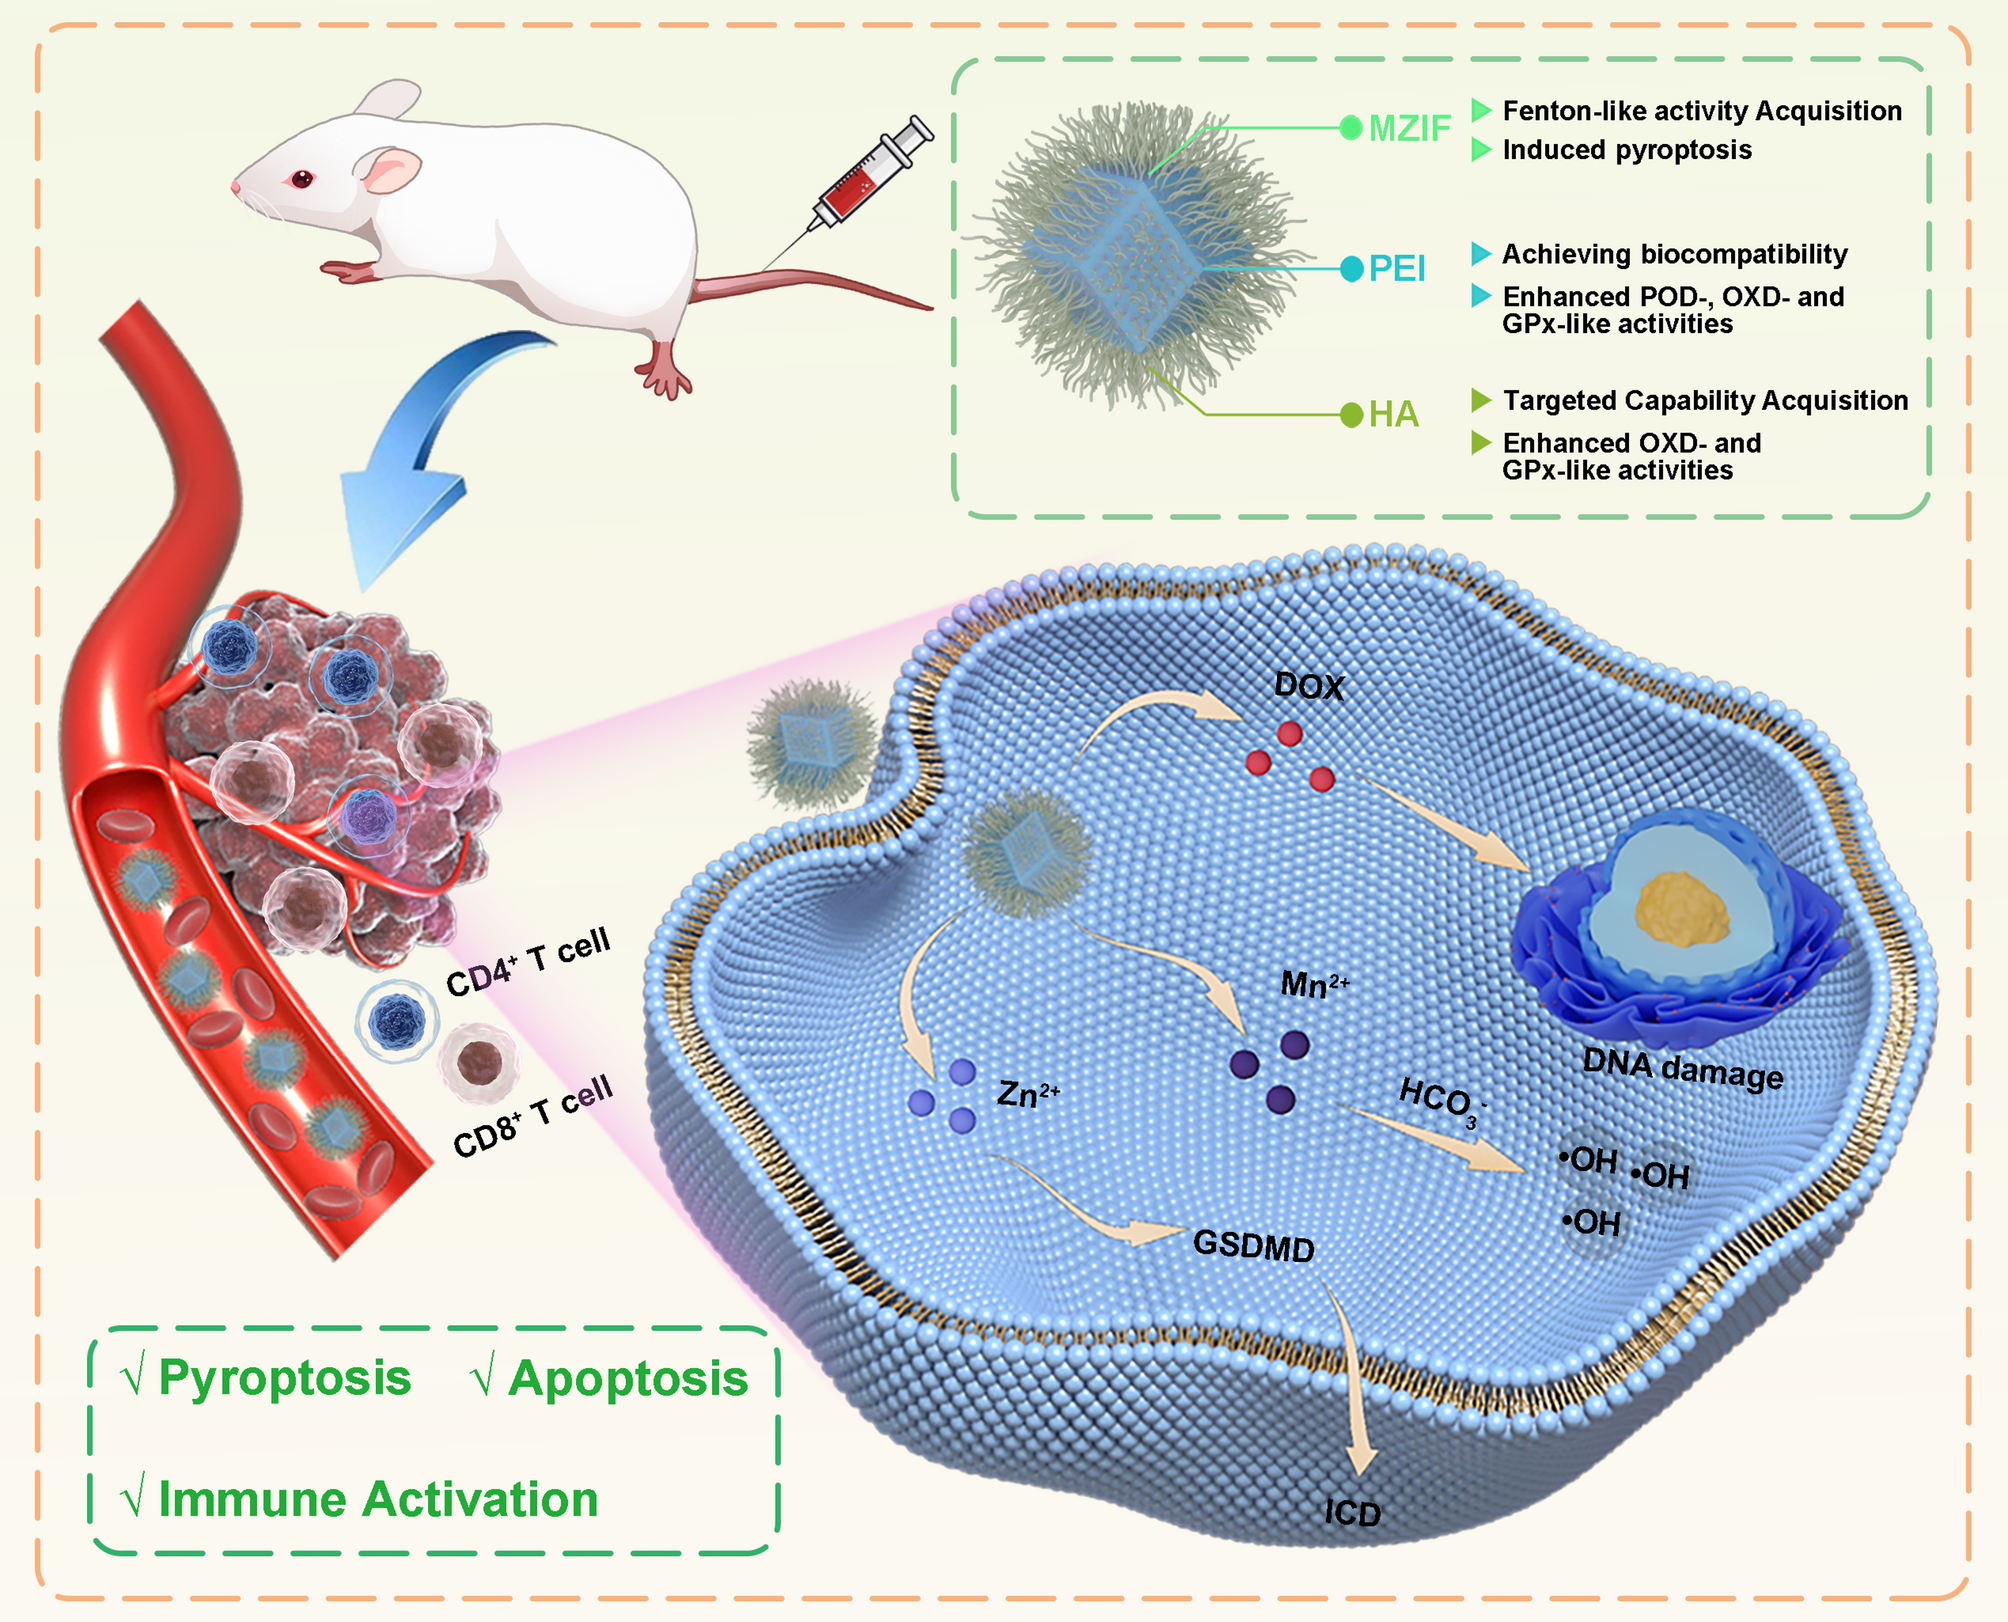
The schematic (Scheme 1) shows the synthesis of HPMZIF. A standard synthesis method was used to obtain manganese-doped ZIF-8 (MZIF), specifically using the self-assembly process of Mn2+/Zn2+ and dimethylimidazole, and then coated with PEI to prevent internal drug leakage, while increasing the biocompatibility of nanozyme (PMZIF). Finally, HA was modified on the surface of PMZIF to improve the targeting ability of the nanoplatform (HPMZIF) (Figure S1, Supporting Information). The fourier transform infrared (FTIR) spectra shows that, HPMZIF spectrum shows a characteristic absorption peak of N-H in PEI around 1586 cm⁻¹, while the peaks at 1631 cm⁻¹ and around 3500 cm⁻¹ correspond to the characteristic peaks of -COOH and -OH in HA. These results confirm the successful coating of HA and PEI (Figure S2, Supporting Information).
Interestingly, we found that the introduction of PEI and HA not only achieved our expected biological functions, but also improved the multi-enzyme activity of nanozyme, and ZIF8, PEI and HA alone did not have these enzyme activities (Figure S3, Supporting Information). We used 3,3″,5,5″-tetramethylbenzidine (TMB) and 2,2’-azino-bis(3-ethylbenzothiazoline-6-sulfonic acid) (ABTS) as substrates to detect its POD and OXD activities (Fig. 1a). The results demonstrated that within the modified nanoparticle solution, both TMB and ABTS exhibited notably enhanced characteristic absorption peaks at 652 nm and 734 nm, respectively. This finding indicates that the modification of PEI enhanced the POD-like and OXD-like activity of the nanozyme, and the modification of HA further enhanced the OXD-like activity of the nanozyme but had no significant effect on its POD-like activity (Fig. 1b, c; Figure S4, Supporting Information). In addition, the consumption of glutathione (GSH) was evaluated using dithionitrobenzoic acid (DTNB) as a probe. GSH combined with DTNB to generate a Yellow TNB intermediate with a unique absorption spectrum at 412 nm. The GSH solution reacted with the nanoparticles to release oxidized glutathione (GSSG), resulting in a decrease in its characteristic absorption peak, which proved that the modification of PEI and HA also enhanced the GPx-like activity of nanozyme (Fig. 1d).
The density functional theory (DFT) method was used to study the mechanism by which the introduction of PEI enhances the POD-like activity of Mn MOF. The results showed that for MZIF and PMZIF, the rate-limiting step of the entire reaction path was *OH + OH → *OH, and the rate-limiting step energy barriers were 1.64 eV and 0.76 eV, respectively. Therefore, the introduction of PEI plays a role in further fixing *H2O2 and *OH, thereby reducing the energy barrier for the generation of •OH (Fig. 1e, f). The determination of kinetic parameters also confirms this result, as PEI-modified nanoparticles exhibit a higher catalytic rate (Figure S5 and Table S1, Supporting Information). As for the subsequent enhanced OXD- and GPx-like activities, since OXD- and GPx-like activities are often reflected in high-valent manganese ions, we speculate that this enhancement is caused by the change in the valence state of manganese ions during the subsequent modification process. XPS results also confirmed that modification of PEI and HA would lead to an increase in the content of Mn4+ (Figure S6, Supporting Information).
Catalytic performance of Mn MOF nanozymes. (a) Schematic diagram of HPMZIF with OXD-, POD- and GPx-like activities. (b) UV-Vis absorption spectra of TMB in solutions containing different Mn MOFs. (c) UV-Vis absorption spectra of ABTS in solutions containing different Mn MOFs. (d) Using DTNB as a probe to detect the GSH consumption capacity of different Mn MOFs. (e) Schematic diagram of the catalytic mechanism of MZIF in acidic environment. (f) The free energy diagram of the catalytic process of MZIF and PMZIF in acidic environment
Characterization of HPMZIF NPs
Since HPMZIF has excellent multiple catalytic activities and multiple biological functions, we believe that it can be used as a nanoplatform to achieve anti-tumor effects. We then performed a series of characterizations, and SEM (Fig. 2a) and TEM (Fig. 2b) images showed that the as-prepared HPMZIF NPs were approximately 160 nm in size and had a spherical morphology. The hydrated particle size of HPMZIF NPs measured by DLS was approximately 202 ± 26 nm (Fig. 2c), which was slightly larger than the actual diameter of the nanoparticles under electron microscopy, due to the moderate aggregation caused by the surface charge of the nanoparticles. The surface zeta potential of the synthesized MZIF NPs is 19.1 ± 0.2 mV, which increases to 28.3 ± 0.7 mV after PEI modification and decreases to 19.2 ± 0.1 mV after HA treatment (Fig. 2d). Elemental mapping analysis showed that the nanoparticles were mainly composed of elements C, N, O, Zn, and Mn. The O element was located in the outer layer, which may be caused by the HA coating, further indicating successful preparation of the nanoplatform (Fig. 2e).
The C 1 s, N 1 s, O 1 s, Mn 2p, and Zn 2p spectral peaks in the high-resolution XPS spectrum further confirmed the elemental composition of HMPZIF NPs (Fig. 2f; Figure S7, Supporting Information). Meanwhile, the Mn 2p XPS data showed two peaks at 642.3 eV and 656.6 eV, which corresponded to the bond energies of Mn 2p3/2 and Mn 2p1/2, the narrow peaks indicating that Mn existed in the form of Mn2+, Mn3+ and Mn4+ in HMPZIF NPs (Fig. 2g), which was consistent with our previous belief that the manganese ions changed valence during the modification process. Moreover, the XRD spectra showed no obvious differences between the HPMZIF, MZIF, and ZIF-8 NPs, indicating that Mn2+ doping did not change the crystal structure of ZIF-8 (Fig. 2h).
It has been suggested that Mn2+ hydrolyzes H2O2 to •OH via Fenton-like reactions. Therefore, to detect the generation of •OH, its formation under different conditions was monitored using MB as an indicator. The results showed that the effect of H2O2 alone on the absorbance of MB was negligible, and that HPMZIF NPs alone caused a slight decrease in the absorbance of MB. The absorbance of MB decreased significantly only when H2O2 and HPMZIF NPs were present simultaneously, indicating the generation of •OH (Fig. 2i). Notably, MB degradation showed dependence on time (Figure S8, Supporting Information), and H2O2 concentrations (Fig. 2j).
In vitro degradation characteristics
We studied the cleavage and drug release under different conditions to verify whether HPMZIF NPs can release drugs in response to the TME. HPMZIF showed no obvious cleavage, even after 24 h under neutral conditions (Fig. 2k); however, in a slightly acidic environment, significant disintegration occurred in approximately 2 h. Additionally, the loading rate of DOX was 10.1%, as detected by UV-vis spectrophotometry, and the drug release behavior of DOX@HPMZIF was studied. The results show that at pH 7.4, the release of DOX was very slow, with approximately 10% released in 48 h; however, at pH 5.5, about 45% of DOX was released in 12 h (Fig. 2l). These results show that the nanomedicine has a significant TME-responsive sustained-release effect, which allows the drug to be accurately released at the tumor site and reduces toxicity to normal tissues. The DOX fluorescence signal in DOX@HPMZIF was significantly quenched when compared with free DOX. Notably, the fluorescence signal of DOX can be partially recovered after incubation with DOX@HPMZIF (at pH 5.5 for 4 h, which further confirms the pH-responsive release of DOX from DOX@HPMZIF (Fig. 2m). These results indicate that the HPMZIF NPs have excellent ROS generation ability and superior precision release capability.
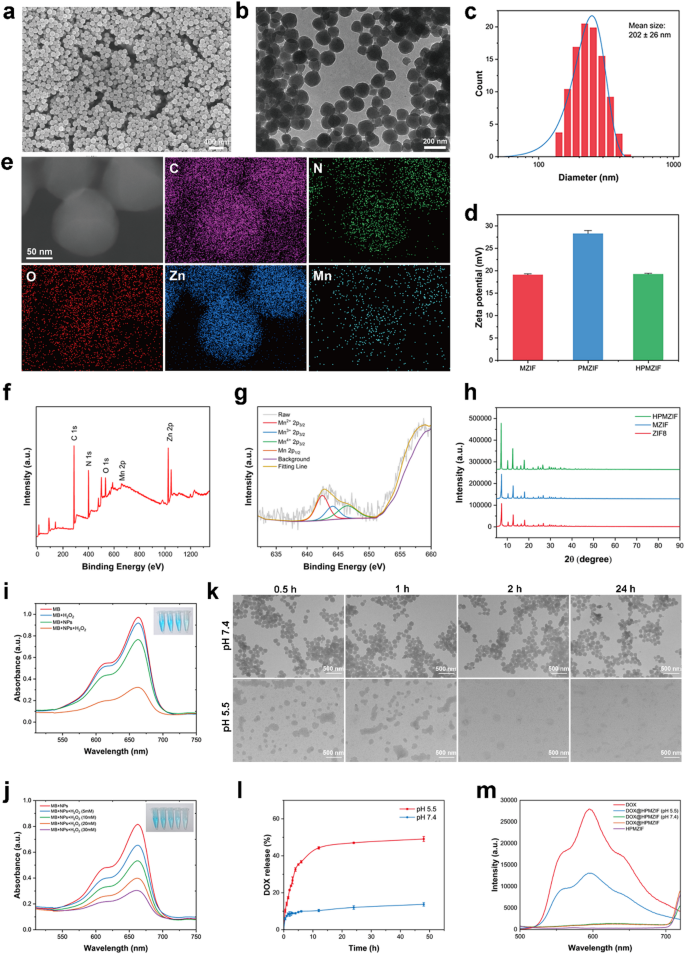
Characterization of HPMZIF NPs. SEM images (a), TEM images (b), and size distribution (c) of HPMZIF NPs. (d) Zeta potential of MZIF, PMZIF and HPMZIF NPs. (e)Elemental mapping images of HPMZIF NPs. XPS curves of HPMZIF NPs (f) and Mn2p XPS spectra (g). (h) XRD patterns of HPMZIF NPs. (i) MB absorbance curves under different conditions. (j) UV-visible absorption spectra of MB in solutions containing HPMZIF NPs and different concentrations of H2O2. (k) TEM images of HPMZIF treated at different pH conditions for different times. (l) Cumulative release of DOX from DOX@HPMZIF NPs under different conditions. (m) Fluorescence spectra of DOX, HPMZIF, and DOX@HPMZIF incubated at pH 7.4 or 5.5 for 4 h
In vitro anti-tumor activity
Encouraged by these results, we further explored the in vitro antitumor activity of the NPs. First, we evaluated the cell-entry ability of the NPs. The results showed that the DOX@HPMZIF group showed the strongest fluorescence, indicating that the uptake of NPs by HA-coated cells was significantly enhanced (Fig. 3a); similar results were obtained by flow cytometry (Figure S9, Supporting Information). The therapeutic effects of DOX@HPMZIF on 4T1 cells were evaluated. The cell survival rate after DOX@HPMZIF treatment decreased sharply compared with the other three groups (Fig. 3b). Contrastingly, the HPMZIF did not produce obvious toxicity in normal cells (Fig. 3c). Furthermore, the clone formation assay indicated that DOX@HPMZIF treatment might have a potential long-term anticancer effect, as the number of clones in the DOX@HPMZIF group was significantly reduced (Figure S10, Supporting Information). Thus, we speculated that DOX@HPMZIF converted H2O2 into highly toxic •OH through the Fenton-like reaction of released Mn2+, resulting in strong oxidative stress in 4T1 cells. Therefore, the ROS probe DCFH-DA was used to evaluate changes in oxidative stress in 4T1 cells. The results showed that the DOX@HPMZIF-treated group exhibited the strongest green fluorescence, indicating the generation of the strongest oxidative stress (Fig. 3d; Figure S11, Supporting Information). This result was verified by flow cytometry (Figure S12, Supporting Information).
Calcein AM/PI staining was performed to further verify our results. As expected, DOX@MZIF, DOX@PMZIF, and DOX@HPMZIF exhibited stronger anti-tumor activity than free DOX. Notably, the highest cell death was observed in the DOX@HPMZIF-treated group, showing the strongest tumor-killing ability (Fig. 3e; Figure S13, Supporting Information). The cell apoptosis rate was determined using flow cytometry. Similarly, most cell apoptosis was observed in the DOX@HPMZIF-treated group (Fig. 3f), demonstrating the synergistic effect of chemotherapy and CDT.
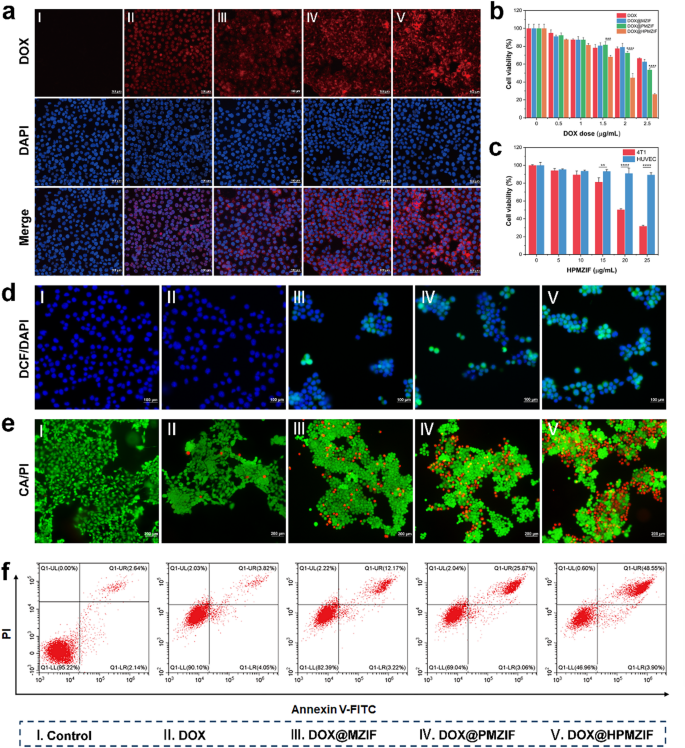
In vitro anti-tumor activity of DOX@HPMZIF NPs. (a) Fluorescence imaging of 4T1 cell uptake in different groups. Scale bars are 100 μm. (b) Viability of 4T1 cells after treatment with different drugs. (c) Cell viability of 4T1 and HUVEC after HPMZIF treatment. (d) DCF fluorescence of 4T1 cells after different treatments. Scale bars are 100 μm. (e) Live/dead staining of 4T1 cells after different treatments. Scale bars are 200 μm. (f) Flow cytometric analysis of 4T1 cells after incubation with different NPs
In vitro pyroptosis assay
It is well known that pyroptosis is a unique type of programmed cell death characterized by cell swelling and the appearance of large bubbles, which is usually an effective combination of apoptosis and necrosis. It has been reported that ZIF-8 can cause Zn2+ overload and lead to tumor cell pyroptosis. Therefore, we explored whether DOX@HPMZIF retain this ability. First, we used the Zn2+ probe TSQ to detect intracellular Zn2+. As expected, the fluorescence of the DOX@HPMZIF group was the highest (Fig. 4a) with the cells becoming swelled and spherical (Fig. 4b). The cleavage of GSDMD by inflammatory caspases is a key process in initiating pyroptosis, and in typical pyroptosis, it is usually accompanied by the release of many inflammatory molecules and cellular contents, including LDH and IL-1β. Therefore, we detected changes in these pyroptosis markers after treatment with DOX@HPMZIF, and the results showed that the expression of GSDMD-N and cleaved caspase-1 in the DOX@MZIF, DOX@PMZIF, and DOX@HPMZIF groups increased (Fig. 4c). This indicates the existence of a caspase-1/GSDMD-dependent cell pyroptosis pathway. Moreover, LDH (Fig. 4d) and IL-1β (Fig. 4e) were also significantly increased in the cell supernatants after treatment with DOX@MZIF, DOX@PMZIF, and DOX@HPMZIF compared with the control group. Recent studies have shown that GSDMD-N can damage the mitochondrial membrane in the early stage of cell pyroptosis, resulting in the loss of mitochondrial transmembrane potential. 5,5’,6,6’-tetrachloro-1,1’,3,3’-tetraethylbenzimidazolyl-carbocyanine iodide (JC-1) fluorescent probe was utilized to assess the changes in mitochondrial membrane potential (MMP). The DOX@HPMZIF group showed strong green fluorescence, indicating severe mitochondrial damage (Fig. 4f). In addition, Pyroptosis induces immunogenic death of tumor cells, generating endogenous damage-associated molecular patterns (DAMPs), including calreticulin (CRT), high mobility group box 1 (HMGB1), and adenosine triphosphate (ATP). Immunofluorescence showed that the expression of CRT in the DOX@HPMZIF group was significantly higher than that in the control group (Fig. 4g), and the release of HMGB1 (Figure S14, Supporting Information) and ATP (Figure S15, Supporting Information) in the cell supernatant was also significantly increased. These results confirmed that DOX@HPMZIF can induce tumor cell pyroptosis and further induce the occurrence of tumor cell ICD.
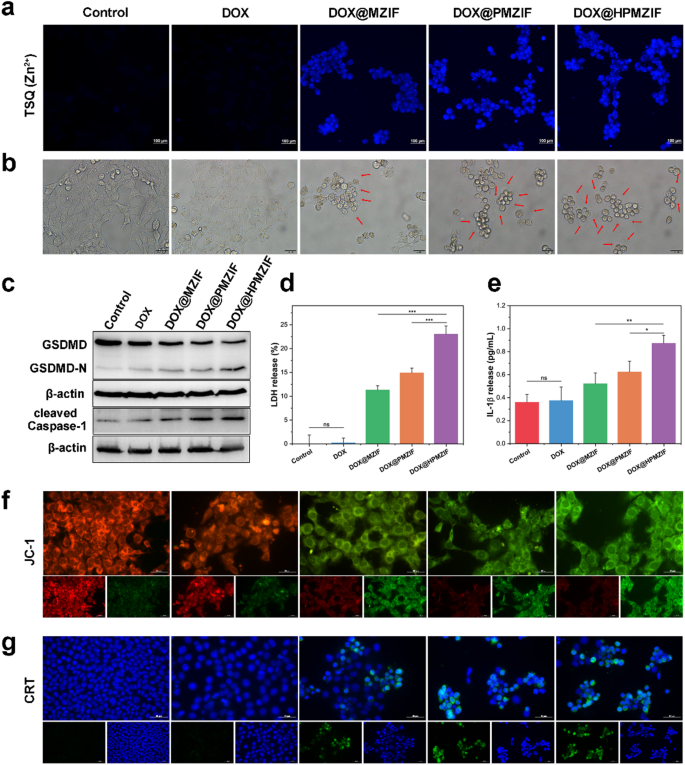
Detection of pyroptosis proteins and markers. (a) TSQ detection of Zn2+ in 4T1 cells of different groups. Scale bars are 100 μm. (b) Pyroptosis morphology images of different treatment groups. Scale bars are 20 μm. (c) Western blotting of GSDMD and cleaved caspase-1. (d) Relative amount of LDH released. (e) The amount of IL-1β released. (f) Representative fluorescence images of 4T1 cells to show JC-1 and subsequently assess the extent of mitochondrial damage. Scale bars are 50 μm. (g) Representative fluorescence staining images of CRT of 4T1 cells treated with different methods. Scale bars are 50 μm. (n = 3, values were presented as mean ± SD. ns: p > 0.05, *p < 0.05, **p < 0.01, ***p < 0.001)
Biodistribution in vivo
The distribution of HPMZIF in vivo was subsequently evaluated. After intravenous injection of IR-783-labeled PMZIF or HPMZIF into mice, the mice were scanned with the IVIS Spectrum system at selected times. As shown in the figure, the fluorescence intensity of IR-783-labeled HPMZIF reached its maximum at 6 h after injection. Due to the tumor targeting ability of HA, the tumor fluorescence intensity of mice in the HPMZIF treatment group was higher than that of the PMZIF group within the monitored time range, indicating that HPMZIF has good tumor targeting and enrichment capabilities (Fig. 5a, b). Similar results were obtained by fluorescence imaging of ex vivo tumor tissue (Fig. 5c). These results indicate that HPMZIF has good tumor targeting ability.
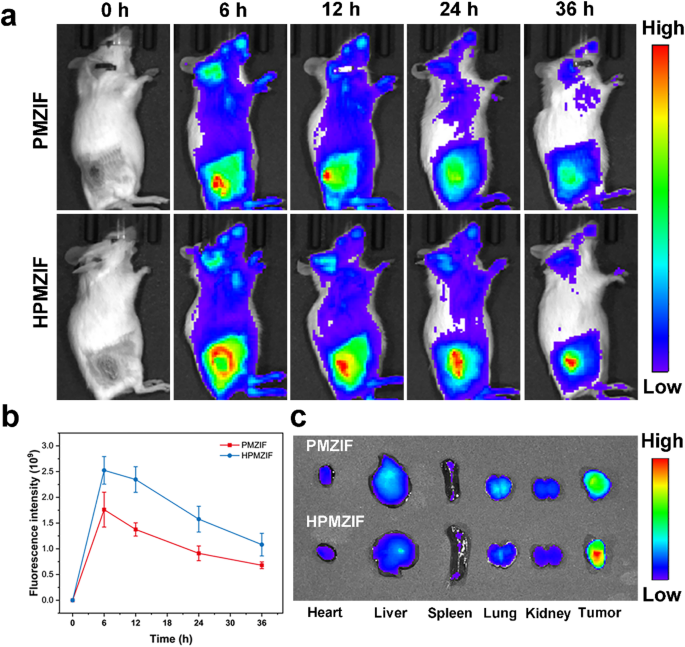
Distribution of drugs in different groups injected into the tail vein. (a) The in vivo distribution of IR-783@PMZIF or IR-783@HPMZIF was visualized using the IVIS spectral system after intravenous injection. (b) Tumor fluorescence intensity of mice at different time points after intravenous injection of IR-783@PMZIF or IR-783@HPMZIF. (c) Representative fluorescence images of isolated organs and tumors 24 h after intravenous injection of IR-783@PMZIF or IR-783@HPMZIF
In vivo anti-tumor therapy
Encouraged by the anti-tumor effect in vitro, we explored the anti-tumor ability of DOX@HPMZIF NPs in vivo. 4T1 tumor-bearing mice were randomly divided into five groups: Saline, DOX, DOX@MZIF, DOX@PMZIF, and DOX@HPMZIF. The results showed that, compared with the mild inhibitory effects of saline and free DOX, the DOX@HPMZIF group showed the most significant tumor growth inhibition effect (Fig. 6a, b, d, e), and similar results were achieved for tumor weight after treatment (Fig. 6c). This strong tumor inhibitory effect in the DOX@HPMZIF group may be due to the synergistic effect of pyroptosis caused by Zn2+ overload and oxidative stress induced by the Fenton-like activity of Mn2+, supplemented by the chemotherapeutic effect of DOX. In addition, H&E staining of the tumor tissues confirmed that DOX@HPMZIF could promote cancer cell apoptosis and necrosis, whereas Ki67 and TUNEL staining assays showed that cancer cell proliferation was significantly inhibited and apoptosis occurred in situ (Fig. 6f).
Interestingly, some studies suggest that ZIF-8 can induce tumor ICD and achieve tumor immune activation [51], and our nanoplatform can also significantly induce tumor cell ICD. In addition, Mn2+ has been reported to activate the cGAS-STING pathway and enhance tumor immunotherapy [52, 53]. Therefore, we believe that our nanoplatform has a similar ability to induce immune responses in the body. We detected the infiltration of T cells in tumor tissues to verify our results. The results showed that the number of infiltrating CD4+/CD8+ T cells in the tumors of the DOX@HPMZIF group increased significantly (Figure S16, Supporting Information), indicating that our nanoplatform can provide a good immune microenvironment for tumor immunotherapy.
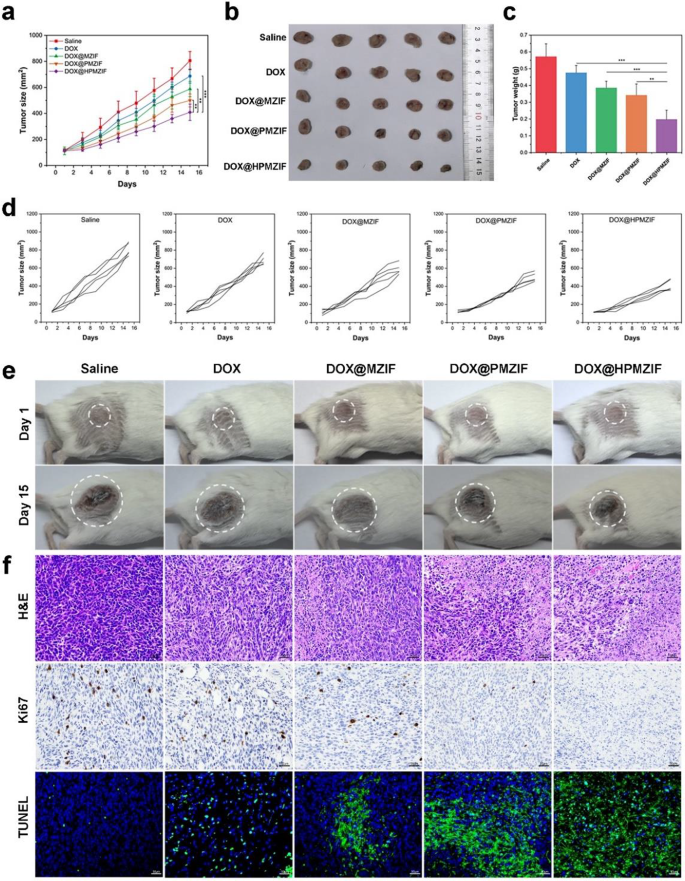
In vivo anti-tumor activity. (a) Tumor volume of tumor-bearing mice during treatment. (b) Digital photos of ex vivo tumors. (c) Tumor weights of different treatment groups. (d) Tumor growth of different treatment groups. (e) Photos of tumor size of 4T1 tumor-bearing mice before and after treatment. (f) H&E, Ki67, and TUNEL staining images of tumors of mice in different dosing groups. (n = 5, values were presented as mean ± SD. ns: p > 0.05, *p < 0.05, **p < 0.01, ***p < 0.001)
Biosafety of HPMZIF NPs
The biosafety of the nanoplatform is of great significance for in vivo applications. Therefore, we conducted hemolysis experiments, blood physiological and biochemical tests, and H&E staining of different organs to evaluate the biocompatibility of the nanoplatform. The results showed that HPMZIF NPs had no obvious hemolysis at a concentration of 2.5–200 µg/mL (Figure S17, Supporting Information). The in vivo anti-tumor study showed no significant change in the body weight of mice in any group (Figure S18, Supporting Information), and no obvious damage was observed after H&E staining of the isolated organs (Figure S19, Supporting Information). Additionally, blood physiological and biochemical analyses showed that alanine transaminase (ALT), aspartate aminotransferase (AST), alkaline phosphatase (ALP), creatinine (CREA), UREA, and uric acid (UA) levels in mice after treatment remained normal, indicating that there was no obvious damage to liver and kidney function (Figure S20, Supporting Information). These results demonstrate that our nanoplatform has good biocompatibility and biosafety.