Study design and patients
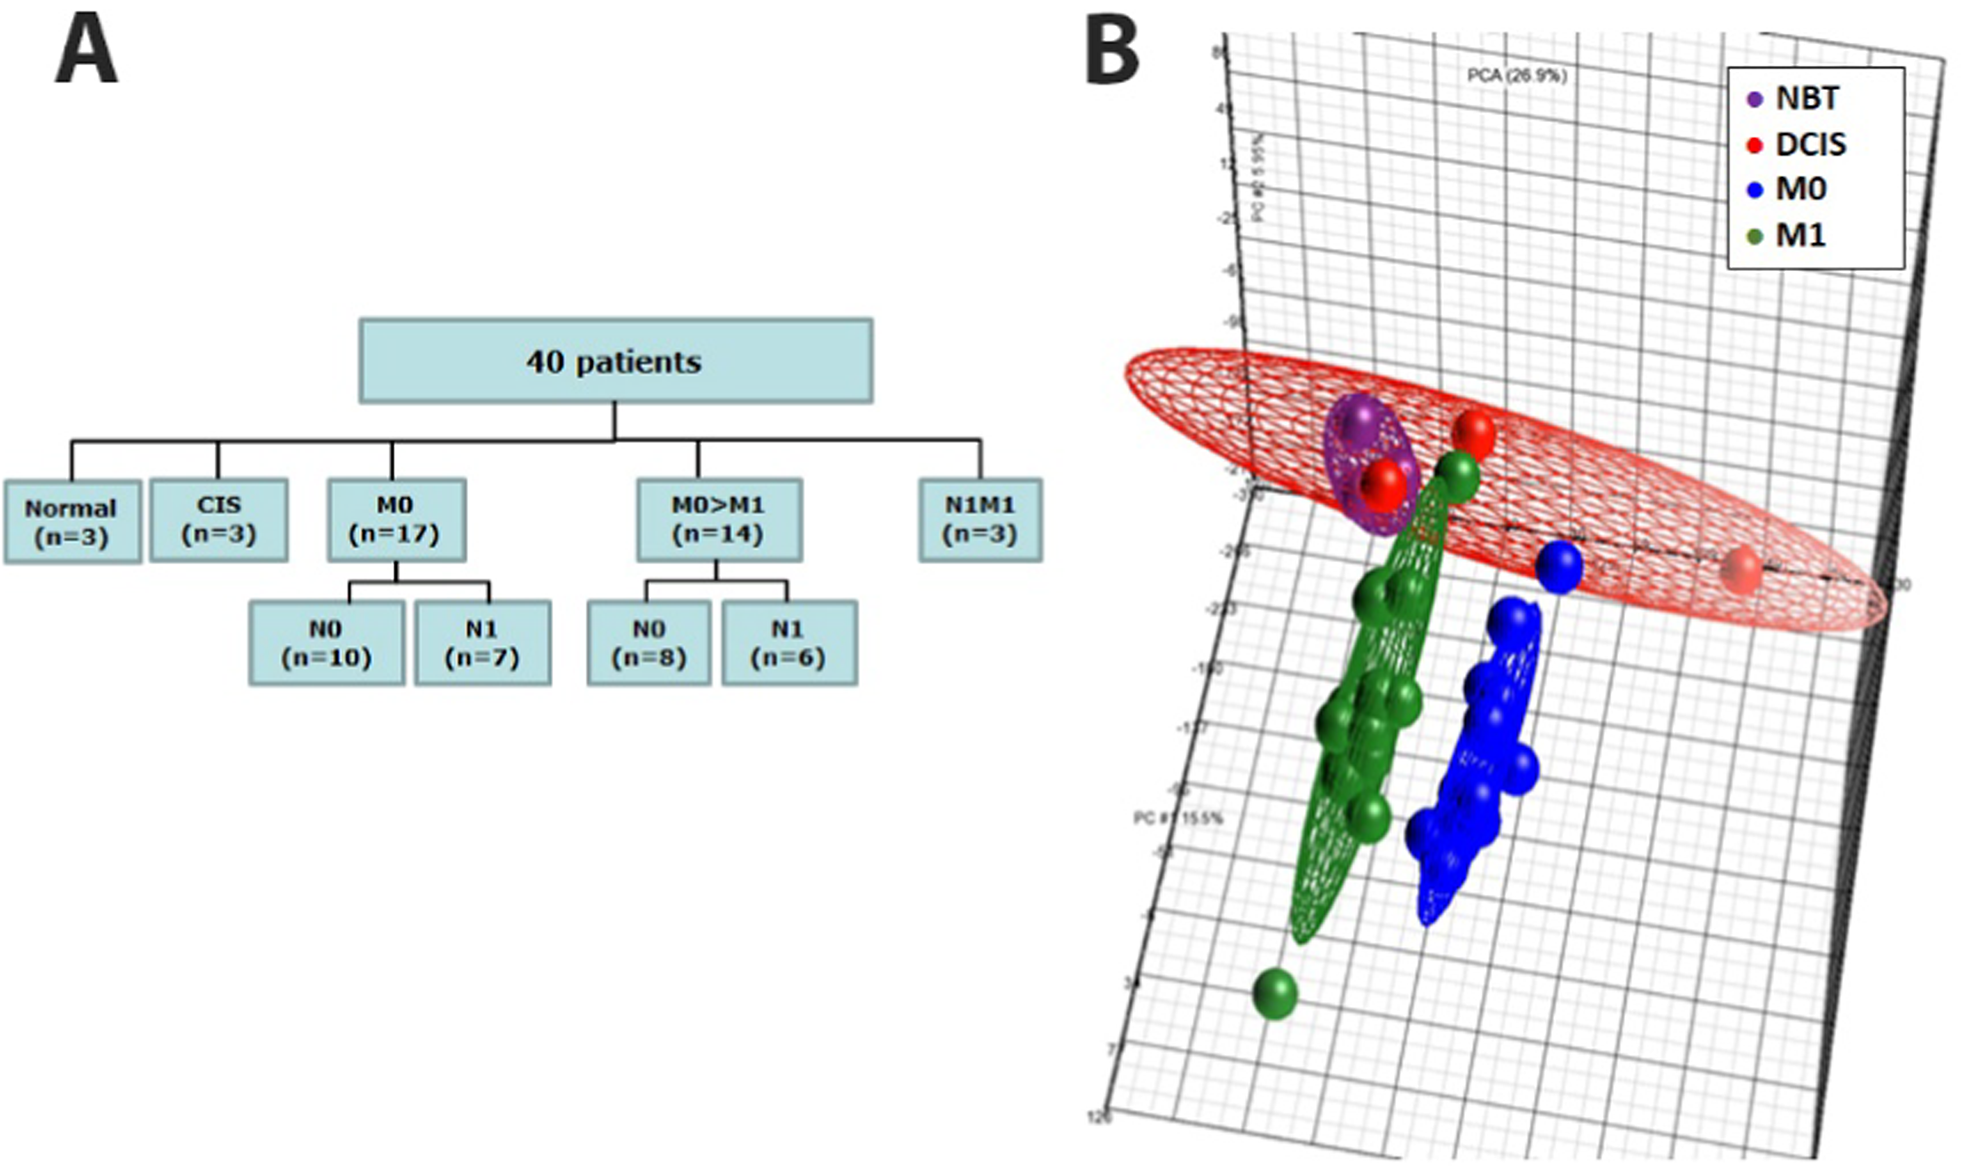
Microarray expression profiling was performed on 34 patients selected from the retrospective cohort of the BREMIR study (ClinicalTrials.gov ID NCT06555354) recruited at the Breast Unit of the IRCCS “Casa Sollievo della Sofferenza” (CSS) from 2004 to 2014. Normal breast tissues from (NBTs) (n = 3) and ductal carcinomas in situ (DCIS) (n = 3) were also analyzed as controls (Fig. 1A). Breast cancer patients met the following strict selection criteria: subjects with breast cancer, such that 50% of them had not developed distant metastases after 10 years of follow-up (M0), and the other 50% had developed distant metastases (M1) within 5 years of follow-up (n = 14) or showed synchronous metastases at diagnosis (n = 3). Patients in the M0 and M1 groups were matched for age, menopausal status, lymph node status, stage, hormonal status and Ki67/Mib1 expression. None of the breast cancer patients were treated with neoadjuvant therapy. This cohort was used to identify prognostic miRNA-based biomarkers via a global miRNA expression profiling approach.
Global miRNA profiling in the discovery cohort. A Flowchart describing the “discovery cohort” of 40 individuals used for performing global miRNA expression profiling by microarray. B Global views of miRNA expression by using Principal Component Analysis (PCA) among normal breast tissues (NBTs, red), in situ ductal carcinoma tissues (CIS, purple), non metastatic BC tissues (M0 blue) and metastatic BC tissues (M1, green)
The “extended cohort” included 223 invasive breast cancer patients from the BREMIR retrospective cohort and met the following inclusion criteria: female patients aged 18 years or older with breast cancer without metastases at diagnosis who were not treated with neoadjuvant therapy (M0) and who may have developed distant metastases during follow-up (M0 > M1) (Fig. 2). This cohort was used to build a prognostic model able to estimate the risk of developing distant metastases using information from both patients’ main clinicopathological variables and the most associated miRNAs identified in the discovery cohort. In both the discovery and extended cohorts, patients were followed until September 2019 (median follow up of 6.6 years).
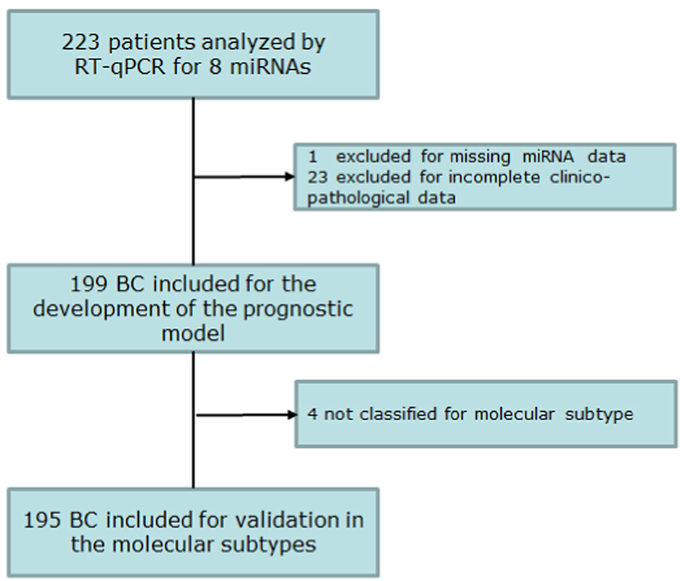
Flowchart describing the extended cohort. A total of 223 patients were profiled for miR-3613-5p and miR-3916. Complete miRNA expression data and clinicopathological information were available for 199 out of 223 patients and were used to build the multivariable prognostic model. Model validation of the breast cancer molecular subtypes was carried out in 195 out of 199 patients based on the availability of clear information about the tumor phenotype
In addition, we evaluated plasma samples from an independent cohort (“plasma cohort”) recruited at the Unit of Oncology of the IRCCS CSS from 2014 to 2019 who met the following strict selection criteria: female subjects with breast cancer, such that 50% were without metastases (BC) at the time of plasma sampling (n = 13), and the other 50% were affected by distant metastases (mBC) at the time of plasma sampling (n = 15). As controls, plasma samples were collected from patients with histologically confirmed benign breast lesions (i.e., “controls” with two fibroadenomas, three inflammatory conditions and six proliferative conditions) (n = 11). Blood samples were collected prior to surgery for BC patients and at the time of metastatic progression, prior to starting first-line treatments, for mBC patients. This cohort was used within a pilot study on plasma extracellular vesicles (pEVs) to determine whether the miRNAs included in the prognostic model were differentially expressed in individuals with distant metastases compared with non metastatic breast cancer patients and controls.
Clinicopathological data were reported in accordance with recommendations for tumor biomarker prognostic studies [12,13,14]. Patients were staged according to the World Health Organization staging system version 7th [15]. Patients received appropriate local treatment and adjuvant therapies following national and international guidelines.
Molecular subtypes were defined based on ER and PgR expression as determined by IHC, and HER2 amplification status was determined by FISH in three categories: luminal (ER-positive/PgR-positive), HER2-amplified and triple negative (ER-negative/PgR-positive/HER2-not amplified).
The demographic characteristics of the three cohorts are detailed in Supplemental Tables 1, 2 and 3.
The study complies with international (Helsinki Declaration 7th rev, 2013, EU Directive 2004/23/EC) and Italian (D. Lgs. 30/06/2003, n. 196) regulations for human subject research. Ethical approval was obtained from the IRCCS “Casa Sollievo della Sofferenza” Ethical Committee (Prot N 140/CE). Written informed consent was obtained from all participants following the approved experimental protocol.
RNA extraction
Breast cancer tissues were collected at the Breast Unit IRCCS “Casa Sollievo della Sofferenza.” Tissues were snap-frozen and stored at − 80 °C until use. Only one tumor specimen (50–100 mg) per patient was collected for legal reasons. Tissue specimens were selected based on visual inspection of hematoxylin and eosin (H&E)-stained 5-μm-thick sections to ensure that the tumor samples contained at least 70% cancer cells and to confirm that the tissues obtained via reductive mammoplasty (NBT) contained normal epithelial gland components. Total RNA was obtained from fresh frozen tissue using TRIzol reagent following the manufacturer’s instructions. RNA quality was evaluated by using a 2100 Expert Analyzer (Agilent Technology), and only RNAs with an RNA Integrity Number (RIN) ≥ 7.0 were processed.
Microarray analysis
For each sample, 8 μL of total RNA was labeled using the 3 DNA Array Detection Flash Tag RNA Labeling Kit (http://www.genisphere.com) following the manufacturer’s instructions. Each sample was hybridized on a GeneChip® miRNA 4.0 Array with 30,424 probe sets for 203 organisms, including 848 human miRNAs. After washing and staining, the chip array was scanned with a Gene Chip Scanner 3000 7G. Signal preprocessing included background correction, quantile normalization, log2 transformation, and median polishing summarization. The Partek Genomics Suite® software v6.6 was used for data analysis, which involved Principal Component Analysis (PCA) for visualizing high-dimensional data and detecting outlier samples. Analysis of variance (ANOVA) identified differentially expressed miRNAs (p value < 0.05, fold change cut off of 2), with the false discovery rate (FDR) controlled through the Benjamini‒Hochberg method.
Quantitative reverse transcription polymerase chain reaction (RT-qPCR)
miRNA levels were quantified using a relative quantification method with a standard curve. Single-stranded cDNA was synthesized from 10 ng of total RNA using the TaqMan MicroRNA Reverse Transcription Kit (Thermo Fisher Scientific) and 50 nM specific stem‒loop RT primers (assay ID in Supplemental Table 4), with RNU48 serving as an endogenous control. Real-time PCR was conducted on an ABI PRISM 7900HT Sequence Detection System (Thermo Fisher Scientific) in 384-well plates. Standard curves for miRNAs and RNU48 were generated, and expression levels were determined by calculating the ratio of miRNA copy number to RNU48 copy number, which was multiplied by 1000 for easier tabulation (i.e., miR-/RNU48 × 1000).
Droplet digital PCR analysis (ddPCR)
miRNA copy number was determined in plasma extracellular vesicles (pEVs) by ddPCR. Briefly, 5 mL of blood was collected from each patient in 0.129 mol/l sodium citrate tubes and processed within 4 h of sampling. Blood samples were centrifuged at 3000 rpm at 4 °C for 15 min. The plasma was collected, further centrifuged at approximately 13,000 rpm at 4 °C for 15 min and stored at -80 °C until analysis. pEVs and pEV-miRNAs were analyzed as previously reported [16]. Briefly, an EV pellet was obtained from 500 µL of plasma centrifuged in a bench centrifuge and then resuspended in 0.02 µm of filtered phosphate buffer. RNA was extracted from 50 µL of pEVs, and EV RNA was quantified with a Qubit microRNA Assay Kit (Thermo Fisher Scientific). Finally, 100 pg of RNA was used to quantify miR-3916 and miR-3613-5p (TaqMan Advanced miRNA Assays, Thermo Fisher Scientific) by droplet digital PCR (ddPCR, QX200 Bio-Rad).
Statistical analyses
Descriptive characteristics are reported as medians along with interquartile ranges (i.e., first-third quartiles) and frequencies (valid percentages) for continuous and categorical variables, respectively. The miRNA expression levels were first natural log-transformed and then standardized before being used for statistical analysis.
The risk of developing distant metastases was assessed using a prognostic model developed in the “extended cohort” in two steps. First, highly associated miRNAs from the discovery cohort were identified using stepwise multivariable logistic regression. All observations with missing values for any of the miRNA variables were excluded from the analysis (complete case analysis). The procedure was stopped when the optimal set of miRNAs that minimized the model’s Akaike Information Criteria (AIC) was reached.
To assess the reliability of the set of identified miRNAs, a validation process of this model was also performed using bootstrap datasets. This involved 5000 resamples of data to determine the frequency with which each miRNA was 1) selected, 2) associated with a positive or negative regression coefficient, and 3) deemed statistically significant. In addition, other statistical models and machine-learning algorithms, such as cross-validated LASSO regression, Conditional Random Forest and Support Vector Machines were performed to further assess the robustness of the selected miRNAs (see Supplemental Methods for more details).
In the second step, the model was re-run using the miRNAs identified in the first step within the subset of patients who had both non-missing miRNA data and the following clinicopathological variables: pathological stage, histological grade and percentage of ki67/miB1-positive cells. Both unadjusted (miRNAs only) and fully adjusted (miRNAs and clinicopathological data) models were estimated and compared. Risks are reported as odds ratios (ORs) along with their 95% confidence intervals (CI). The discriminatory ability of each model was assessed by computing the Area Under the receiver operating characteristic Curve (AUC) of the individual predicted probabilities of developing distant metastases. The AUCs of the two nested models were compared using the DeLong test (17 De Long 1988). Moreover, model’s calibration (which reflects the agreement between predictions and observed outcomes) was assessed by a nonparametric smoothed calibration curve, estimated over a sequence of predicted values, and by the integrated calibration index (ICI) [17]. To obtain the calibration curve, 1000 bootstrap resamples were performed to obtain optimism-corrected (i.e., overfitting-corrected) estimates of the predicted vs. observed values. The plot shows smoothed curves for the original calibration and the optimism-corrected calibration. A perfect calibration should lie on or around a 45° line of the plot.
Based on the individual predicted probabilities, each patient was classified as having a low, medium or high risk of developing distant metastases. The cut-offs used to categorize these probabilities were determined using the Classification and Regression Trees (CART) algorithm [18].
Furthermore, comparisons of miRNA expression in pEVs between two groups (i.e., tumors vs. controls and mBC vs. BC) in the “plasma cohort” were statistically assessed by the Mann‒Whitney U test and the magnitude of these differences (i.e., effect size) was quantified by the Glass rank-biserial correlation coefficients.
Statistical significance was declared as a p value < 0.05. All the statistical analyses were carried out using the free software R (R Foundation for Statistical Computing, ver. 4.2, libraries: “tableone”, “pROC”, “bootStepAIC”, “rms”, “gweissman/gmish”, “rpart”, “rcompanion”).
Bioinformatics analyses
Pathways associated with selected miRNAs were identified using miRPathDB ver. 2.0, an online miRNA pathway dictionary database [19, 20]. This tool was used to provide evidence of any statistically significant association of miRNAs with pathways, which were obtained from Reactome, KEGG, and WikiPathways databases, and Gene Ontology terms. Further investigation was conducted using Ingenuity Pathway Analysis (IPA; QIAGEN, Redwood City, CA; www.qiagen.com/ingenuity), exploiting the “Path Explorer” functionality, which enabled us to link selected miRNAs to genes based on evidence of miRNA-gene targeting.