
Overview of (Phi)-Space
(Phi)-Space is a computational framework for continuously phenotyping single-cell datasets based on an annotated bulk or single-cell reference dataset. Figure 1 gives an graphical overview of (Phi)-Space; see Methods section for an detailed explanation. We present 4 biological case studies to showcase the versatile usability of our (Phi)-Space framework. These case studies are summarized in Table 1.
Overview of (Phi)-Space. A (Phi)-Space continuous phenotyping based on a reference dataset with discrete phenotype labels and a query cell states are then continuously characterized. B The core of (Phi)-Space is partial least squares (PLS) regression. For within-omics annotation, a PLS regression model is trained on reference data ((X_{text {ref}}, Y_{text {ref}})) to compute B, a matrix converting omics features to continuous phenotype scores. The phenotype space embeddings of both reference and query are computed as rescaled versions of (X_{text {ref}} B) and (X_{text {query}} B). C (Phi)-Space multi-omics annotation when both reference and query contain multiple matching modalities. We first conduct within-omics annotation for each modality independently, and then concatenate the phenotype space embeddings derived from different modalities. This multi-omic phenotype space embedding is then used for downstream analysis. D (Phi)-Space cross-omics annotation when reference (X_{text {ref}}) and query (Z_{text {query}}) contain different omics features. We use a bimodal bridge dataset ((X_{text {bridge}}, Z_{text {bridge}})) sharing omics features with both reference and query: first annotate the bridge cells using the reference modality, i.e., computing (hat{Y}_{text {bridge}}) as rescaled (X_{text {bridge}} B); then train a new PLS model to learn the relationship between the other modality (Z_{text {bridge}}) and the derived continuous annotation (hat{Y}_{text {bridge}}), resulting in (B_{text {bridge}}); finally annotate query data (Z_{text {query}}) by computing (hat{Y}_{text {query}}) as rescaled (Z_{text {query}} B_{text {bridge}}). E–H Downstream analyses based on phenotype space embeddings (hat{Y}_{text {ref}}) and (hat{Y}_{text {query}}). E Reference mapping: reduce the dimension of (hat{Y}_{text {ref}}) by principal component analysis (PCA), where each PC is interpreted as a “meta-phenotype,” and then (hat{Y}_{text {query}}) is mapped to this PC space via the loading vectors learned from (hat{Y}_{text {ref}}). F Marker selection: given some grouping of query cells (e.g., disease conditions), identify phenotypic markers (e.g., enriched cell types) of each group. G Clustering:apply clustering algorithms to (hat{Y}_{text {query}}) to identify biological meaningful cell states in the query. H Hard classification: for each query cell, select the highest scored cell type as the predicted cell type for that cell
Case study 1: dendritic cells (DC)
We show (Phi)-Space’s ability to characterize developing cell identity by projecting scRNA-seq data from [22] to a bulk RNA-seq reference atlas generated by [23]. The query scRNA-seq dataset consisted of 33,525 in vitro induced human dendritic cells (DCs) and some in vivo DCs served as control cell types. The bulk reference RNA-seq data consisted of 341 bulk RNA-seq samples of different DC and monocyte subtypes from 14 studies and 10 laboratories. We applied (Phi)-Space to continuously phenotype the query cells using the 7 cell types and 4 cell culture methods defined in the reference.
The bulk DC atlas [23] is a comprehensive resource for DC biology, including DC subtypes from multiple sample sources (e.g., in vivo, in vitro, ex vivo). Due to the important role of induced DCs in immunotherapeutics [24], this atlas provides a computational resource for validating the molecular characteristics of induced DCs, such as those generated by Rosa et al. [22].
Case study 2: Perturb-seq
To fully leverage the refined immune cell states defined in bulk atlases and the intrinsic high signal-to-noise ratio of bulk data, we used (Phi)-Space to quantify the effects of genetic perturbations on T cell states in a CRISPR activation (CRISPRa) Pertub-seq dataset [25]. CRISPRa Perturb-seq couples gain-of-function CRISPR screening (i.e., the expression of each perturbed gene is enhanced rather than suppressed) with scRNA-seq, allowing us to evaluate the effects of gene activation on gene expression. Over 70 genes were perturbed in this particular study, which contained 28,453 primary human T cells. To evaluate the cell states of these query T cells, we used the DICE bulk atlas containing containing 1561 immune cell samples, where over 1100 were T cell samples consisting of 11 refined cell states [26].
The DICE immune cell atlas [26] contains detailed annotation of T cell states, which serves as a standard reference for T cell biology. By integrating conventional bulk RNA-seq with state-of-the-art Perturb-seq, we effectively designed a (Phi)-Space-based workflow to quantify the effects of genetic perturbations on altering T cell states.
Case study 3: CITE-seq
We illustrate (Phi)-Space’s ability to integrate different omics modalities in a common phenotype space. We used cellular indexing of transcriptomes and epitopes by sequencing (CITE-seq) data from [27] as the reference and queried CITE-seq data from [28]. CITE-seq provides simultaneous measurement of transcripts (RNA) and surface proteins (ADT, antibody-derived tag) at the single-cell level [29]. The reference atlas contained 64,733 peripheral blood mononuclear cells (PBMCs) from 130 donors with different levels of COVID-19 severity, whereas the query contained 97,499 PBMCs from 22 COVID-19 patients with different types of pre-existing autoimmune diseases. We applied (Phi)-Space to phenotype the query cells using the 18 broad cell types, 51 fine cell types, and 9 categories of COVID-19 severity.
The reference CITE-seq dataset [27] comes from a large-scale COVID-19 study, which also forms part of the Human Cell Atlas. It contains a large number of patient samples, covering a range of disease severity categories. Mapping the COVID–autoimmunity CITE-seq dataset of Barmada et al. [28] to the reference dataset enables a comprehensive characterization of the immune landscape of COVID-19 patients with pre-existing autoimmune conditions.
Case study 4: scATAC-seq
We systematically benchmarked (Phi)-Space’s ability to transfer cell type labels within or across omics types. We used the bone marrow mononuclear cell (BMMC) 10x multiome dataset from [30]. This bimodal dataset contains matched RNA and assay for transposase-accessible chromatin with sequencing (ATAC) measurements of 69,249 BMMCs from 13 experimental batches, all from healthy donors. The ATAC measurements are available in two resolutions: peaks (computationally inferred open chromatin regions) and gene activity scores (gene level aggregated peaks). Luecken et al. [30] manually annotated the cells, and we use their annotation as ground truth. We designed two cross-validation (CV) procedures:
-
For within-omics annotation, we used only the RNA modality of the 10x multiome dataset for CV. In each of the 13 CV iterations, we used 1 of the 13 batches of annotated scRNA-seq data (or its pseudo-bulked version) as the reference and the remaining 12 batches as queries (with ground truth labels hidden).
-
For cross-omics annotation, we used both the RNA and ATAC modalities. An additional well annotated BMMC scRNA-seq dataset from a single healthy donor [9] was used as the reference. Then, in each of the 13 CV iterations, we used 1 of the 13 batches of bimodal data as the bridge (Fig. 1D). For the remaining 12 batches, we used only their ATAC modality as scATAC-seq queries (with ground truth labels hidden).
Classification errors, compared to ground truth cell type labels in the query, were then calculated. In the cross-omics annotation case above, since the cell type labels in the reference and those in the multiome data were named according to different conventions, we manually regrouped the labels into common broad cell type labels to make the calculation of classification error possible (see Additional file 1: Tables S1 and S2 for details).
Both the BMMC scRNA-seq dataset [9] and the BMMC multiome dataset [30] are widely used in benchmark studies, due to their well-defined ground truth cell type labels. In addition, the multiome dataset contains multiple batches with unignorable batch effects, which is representative of the real-world experimental designs.
Continuous characterization of developing cell states
Conventional cell type annotation methods assign a known cell type label in the reference to each query cell. While suitable for identifying well characterized and typical cell types, these methods are under-powered in characterizing transitional or atypical cell identities [8, 9]. In addition, these methods assume each sample or cell has a unique cell type label and thus fail in considering multiple layers of phenotypes. Also, in a typical computational workflow [8, 31], cell type annotation is deployed as a separate step, independent from batch effect removal. This may lead to suboptimal annotation results since phenotypic variation is often confounded with experimental batches (e.g., certain cell types or disease conditions only come from certain batches). Thus, a complete removal of batch effects may entail partial loss of between-phenotype heterogeneity.
To address these problems, (Phi)-Space provides a holistic approach where batch effects removal is tailored for cell type annotation. Instead of assigning a unique cell type label to each query cell, (Phi)-Space enables a joint modeling of multiple layers of phenotypes. In addition, the (Phi)-Space continuous phenotyping results are effective for characterizing transitional cell states. We illustrate these appealing characteristics of (Phi)-Space using our first case study below. Our analyses described below suggest that (Phi)-Space can remove strong batch effects in the reference atlas of [23], while preserving enough biology to characterize transitional cell states of the induced dentritic cells (DCs) of [22].
(Phi)-Space selects genes to remove unwanted variation in bulk data
Since the DC dataset from [23] contains a large number of 341 samples generated by multiple cell culture methods, it can serve as a reference for benchmarking new in vitro models of DC biology. In particular, it is suitable for testing if the reprogramming method of [22] has successfully cultured induced DCs. However, in the original bulk reference dataset with 16,562 genes, the batch effects caused by the sequencing platform dominates the variation (Fig. 2A). To remove the strong platform effects, [23] applied a feature selection approach introduced by [14] to filter out genes whose variations were mainly explained by the platform, resulting in a total of 2416 genes were kept and the platform effects were much alleviated (Fig. 2B). However, since the platform effects were confounded with the sample source, the differences between, say, in vitro and in vivo samples were also blurred in the PC space. In contrast, (Phi)-Space selected a smaller subset of 1822 features, which retained some platform effects but, as a result, also preserved a better separation of sample sources (Fig. 2C).
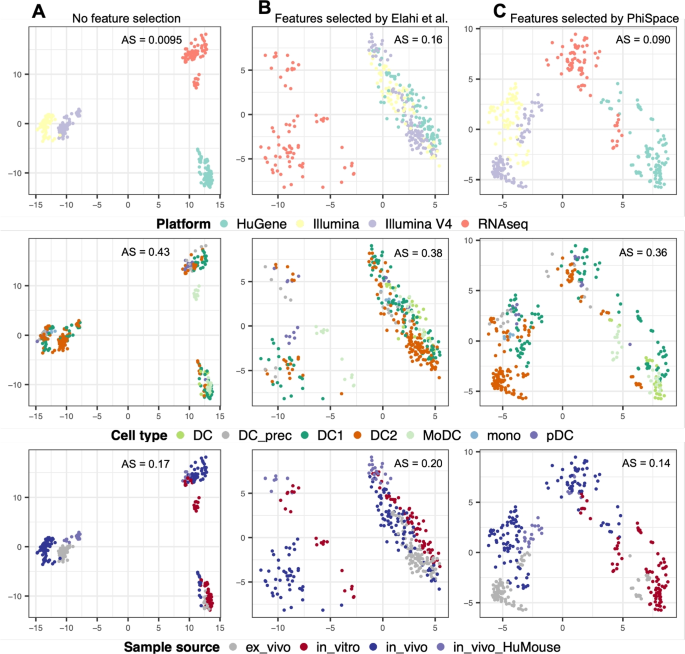
Benchmarking feature selection for building reference atlas. Each column shows all bulk reference samples from [23] viewed from PC1 and PC2 computed using: A all features, B features selected by [23], and C features selected by (Phi)-Space. The samples are colored by platform, cell type, and sample source. AS: alignment score computed using 20 PCs (see Additional file 2: Section S1.1); larger AS implies better mixing (equivalently poorer separation) of samples from different conditions. Without any gene filtering, the platform effects were the strongest (AS = 0.0095) and the separation of cell types was the poorest (AS = 0.43); the feature selection of [23] significantly removed platform effects (AS = 0.16, best mixing of batches) and had a better separation of cell types (AS = 0.38), but it led to the poorest separation of sample source (AS = 0.20); (Phi)-Space had the best separation of cell types (AS = 0.36) and sample source (AS = 0.14) by preserving some platform effects that confounds the sample source (AS = 0.090)
(Phi)-Space phenotype space reference mapping reveals developing cell identity
Even though Fig. 2C provides a suitable reference atlas for DC biology, mapping scRNA-seq to this atlas remains challenging. This is due to the technical differences between bulk and single-cell RNA-seq data, including the much higher proportion of zero counts in the single-cell query compared to the bulk reference. A naive PCA-based reference mapping (Additional file 2: Section S1.2) resulted in visualization that is difficult to interpret (Fig. 3A) [15] tackled this problem by proposing an imputation method to reduce the sparsity of the scRNA-seq query. However, Sincast imputation did not significantly improve the interpretability of reference mapping results (Fig. 3B): while the in vivo DC subtypes (DC1, DC2, and pDC) showed improved alignment with their bulk counterparts, the induced DCs (Day3, Day6, and Day9) remained misaligned with bulk samples. This result suggested that imputation might not be sufficient for bridging the gaps between bulk and single-cell RNA-seq data in this case.
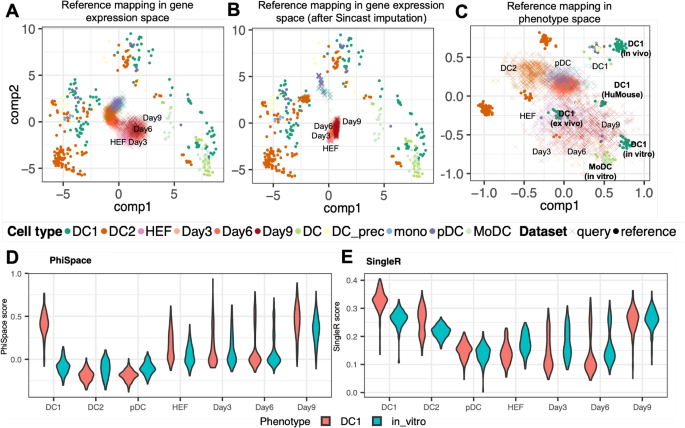
Characterization of developing dendritic cell (DC) identities. A–C Benchmarking reference mapping in gene space and in phenotype space, showing bulk reference samples ((bullet)) from [23] and query single cells ((times)) from [22]. HEFs: human embroyonic fibroblasts; Day3, Day6, and Day9: induced DCs, i.e., HEFs after 3, 6, and 9 days’ reprogramming towards DCs. A We first built bulk reference atlas by conducting a PCA of the reference gene expression using genes selected by (Phi)-Space (depicted in Fig. 2C) and the query gene expression data were mapped to PC1 and PC2 using the bulk reference PCA loadings. The query cells were concentrated around the origin (0, 0) due to the high sparsity of the scRNA-seq gene expression matrix. B We then mapped scRNA-seq data imputed using Sincast [15] to the same bulk atlas. The induced DCs were still misaligned with the bulk samples. C Lastly we built bulk reference atlas by conducting a PCA of phenotype space embeddings of the bulk reference and the phenotype space embedding of query cells were then projected onto PC1 and PC2. A convergence of reprogrammed HEFs towards in vitro type-1 conventional dendritic cell (DC1) could be observed. D and E Benchmarking influence of joint modeling on continuous phenotyping: D (Phi)-Space annotation, where a gradual increase of the DC1 and in vitro identities during 9 days of reprogramming could be observed, and where the in vivo non-DC1 control cell types (DC2 and pDC) showed very low DC1 and in vitro scores; E SingleR scores computed using genes selected by (Phi)-Space, where a comparable transition of the induced DCs was observable, but the DC2 cells were assigned overly high DC1 scores
Unlike conventional annotation methods, (Phi)-Space focuses on the phenotype space rather than the gene expression space. This approach enables us to circumvent the harmonization of bulk reference and single-cell query. In (Phi)-Space, we first compute the PCs of (hat{Y}_{text {ref}}), instead of the gene expression matrix (X_{text {ref}}), and then map (hat{Y}_{text {query}}) to these PCs (see Methods “Downstream analyses” section). Figure 3C shows the phenotype space reference mapping results for the DC case. After 3, 6, and 9 days of in vitro reprogramming, the induced DCs converged to the bulk in vitro type-1 conventional dendritic cell (DC1) samples in the reference. In contrast, the DC1s in the query, used by [22] as the control, tended to be closer to their bulk counterparts compared to all other cells. Overall, we observed that the in vivo and induced DCs tended towards two different directions defined by the reference phenotypes. This was confirmed by the heatmap representation of the phenotype space embedding of query cells and a marker gene analysis (Additional file 1: Figs. S1 and S2).
(Phi)-Space can jointly model two layers of phenotypes
In addition to removing unwanted source of variation, (Phi)-Space’s joint modeling of cell type and sample source yielded more interpretable continuous phenotyping results (Fig. 3D and E). This can be seen by comparing our results to SinlgeR [12], which also provides continuous phenotyping but can only separately model cell type and sample source. From the (Phi)-Space results (Fig. 3D) we observed a gradual increase of both DC1 and in vitro scores of induced DCs during the reprogramming and a clear distinction of the three control cell types DC1, DC2, and pDC (all in vivo). We then applied SingleR [12] to genes selected by (Phi)-Space (Fig. 3E), as SingleR is one of the few methods designed to annotate scRNA-seq data using bulk RNA-seq reference. While SingleR provides continuous phenotyping results based on the Spearman correlation between the reference and query samples, it is unable to train a multi-label model to predict the cell type and the sample source simultaneously. Therefore, we trained two SingleR models to separately predict the two layers of phenotypes, cell type and sample source. From the SingleR results (Fig. 3E), we observed a comparable transition from HEF to Day 9 induced DCs. However, the SingleR results suggested that the in vivo DC1 and DC2 in the query had strong in vitro DC1 identity, which was not biologically sensible, suggesting that SingleR was underpowered to jointly model the phenotypic variation pertaining to cell type and sample source.
Summary
Through the DC case study, we illustrated how (Phi)-Space provides a streamlined way for mapping scRNA-seq queries to bulk reference atlases and reveal developing cell identities. We showed that (Phi)-Space selected biologically meaningful genes to preserve the phenotypic variations in a heterogeneous collection of bulk datasets. To visualize bulk samples and single cells side by side, (Phi)-Space performs reference mapping using the phenotype space embeddings of reference and query rather than the gene expression. By doing so, our approach does not require explicit harmonization of these two types of data, such as imputation. In addition, (Phi)-Space successfully modeled two different layers of cell phenotypes, cell type and sample source, yielding better results compared to modeling them independently. In terms of biological insights, our analyses described above confirmed the claim of [22] that their experimental method has reprogrammed HFEs to induced DCs with DC1-like transcriptional profile.
Quantifying effect sizes of genetic perturbations in Perturb-seq
Perturb-seq has been widely used to quantify the effects of genetic perturbations on cellular gene expression, due to its unique capability to couple CRISPR screening with scRNA-seq [32, 33]. However, since the perturbation of individual target genes often have relatively small effects on the expression of individual target genes, quantifying the effects of genetic perturbations on cell state alterations is challenging. Here we propose a strategy based on (Phi)-Space to address this challenge. We first annotate perturbed cell states using a reference dataset with (Phi)-Space. We then examine how individual perturbations affect the phenotype space embedding of perturbed cells compared to unperturbed cells. Since the phenotype space embedding quantifies cell states, we can directly assess the effect sizes of genetic perturbations on cell states.
We quantified the effects of the perturbation of over 70 genes in a CRISPR activation (CRISPRa) screening of human primary T cells [25] with (Phi)-Space. The DICE (database of immune cell expression, expression quantitative trait loci and epigenomics) bulk RNA-seq atlas [26] was used as the reference to derive T cell states. See Overview of (Phi)-Space section for more details on the dataset.
(Phi)-Space captures nuanced T cell states
CD4 and CD8 are two major T cell types. Schmidt et al. [25] claimed that their dataset showed relatively even distributions of CD4 and CD8 T cells. They demonstrated this by defining a CD4 score based on the relative expression levels of CD4 vs CD8 marker genes (Fig. 4A). The (Phi)-Space phenotype embedding allowed us to define a reference-based CD4 score, measuring how each cell scored on CD4 subtypes relative to CD8 subtypes (see Additional file 2: Section S2). This (Phi)-Space-derived CD4 score resulted in distributional patterns consistent with the authors (Fig. 4A). Furthermore, to quantify T cell activation, Schmidt et al. defined an activation score based on known gene markers (Fig. 4B). In comparison, our (Phi)-Space-derived activation score, defined by adding up each cell’s (Phi)-Space scores of activated T cell subtypes, showed more nuanced stratification of differentially activated T cell states (see Additional file 2: Section S2).
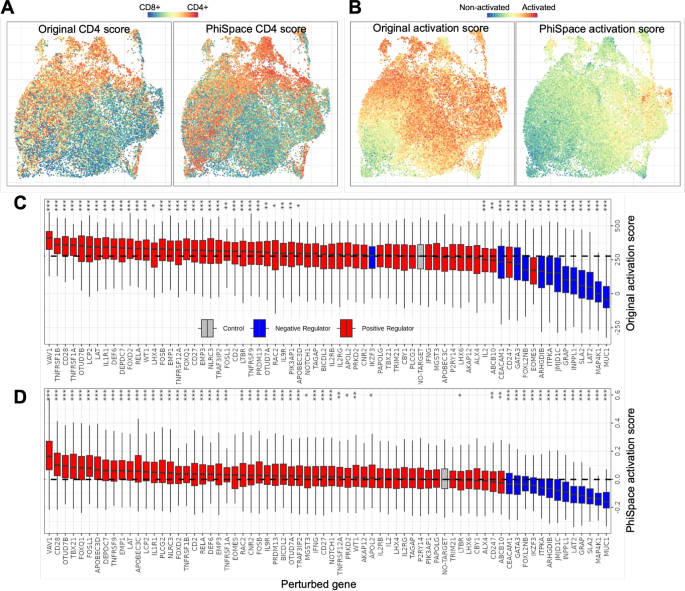
Quantifying effects of CRISPRa perturbation. A and B UMAPs of T cells colored according to the original study [25] and the (Phi)-Space-derived CD4 scores (A) or activation scores (B). C and D Boxplots showing the effects of individual gene perturbations on T cell activation according to the original activation scores [25] (C) and (Phi)-Space-derived activation scores (D). Perturbed genes were categorized according to prior knowledge as positive, negative regulators, where “control” refers to unperturbed cells. Significance levels (Bonferroni-corrected) of each perturbed gene compared to unperturbed cells are indicated (***: (p < 0.001); **: (p < 0.01); *: (p < 0.05))
(Phi)-Space enables more interpretable quantification of perturbation effects
Using their activation score, Schmidt et al. [25] found that most of the positive (negative) regulators, i.e., genes known to have positive (negative) effects on T cell activation, resulted in significantly higher (lower) activation scores compared to unperturbed cells (“Control”), as illustrated in Fig. 4C. Notably, the effect of a negative regulator IKZF3 was found indistinguishable from unperturbed cells. In contrast, according to (Phi)-Space-derived activation score, we found that IKZF3 had a significantly negative effect on activation, consistent with prior knowledge (see Fig. 4D). In addition, more positive regulators were found significant according to (Phi)-Space. These results have demonstrated that the (Phi)-Space-derived activation score is biologically more interpretable compared to the activation-marker-based score of the authors.
The rich cell state information contained in our phenotype space embedding also enables the quantification of perturbation effects on T cell states other than activation. For example, we found that enhancing genes TBX21 and GATA3 significantly contributed to T helper 1 (Th1) and T helper 2 (Th2) cell states, respectively (Additional file 1: Fig. S3). These two genes are known to play key roles in Th1 and Th2 differentiations [34, 35].
Summary
Through the Perturb-seq study, we illustrated how (Phi)-Space leveraged the fine immune cell state annotation in a bulk atlas to quantify the effect size of genetic perturbation in a large scale Perturb-seq study. Our results not only provided more interpretable effect size quantification than marker-gene-based approach, but also opened the possibility for more comprehensive evaluations of perturbation effects on T cell states.
Single-cell multi-omics integration in phenotype space
With the maturation of single-cell multi-omic sequencing, single-cell reference atlases consisting of multimodal datasets, e.g., CITE-seq atlases, are becoming more common [27, 29, 36]. Since both the RNA and the ADT modalities of CITE-seq are useful in characterizing the cell identities related to immune responses, several methods focusing on integrating these two modalities have been proposed [37,38,39]. However, a method for jointly querying multimodal data against multimodal references is still lacking. We provide a solution to this problem based on the (Phi)-Space multi-reference annotation (described in Methods “Downstream analyses” section) as follows. First, we trained a PLS model using the RNA features for predicting both COVID-19 severity and 51 fine immune cell types. Then, we trained another PLS model using the ADT features only for predicting the severity and 18 broad cell types, since the number of ADT features (192) is under-powered for predicting the large number of fine cell types. We then concatenated the predicted phenotype scores for the query cells derived using their RNA and ADT features. Our phenotype space analysis provided some fresh insights to the complex interactions between disease conditions and cell type compositions.
Phenotype space embeddings provide biology-preserving integration across batches and modalities
Both the RNA and ADT modalities of the query data showed significant batch effects (Fig. 5A, B). Barmada et al. [28] used totalVI [37], a state-of-the-art integration method for CITE-seq based on variational autoencoders, to integrate the two modalities while removing batch effects. However, this complete removal of batch effects also blurred the boundaries between cell types and rendered cells from different disease conditions no longer distinguishable (Fig. 5C). In contrast, we computed three versions of phenotype space embeddings from (Phi)-Space, Seurat V3, and Seurat V4 (Fig. 5D–F, respectively); see Additional file 2: Section S2.1 for how we applied Seurat V3 and V4 [9, 38]. We applied Seurat V3 and V4, rather than SingleR, since SingleR is computationally intensive for large number of cells (see Table 1). Both figures showed well-separated cell types while preserving the differences between disease types. Notably, no batch effects removal step was needed to achieve this separation. This result illustrated the superiority of the phenotype space embedding in preserving complex phenotypic variations and integrating query modalities in the phenotype space.
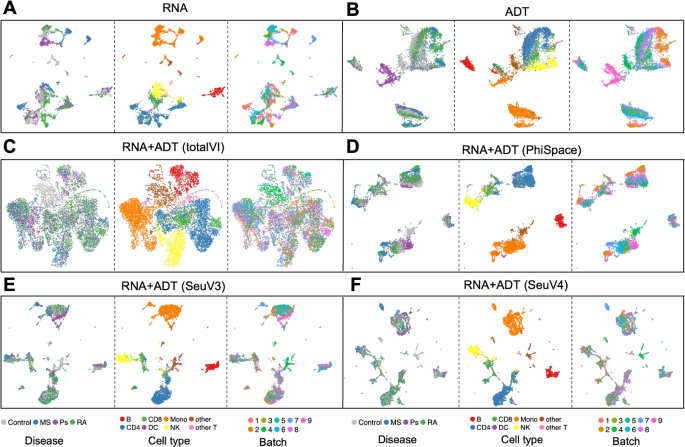
Different representations of query cells in the CITE-seq case study. Uniform manifold approximation and projection plots (UMAPs) based on: A and B PCs of RNA and ADT features, C 64 latent variables from totalVI [37], computed using both RNA and ADT features, D 64 PCs of the 87-dimensional (Phi)-Space phenotype space embedding, computed using both RNA and ADT modalities, and E and F 64 PCs of the 87-dimensional Seurat V3 and Seurat V4 phenotype space embedding, computed using both RNA and ADT modalities. We obtained the totalVI UMAP results from [28], who set the number of latent variables to be 64. To make our results comparable to the totalVI results, we reduced the dimension of the phenotype space embedding to 64 by PCA. UMAPs of the RNA and ADT modalities showed significant batch effects. TotalVI completely removed the batch effects, but also removed the difference between disease conditions. In contrast, the phenotype space embeddings obtained by (Phi)-Space, Seurat V3, and Seurat V4 achieved a better balance between removing batch effects and retaining the difference between disease conditions
(Phi)-Space characterizes complex interactions between cell types and disease conditions
Our phenotype space approach of multi-omics integration also provides a new way of quantifying the interaction between cell types and biological conditions (e.g., disease conditions, age groups). Conventional analyses typically first annotate the single cells, then calculate cell type proportions under each biological condition [27, 40, 41]. However, this approach is very sensitive to the way cell types are defined, which hinders the direct quantitative comparison of cell type compositions derived in different studies. With (Phi)-Space, we solve this problem by analyzing both the reference and query disease conditions in the same phenotype space, so that cell type compositions are directly comparable. The (Phi)-Space predicted cell type scores differentiated the enrichment or depletion of cell types according to disease conditions (Fig. 6A and B), in agreement with [27, 28] (discussed below). Thus, we showed that with (Phi)-Space we can compare cell type compositions across biological conditions and studies. Of note, we could use Seurat V3 and V4 scores to plot similar heatmaps (Additional file 1: Fig. S5). However, the plots were not interpretable due to the overly high proportion of zeros in the scores.
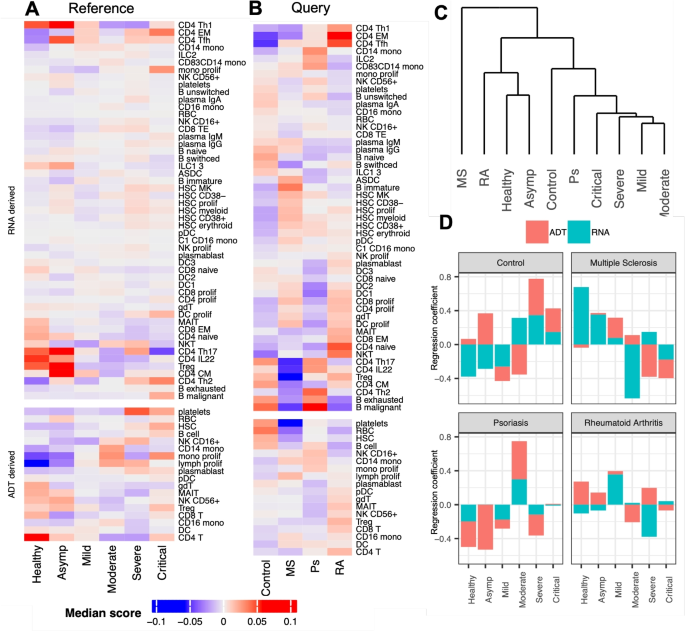
Phenotype space marker selection for CITE-seq data. A and B Median (Phi)-Space cell type scores under different disease conditions: A scores of reference cells, where columns are COVID-19 severity (Asymp: asymptomatic); B scores of query cells, where columns are types of pre-existing autoimmune diseases (Control: severe COVID-19 patients without pre-existing autoimmune diseases; MS: multiple sclerosis; Ps: psoriasis; RA: rheumatoid arthritis). C Hierarchical clustering of disease conditions in A according to their correlation with cell types. D PLS regression coefficients of COVID-19 severity for predicting autoimmune disease types, where red (or teal) bar corresponds to ADT (or RNA) derived scores. We observed a heterogeneity of COVID-19 patients with different types of pre-existing autoimmune diseases, in terms of cell type composition and disease severity
Based on the ADT-derived results in severe COVID-19 patients compared to healthy donors, we observed an increased presence of B cells, platelets, plasmablasts, hematopoietic stem cells (HSCs), proliferating monocytes, and proliferating lymphocytes (Fig. 6A). In addition, based on the RNA derived scores, we observed the enrichment of type 1 helper T cells (CD4 Th1), IL22 expressing CD4 T cells (CD4 IL22), and regulatory T cells (Treg) in asymptomatic patients. Both observations are consistent with findings in [27]. Moreover, consistent with [28], we observed in the query data (Fig. 6B) an overall lack of phenotypic signatures characterizing severity, such as HSCs, platelets, and plasmablasts, in COVID-19 patients with autoimmune diseases, compared to the severe COVID-19 patients in the control group. Furthermore, [28] identified an enrichment of type 2 helper T cells (Th2) in psoriasis (Ps) patients and the enrichment of CD4 memory T cells in rheumatoid arthritis (RA) patients, which were confirmed in Fig. 6B.
In addition to these known findings, our (Phi)-Space analysis provided a much more nuanced characterization of the heterogeneity of autoimmune disease types. For example, compared to psoriasis (Ps), both rheumatoid arthritis (RA) and multiple sclerosis (MS) patients tended to display stronger mature DC (DC1, DC2, and DC3) presence, a feature characterizing healthy donors (Fig. 6A; see also [27]). In addition, Ps patients were characterized by an enrichment of the exhausted and malignant B cells, which were both indicators for greater COVID-19 severity [27]. These additional findings illustrated the heterogeneity of the immune landscape of COVID-19 patients with different types of autoimmune diseases. This heterogeneity was further illustrated by a hierarchical clustering analysis of cell type composition between disease conditions in Fig. 6C. In light of the relatively small sample size involved in [28], more samples from COVID-19 patients with autoimmune diseases need to be collected for a thorough investigation of this heterogeneity.
(Phi)-Space highlights disease severity markers of autoimmune conditions
To directly characterize disease severity of COVID-19 patients with autoimmune disease, we conducted a phenotype space marker selection. We used the query cells’ (Phi)-Space embeddings to predict their autoimmune disease types (Fig. 6D). This allowed us to directly assess how cell type enrichment and COVID-19 severity discriminate autoimmune disease types (only COVID-19 severity was visualized). As expected, the phenotypic variation of the control group consisting of severe COVID-19 patients without any autoimmune disease were best predicted by severe and critical COVID-19 conditions. In contrast, MS and RA were better predicted by healthy, asymptomatic, and mild conditions. Finally, Ps was better predicted by the moderate condition. These findings were consistent with our findings shown on Fig. 6A–C. These figures illustrated from different angles the heterogeneity of the immune landscapes of COVID-19 patients with different pre-existing autoimmune diseases.
Summary
Through the CITE-seq case study, we demonstrated how a simple concatenation of phenotype space embeddings derived using different omics modalities leads to integrative analyses of complex interactions of cell phenotypes. As a generic modeling strategy, our multi-omics annotation can also be applied using soft classification methods other than PLS, such as Seurat V3 and V4. Compared to a direct integration of the omics features, our phenotype space approach achieved a better balance between removing batch effects and preserving difference between disease conditions. This enables us to conduct insightful phenotype space marker analyses, where we could directly compare cell type compositions and disease conditions from different studies. In particular, our approach provides a fully quantitative alternative to the largely qualitative approach used in [28].
Flexible cell type transfer within and across omics
So far, we have described the ability of (Phi)-Space to perform soft classification. Here we show that (Phi)-Space also provides high quality hard classification for both within- and across-omics cell type transfer. After within- or across-omics annotation of the query data, we discretized query cells’ phenotype space embeddings to obtain their predicted cell type labels (see Methods section). We designed two cross-validation (CV) procedures to benchmark the accuracy of (Phi)-Space against several state-of-art methods in both within- and across-omics label transfer (see summary of case studies in Overview of (Phi)-Space section). We considered the complex batch effects in the dataset when designing these CV procedures: they mimic the realistic scenario where the reference and query datasets are generated under different experimental conditions [6, 10]. The balanced classification errors were then calculated based on the ground truth cell type labels (Additional file 2: Section S2.2).
(Phi)-Space accurately transfers cell type labels between scRNA-seq datasets
For within-omics annotation, (Phi)-Space led to similar classification errors compared to the state-of-the-art Seurat V3 and scANVI, while SingleR did not perform well. Then using pseudo-bulk references, the performance of (Phi)-Space was similar to SingleR and scANVI, while Seurat underperformed (Fig. 7A). In particular, (Phi)-Space, SingleR, and scANVI all benefited from a pseudo-bulk approach as opposed to Seurat V3.
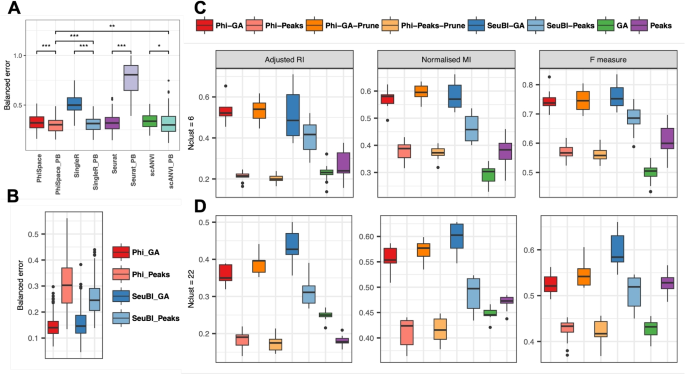
Benchmarking hard classification and phenotype space clustering performances. A and B Balanced classification errors for: A within-omics annotation, where the scRNA-seq query was annotated according to (Phi)-Space, SingleR, Seurat V3, and scANVI using scRNA-seq references or their pseudo-bulk versions, “PB”; B cross-omics annotation, where the scATAC-seq query was annotated according to (Phi)-Space (Phi) and Seurat bridge integration (SeuBI) using scRNA-seq reference and bimodal bridge. “Peaks” and “GA” indicate ATAC measurements represented as either peaks or gene activity (GA) scores. C and D Three metrics (adjusted Rand index, normalized mutual information, and F measure) for evaluating k-means clustering based on phenotype space embeddings generated by different methods, or on PCs of either GA scores or peaks. We also applied score pruning to (Phi)-Space scores (i.e., deleting negative scores), which result in their “-Prune” versions. The number of k-means clusters were set to C 6—the number of ground truth major cell types; or D 22—the number of fine cell types. (Phi)-Space performance was comparable to state-of-the-art methods in both within- and cross-omics annotation. In terms of clustering, (Phi)-Space was always among the top two best performing methods. Score pruning (e.g., Phi-GA-Prune) tended to improve the performance of (Phi)-Space
(Phi)-Space accurately transfers cell type labels from scRNA-seq to scATAC-seq datasets
In our second CV procedure, we used both the RNA and ATAC modalities of the 10x multiome dataset to evaluate cross-omics label transfer performances of (Phi)-Space and Seurat bridge integration (SeuBI) [16]. ATAC measurements can be represented as either peaks or gene activity (GA) scores. Therefore, we evaluated the classification performance of (Phi)-Space and SeuBI on each of these representations. On GA scores, both (Phi)-Space and SeuBI had similar classification error rates, with the (Phi)-Space errors being slightly less variable (Fig. 7B); on peaks, the classification error rates were noticeably higher than on the GA scores for both methods, suggesting that GA scores rather than peaks lead to better performance for cell type transfer.
Phenotype space clustering outperforms omics space clustering
A limitation of fully supervised cell type transfer is that cell types present in the query are not necessarily defined in the reference (e.g., cancer cells that are not present in healthy reference). To solve this problem, we can use unsupervised clustering to identify homogeneous clusters of cells, and then identify the cell type of each cell cluster based on its marker genes. However, fully unsupervised clustering does not make use of any reference even when available. Our phenotype space clustering strategy, i.e., clustering based on the phenotype space embedding of cells (described in Additional file 2: Section S1), combines the strengths of supervised and unsupervised cell type identification.
We adapted the above CV framework for evaluating clustering, where for each CV iteration we simply stacked the phenotype space embeddings of different batches of query cells (from either (Phi)-Space or SeuBI) and applied k-means clustering; we also applied k-means to pruned (Phi)-Space phenotype space embeddings (Additional file 2: Section S2.3). As a baseline, we applied k-means to peaks and GA scores directly to conduct fully unsupervised clustering (Additional file 2: Section S2.3). We evaluated all methods’ ability to recover either the 6 broad ground truth cell types or the 22 fine ground truth cell types or 22 respectively in each k-means analysis (by specifying (k = 6) or (k=22) in k-means), and used three commonly used metrics to evaluate the clustering results (described in Additional file 2: Section S2.4; higher metrics suggest better clustering).
(Phi)-Space and SeuBI were the best performing methods, according to all three metrics, when using the GA scores to recover broad cell types (Fig. 7C). However, the performances of SeuBI on either GA or peaks were much more variable compared to (Phi)-Space on GA scores, indicating that (Phi)-Space might be more robust against the quality of reference and bridge datasets. Moreover, pruning tended to improve the performance of (Phi)-Space clustering in most cases. SeuBI and the (Phi)-Space with pruning were the best performing method in recovering fine cell types when applied to GA scores (Fig. 7D). Overall, (Phi)-Space and SeuBI always performed better on the GA scores than the peaks, as observed in the classification analyses (Fig. 7B). This was likely due to the higher signal-to-noise ratio of GA scores compared to peaks. Indeed, since individual peaks corresponded to sub-gene regions, most peaks were not open in the scATAC-seq data. This made the peak-by-cell matrix much sparser compared to the gene-by-cell matrix. By aggregating peaks to genes, we effectively reduced the sparsity and enhanced the signal in scATAC-seq pertaining to cell type identification. It seemed that (Phi)-Space benefited more from this reduction of sparsity compared to SeuBI, as demonstrated by the much larger difference in the performance of Phi-GA and Phi-Peaks compared to the SeuBI counterparts.
Summary
Through the scATAC-seq case study we showed that (Phi)-Space led to good performances in both within- and cross-omics cell type transfer, comparable to several state-of-the-art methods. Of note, our application of SeuBI on GA scores is novel, as SeuBI was originally designed for utilizing peaks [16]. Our benchmarking results suggested that using GA scores (aggregated peaks) might be beneficial for cell type transfer tasks, due to the their higher signal-to-noise ratio compared to peaks.