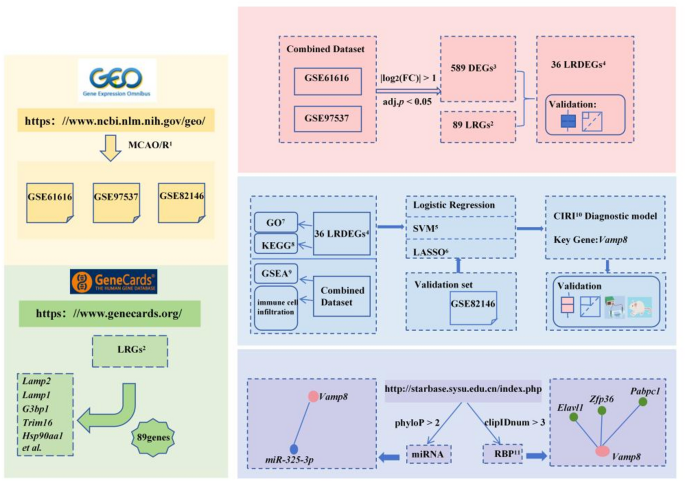
Data download
The rat cerebral ischemia-reperfusion injury(CIRI) data were downloaded from the GEO database (https://www.ncbi.nlm.nih.gov/geo/) using the R package GEOquery9. The GSE6161610, GSE97537 and GSE8214611 all contained samples from Rattus norvegicus, with the tissue origin being the brain. The chip platform for GSE61616 and GSE97537 was GPL1355, while the chip platform for GSE82146 was GPL17117. Specific details could be found in Table S1.In GSE61616, 5 samples suffered middle cerebral artery occlusion and reperfusion (MCAO/R), while 5 samples underwent a sham procedure as controls. GSE97537 included 7 MCAO/R samples and 5 sham samples. GSE82146 included 15 MCAO/R samples and 12 sham samples. All these samples were incorporated into the research.
We gathered Lysophagy-Related Genes (LRGs) from the GeneCards database12(https://www.genecards.org/) using “Lysophagy” as a search term and filtering for only “Protein Coding” genes, this process yielded a total of 99 LRGs. After converting these genes to their rat counterparts (Rattus norvegicus, TaxID: 10116) using the R package homologene, we obtained 89 LRGs. We utilized the R package sva13 to remove batch effects from training sets GSE61616 and GSE97537, which comprised 12 samples of MCAO/R and 10 sham samples. Using the R package limma14for standardization, principal component analysis (PCA)15was used to verify whether batch removal was effective. Additionally, we standardized the validation set GSE82146 using the R package limma.
Lysophagy-Related differentially expressed Genes(LRDEGs) analysis
Utilize the limma package to identify differentially expressed genes (DEGs) between the MCAO/R group and the sham group within the training dataset(|log2(FC)| > 1 and adj.P < 0.05), intersecting them with LRGs to obtain LRDEGs. The expression of LRDEGs were verified using the R package pROC.
Functional enrichment analysis
GO(https://www.geneontology.org/)16 and KEGG(https://www.genome.jp/kegg/)17 are effective research tools for studying gene functional enrichment and biological characteristics. We utilized the R package clusterProfiler18 to conduct GO and KEGG enrichment analyses on LRDEGs(adj.P < 0.05, q < 0.05). The p-value was adjusted by Benjamini-Hochberg (BH).
Construction of a diagnostic model for MCAO/R
To develop a MCAO/R diagnostic model for training set, logistic regression analysis was performed on LRDEGs. Subsequently, Support Vector Machine(SVM)19 model was constructed using the LRDEGs identified in the logistic regression analysis. Genes were selected based on the criteria of achieving the highest accuracy and the lowest error rate to further screen the LRDEGs associated with lysosomal autophagy. Thereafter, Least Absolute Shrinkage and Selection Operator (LASSO) regression analysis was conducted on the screened LRDEGs using the glmnet R package20, with parameters set.seed(500) and family=”binomial”. LASSO regression extends linear regression by incorporating a penalty term (lambda × absolute value of the slope), which mitigates overfitting and enhances the generalization capability of the model. The resulting LASSO regression analysis yielded the MCAO/R diagnostic model, wherein the included LRDEGs were identified as key genes. The formula for calculating the LASSO risk score is presented below:
$$riskScore~ = ~mathop sum limits_{i} Coefficient~left( {gene_{i} } right)*mRNA~Expression~left( {gene_{i} } right)$$
Validation of the MCAO/R diagnostic model
In accordance with the findings of logistic regression analysis, the R package rms was employed to construct a nomogram21 for depicting the interconnections among key genes.Based on the LASSO regression analysis, the accuracy and discriminatory power of the MCAO/R diagnostic model were appraised via Calibration analysis. The R package ggDCA was utilized to perform decision curve analysis (DCA) on key genes22.Subsequently, the R package pROC was utilized to plot the ROC and compute the AUC, thereby evaluating the diagnostic performance of the LASSO risk score for MCAO/R. Furthermore, the MCAO/R group was stratified into high risk group and low risk group according to the median value of the LASSO risk score in the MCAO/R diagnostic model.The expression levels of key genes in the validation set GSE82146 were incorporated into the risk coefficients obtained from the LASSO regression analysis in the training set to calculate the risk score of MCAO/R in GSE82146.Ultimately, the R package pROC was applied to plot the ROC of key genes and calculate the AUC, aiming to assess the diagnostic utility of the expression levels of key genes in relation to the occurrence of MCAO/R. The closer the AUC approaches 1, the more optimal the diagnostic performance.
Gene set enrichment analysis (GSEA)
The genes in the MCAO/R group and sham group of the training set were sorted according to the log2(FC), the R package clusterProfiler was used to conduct GSEA23.Then, the genes of the high-risk and low-risk groups in the MCAO/R were also sorted according to the log2(FC), and GSEA was conducted again.The GSEA utilized the following parameters: a seed of 2022, 1000 permutations, gene set size from 10 to 500. The gene set c2.cp.all.v2022.1.Hs.symbols.gmt [All Canonical Pathways] (3050) was sourced from the Molecular Signatures Database (MSigDB)24 for GSEA analysis. Filtering criteria for gene sets in GSEA involved an adj.P < 0.05 and q < 0.05, employing p-value adjustment through the BH approach.
Immune cell infiltration analysis
Initially, R package homologene was used to convert training set IDs from rat (Rattus norvegicus, TaxID: 10116) to human (Homo sapiens, TaxID: 9606). The CIBERSORT25 algorithm was then applied to obtain the pertinent characteristics of immune cells were acquired .Subsequently, the expression variances between the experimental group and the control group were analyzed using R package ggplot22. The Spearman algorithm was employed to calculate the correlations among immune cells, as well as between immune cells and key genes.
Construction of key gene regulatory networks
To explore the connection between biomarkers associated with diagnostic models and miRNAs, relevant microRNAs (miRNAs) were obtained from the StarBase v3.0 database26 (https://rnasysu.com/encori/) based on the condition of phyloP > 2. Subsequently, the Cytoscape software was employed for the visualization of regulatory networks involving mRNA and miRNA. RNA-Binding Proteins (RBPs)27 are pivotal in gene regulation processes, playing critical roles in regulating various life activities such as RNA synthesis, selective splicing, modification, transport, and translation. Utilizing the StarBase v3.0 database, we predicted RBPs targeting key genes associated with diagnostic models under the condition of clipIDnum > 3 and visualized mRNA-RBP regulatory networks using Cytoscape software.
Experimental animals
Male Sprague-Dawley rats, aged 6–8 weeks and weighing approximately 250–300 g, were purchased from Weitong-Lihua Experimental Animal Co. Ltd(Beijing, China). The rats were raised at the Institute of Translational Medicine, the First Hospital of Jilin University, Changchun City, Jilin Province, China. Animals were maintained at a temperature of 22 ± 2 ◦C, humidity of 65 ± 5%, and housed under a 12-h light-dark cycle with ad libitum access to food and water.
Animal models
According to the experimental requirements, the rats were randomly divided into 5 groups, with 6 rats in each group: Sham group, MCAO/ R 24 h, 48 h, 72 h, 7 days group. Rats were subjected to transient MCAO as previously described28. After blocking the blood flow for 1 h, reperfusion was restored. Autophagy exhibits dynamic variations throughout the progression of CIRI, therefore brain tissue samples were obtained at 24 h, 48 h, 72 h and 1 week after reperfusion, respectively. Animals in the sham group underwent the same anesthesia, surgical exposure and vascular isolation steps as those in the model group, but without substantive vascular occlusion.
Brain tissue samples collection
Brain tissue samples were collected at 24 h, 48 h, 72 h, and 7 days after MCAO/R. Rats were euthanized via intraperitoneal injection of 150 mg/kg pentobarbital. Following injection, physiological responses were monitored to ensure the animals were in a euthanized state. The rats were then placed on a surgical table, and the skin was incised along the midline of the thorax with sterile surgical scissors to expose the heart and major blood vessels. A perfusion catheter was inserted into the left ventricle through the cardiac apex, and pre-cooled PBS (4 °C) was injected to ensure catheter patency, maintaining perfusion for approximately 5 to 10 min. After perfusion, the brain was swiftly removed and immediately placed in a -80 °C freezer to preserve RNA and protein integrity.
Ethics statement
Compliance with guidelines
All methods involving live vertebrates were carried out in accordance with relevant guidelines and regulations. The study protocols were approved by the Experimental Animal Research Ethics Committee of Jilin University (No. 20230409).
ARRIVE guidelines
All methods and reporting adhere to the ARRIVE guidelines (https://arriveguidelines.org) to ensure the transparency and reproducibility of the research.
qPCR and RT-qPCR
Total RNA was extracted from the sham and MCAO/R tissue samples using RNeasy Mini kit (Qiagen), and the concentration and purity thereof were determined. cDNA was generated with the First-Strand cDNA Synthesis Kit (Takara, Dalian, China). qPCR was conducted using Universal Blue SYBR Green qPCR Master Mix (Servicebio, Wuhan, China). β-actin was used as an internal control.
Regarding miRNA, miRNAs were isolated through the miRcute miRNA Isolation Kit (Tiangen, Beijing, China) and reverse transcribed with the miRcute Plus miRNA First-Strand cDNA Kit (Tiangen, Beijing, China). RT-qPCR was performed on CFX Connect Real-Time System (Bio-Rad). U6 snRNA was employed as an internal reference.
The relative expression levels of the target genes were calculated by the (:{text{2}}^{text{−ΔΔ}text{Ct}}) method. The primer sequences are as follows: Vamp8, 5’-CTGCCTTGGGTGGAAACAGA-3’ (forward) and 5’-TTGTTTCGGAGGTGGTCCAG-3’ (reverse); β-actin: 5’-GTGACGTTGACATCCGTAAAGA-3‘(forward) and 5’-GTAACAGTCCGCCTAGAAGCAC-3’ (reverse). miR-325-3p,5’-CGGTTTATTGAGCACCTCCTATCAA-3‘(forward) and 5’-TTACTCCTTGGAGGCCATGTA-3‘(reverse); U6:5’-CTCGCTTCGGCAGCACA-3‘(forward) and 5’-AACGCTTCACGAATTTGCGT-3’ (reverse).
Western blotting
Total protein concentration was measured using a bicinchoninic acid (BCA) protein assay kit (Epizyme, China, 23225). Each lane was loaded with an equal amount of protein (20 µg) to ensure quantitative accuracy. Proteins were separated by 4–20% sodium dodecyl sulfate polyacrylamide gel electrophoresis (SDS-PAGE) and subsequently transferred onto polyvinylidene fluoride (PVDF) membranes. The membranes were blocked with 5% nonfat milk for 90 min at room temperature, followed by incubation with rabbit-derived primary antibodies against Vamp8(1:1000,85400-4-RR, proteintech)and β-actin (1:1000, 81115-1-RR, proteintech) overnight at 4 °C. Afterward, the membranes were washed three times with TBST (Tris-buffered saline, pH 7.4, containing 0.05% Tween 20; Sigma, P1379) and further incubated with horseradish peroxidase-conjugated secondary antibodies, Goat Anti-Rabbit IgG (H&L) (1:10,000, CSA2115, Cohesion Biosciences), for 1 h at room temperature. Finally, immunoblot signals were detected using an enhanced chemiluminescence system.
Statistical analysis
All data processing and analysis were performed using R software (Version 4.3.1). Unless otherwise stated, for comparisons of two continuous variables, the statistical significance of normally distributed variables was assessed using the independent two-sample t-test. Differences between non-normally distributed variables were evaluated using the Mann-Whitney U test (also referred to as the Wilcoxon Rank Sum Test). For comparisons involving three or more groups, the Kruskal-Wallis test was employed. Correlation coefficients between different molecules were calculated using Spearman’s rank correlation analysis. Unless otherwise specified, all statistical p-values were two-tailed, and P < 0.05 was considered statistically significant.