The chloroplast genomes of three different flower colors of P. kingianum
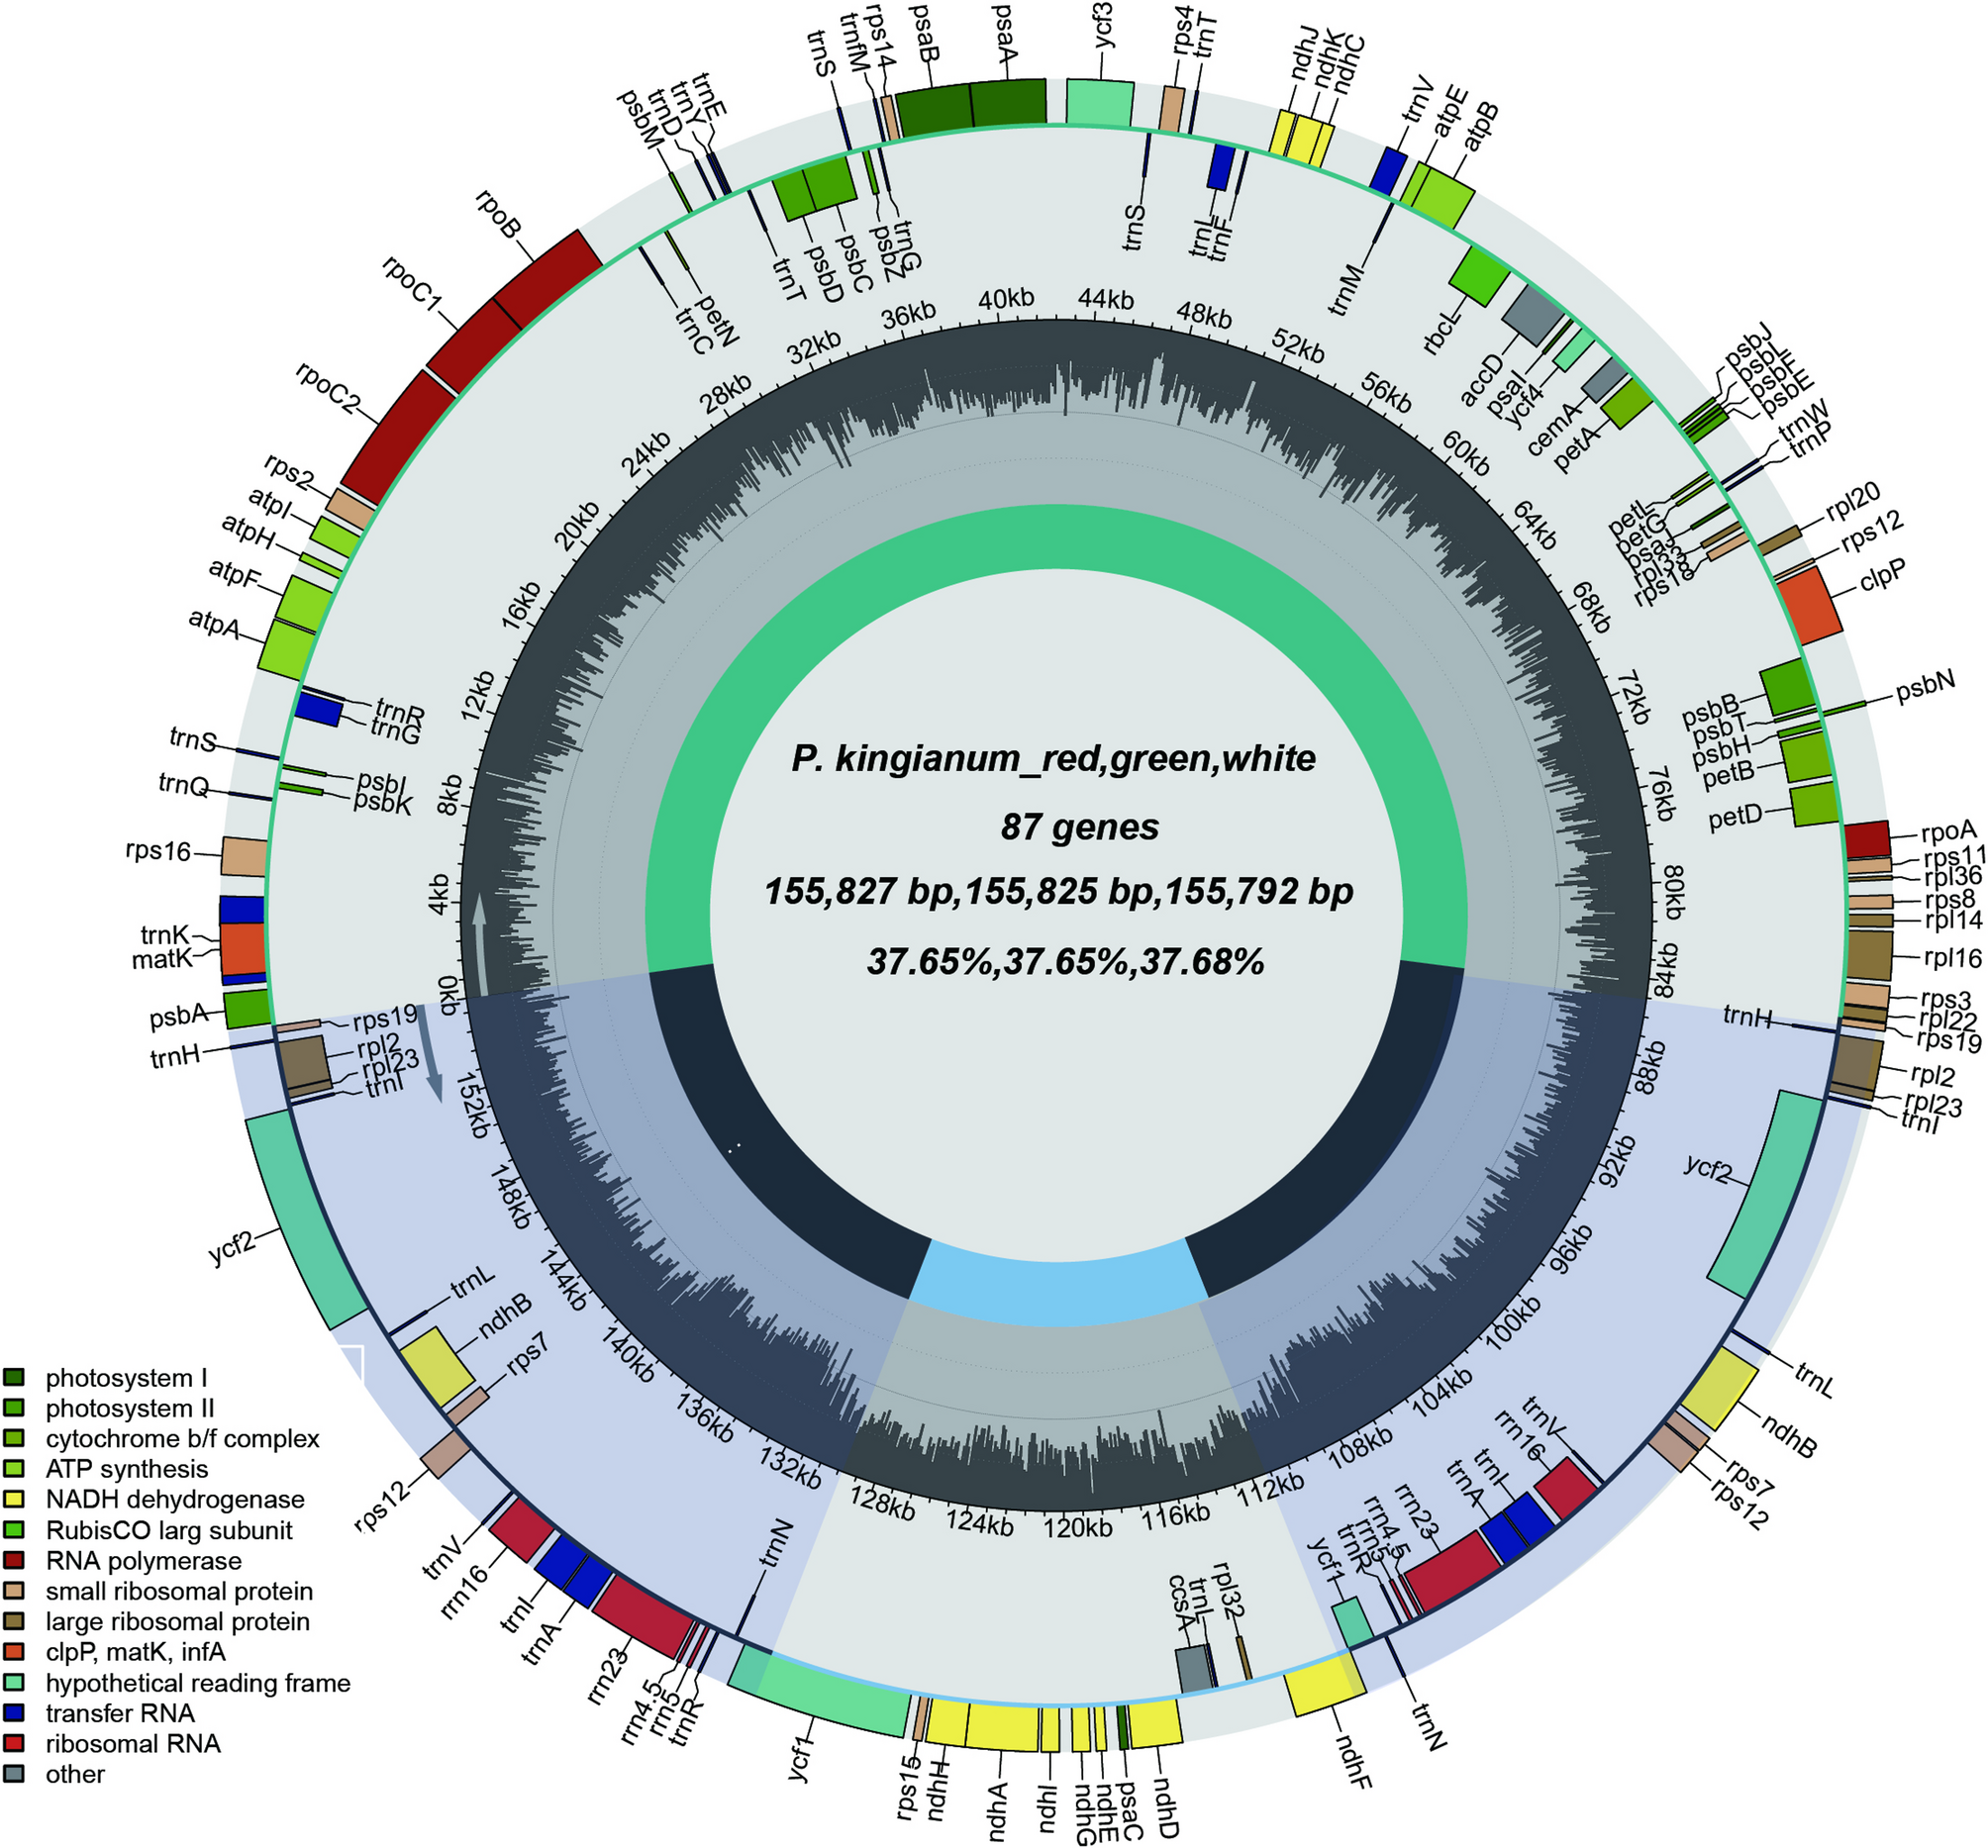
The assembled chloroplast genome of P. kingianum displayed the typical quadripartite structure (Fig. 1). The genome lengths for red-, green-, and white-flowered P. kingianum were 155,827 bp, 155,825 bp, and 155,792 bp, respectively. The SSC region was approximately 18,530 bp long (Table S3), and the LSC region was approximately 84,640 bp long. rRNA and tRNA gene lengths were conserved, with only a 1-bp deletion in one white-flowered tRNA gene compared to the red and green phenotypes. Overall GC content was nearly identical (37.65% for red/green vs. 37.68% for white), with less than 0.1% variation among phenotypes. Region-specific GC content was highly conserved across all genomic compartments (Table S4).
Chloroplast genome maps of P. kingianum with different flower colors. Genes transcribed clockwise are shown on the outer circle, while counterclockwise-transcribed genes are displayed on the inner circle. Genes are color-coded according to their functional categories. The inner ring indicates the positions of the large single copy (LSC), small single copy (SSC), and inverted repeat (IR) regions
Statistical analysis of the chloroplast genome composition of three P. kingianum flower color phenotypes revealed no significant differences in color. All the samples contained 132 genes, including 86 protein-coding genes, 8 rRNA genes, and 38 tRNA genes. These genes were categorized into four groups: photosynthesis-related genes, self-replication-related genes, other genes, and genes with unknown functions (Table S5). Among them were four pseudogenes: ycf1–4. Notably, ycf1 and ycf2 underwent duplication events, and ycf3 contained two introns. Additionally, 20 genes exhibited duplications, including all rRNA genes, 8 tRNA genes, and 8 protein-coding genes. A total of 21 genes contained introns, of which 5 were tRNA genes and 16 were protein-coding genes. Both rps12 and clpP had two introns (Table S6).
To reveal the structural variations in the chloroplast genomes of three P. kingianum flower color phenotypes, we analyzed the chloroplast genome structures of eight additional species and compared them with those of P. kingianum (Fig. 2). The results revealed that the total length of the chloroplast genomes ranged from 155,549 bp (P. sibiricum) to 155,950 bp (P. cirrhifolium), which was slightly different from that of P. kingianum. Similar minor variations were observed across different regions. However, the proportion of noncoding regions in H. ogisui was significantly greater than that in Polygonatum. Compared with those of P. kingianum, the GC contents of all regions in these species exhibited slight variations, with the IR regions and the regions encoding tRNAs and rRNAs having higher GC contents than other regions. With respect to gene composition, the chloroplast genome structure was consistent across all species, with no differences in gene content, although slight variations in gene length were observed (Table S7).
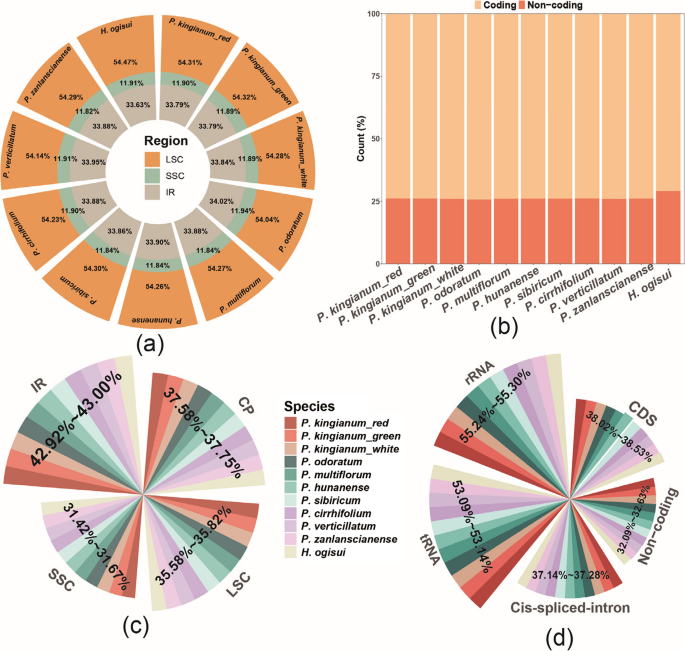
Proportion of different regions in the chloroplast genome relative to the total length and GC content. A Proportions of quadripartite regions. B Coding and noncoding regions. C GC content of quadripartite regions. D GC content of other regions
Phylogenetic analysis of the genus Polygonatum and the origin of floral color traits in P. kingianum
Using maximum likelihood (ML) and Bayesian inference (BI) methods, we constructed phylogenetic trees based on the common protein-coding sequences from chloroplast genomes (Fig. 3 and Supplementary Fig. 3). L. chinensis was designated as the outgroup. The results showed highly consistent topologies, with all nodes exhibiting high bootstrap values (BS) and posterior probabilities (PP), indicating strong statistical support. With L. chinensis forming a distinct clade as the outgroup, the Asparagaceae family species were clearly resolved into monophyletic groups. Heteropolygonatum and Polygonatum presented a sister relationship. Notably, within the Polygonatum clade, all species were divided into three groups by P. sibiricum: sect. Polygonatum, sect. sibiricum, and sect. Verticillata. P. kingianum belongs to the sect. Verticillata group, where the three flower color phenotypes of P. kingianum formed a distinct subclade with high bootstrap and posterior support, distinguishing them from other species within the group.
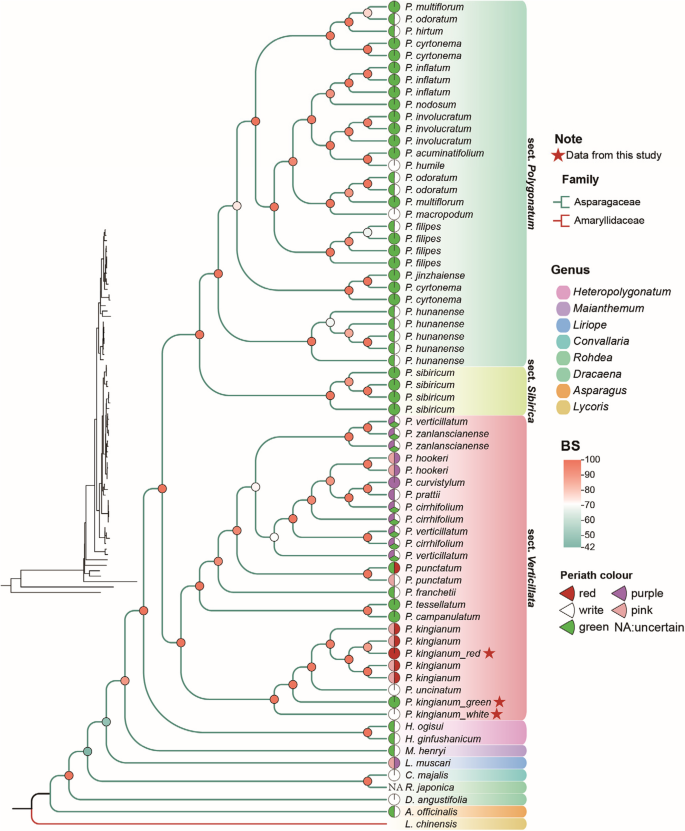
To reveal the phylogenetic relationships of P. kingianum, a phylogenetic tree was constructed using maximum likelihood (ML) based on protein-coding sequences (PCGs). Branches in different colors represent different families, whereas the shading intensity of pie charts at branch nodes indicates bootstrap support values. The pie charts in front of the species illustrate the floral color composition, and different shaded areas indicate distinct genera
Integrated morphological and phylogenetic analyses revealed that sect. Polygonatum primarily maintains white and green floral color. In contrast, sect. Verticillata underwent floral color diversification from an ancestral white state, subsequently evolving polymorphic coloration. Within the three P. kingianum phenotypes examined, the white-flowered phenotype represents the ancestral state (consistent with sect. Verticillata), while red and green phenotypes comprise sister lineages.
Composition and comparison of repetitive sequences in P. kingianum with different floral colors
In the composition of simple sequence repeats (SSRs), 72 were identified in the red-flowered P. kingianum, 78 in the green-flowered phenotypes, and 79 in the white-flowered phenotypes, demonstrating comparable abundance. These SSRs were predominantly mononucleotide repeats, and A/T repeats were the most abundant (red: 39/54.17%, green: 44/55.70%, white: 43/55.13%). Dinucleotide repeats were the second most common, while there were no significant differences in the types or numbers of tri-, tetra-, penta-, and hexanucleotide repeats. The SSRs were primarily distributed in the LSC region, while the IR region contained the fewest. Three P. kingianum flower color phenotypes contained approximately 8 SSRs in protein-coding genes. Among the other eight species analyzed, P. multiflorum had the fewest SSRs (66), whereas H. ogisui from the Heteropolygonatum genus had the most SSRs (81). Differences in SSR counts among Polygonatum species were attributed primarily to mononucleotide repeats, and some species also contained G/C repeats in addition to A/T repeats. Nevertheless, the positional distribution of these repeats within the chloroplast genomes showed no significant variation (Fig. 4).
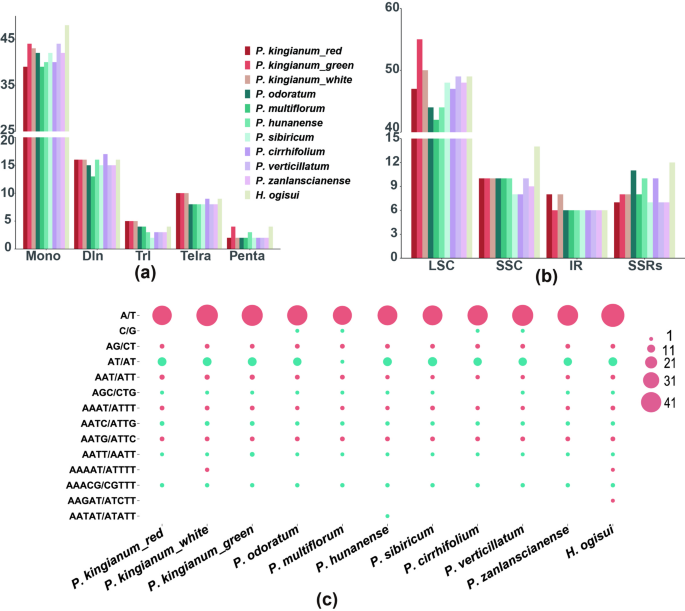
SSRs in the chloroplast genomes of 11 species. A Distribution of six types of SSRs; B Locations of SSRs in the chloroplast genome; C Counts of various SSR types
In the chloroplast genomes of red- and green-flowered P. kingianum, 36 and 37 long interspersed repeat sequences were detected, respectively, whereas the white-flowered phenotype presented a greater number of 41. These repeats were primarily composed of palindromic and forward types, with similar numbers and lengths, mainly between 30 and 50 bp. All phenotypes also contained a palindromic repeat longer than 10,000 bp. The four long interspersed repeats in other species presented comparable trends. However, some species in the sect. Verticillata group presented significantly greater repeat counts (ranging from 60 to 65) than did P. kingianum and other species, whereas H. ogisui contained the fewest repeats, at just 29. Although there were compositional differences in the four long interspersed repeats among the species, none of them contained complementary or reverse repeats. Tandem repeat analysis revealed 34, 30, and 36 consensus sequences in red-, green-, and white-flowered P. kingianum, respectively. These sequences were similar in position and size, ranging primarily from 10 to 25 bp. Compared with those in P. kingianum, the number of tandem repeats detected in other species showed little variation (Fig. 5).
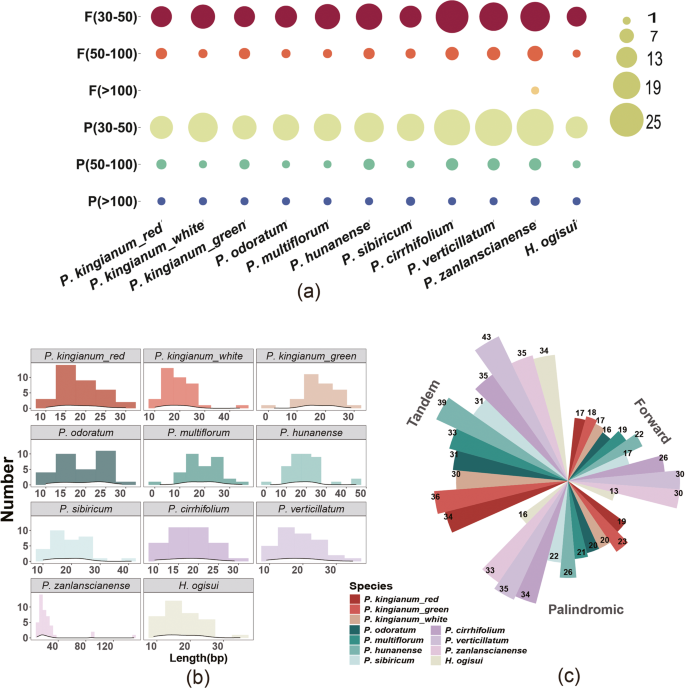
Long repeats in the chloroplast genomes of 11 species. A Counts of long interspersed repeated repeats of different lengths; B Density plot of conserved sequence lengths; C Numbers of different long repeat sequences
Comparative analysis of codon usage bias in P. kingianum with different floral colors
The chloroplast genomes of red- and green-flowered P. kingianum encode 26,073 amino acids, whereas the white-flowered phenotype encodes 26,113. Among the three phenotypes, leucine (Leu) was the most common amino acid, with 2673, 2672, and 2677 codons, respectively. In contrast, cysteine (Cys) was the least common, with 304, 304, and 303 codons, respectively. Among the 61 codons encoding 20 amino acids, 30 had RSCU values greater than 1, excluding methionine (Met) and tryptophan (Trp), which each had RSCU = 1. The codon AGA, encoding arginine (Arg), had the highest RSCU value, whereas CGC, also encoding arginine, was the least preferred, with an RSCU value of 0.3. Further analysis revealed that codons ending with A/U accounted for 70.08%, 70.05%, and 69.98% of the total codons in the red, green, and white phenotypes, respectively. Comparative analysis with eight other species revealed that H. ogisui encoded significantly fewer amino acids (24,789) than other Polygonatum species did. While minor differences in codon usage preferences were observed, other results were consistent with those of Polygonatum, where codons ending in A/U also accounted for approximately 70% of the total (Fig. 6).
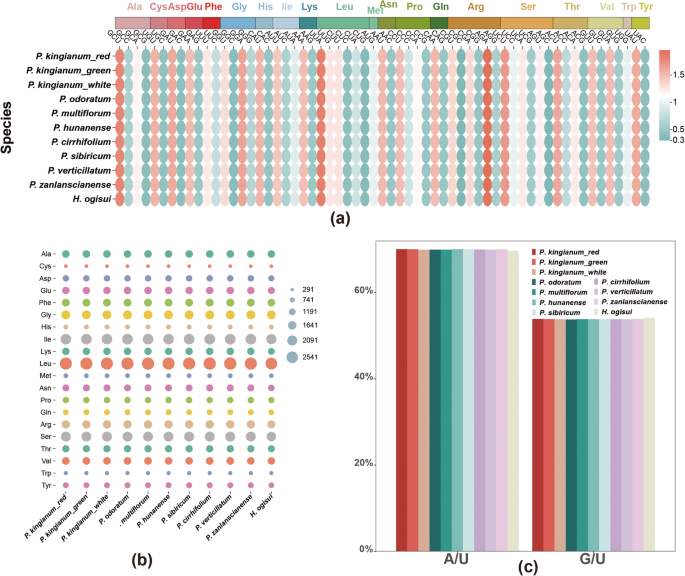
Codon usage bias in the chloroplast genomes of 11 species. A RSCU values of codons; B Number of encoded amino acids for various types; C Ratio of A/U to G/U at the third codon position
Boundary analysis, similarity comparison, and high-variation region identification of the chloroplast genome
The chloroplast genome boundary regions are defined as SC-IRb (JLB), IRb-SSC (JSB), SSC-IRa (JSA), and IRa-LSC (JLA). Analysis of IR boundary contraction and expansion revealed changes in the rpl22, rps19, ycf1, ndhF, trnN, and psbA genes within the boundary regions. Notably, ycf1 and ndhF crossed the IR/SSC boundary. Among Polygonatum species, these gene changes were generally consistent. In H. ogisui, however, rps15 was also detected in the JSA region, whereas ycf1 was significantly reduced and presented a narrower span across the SSC region (Fig. 7).
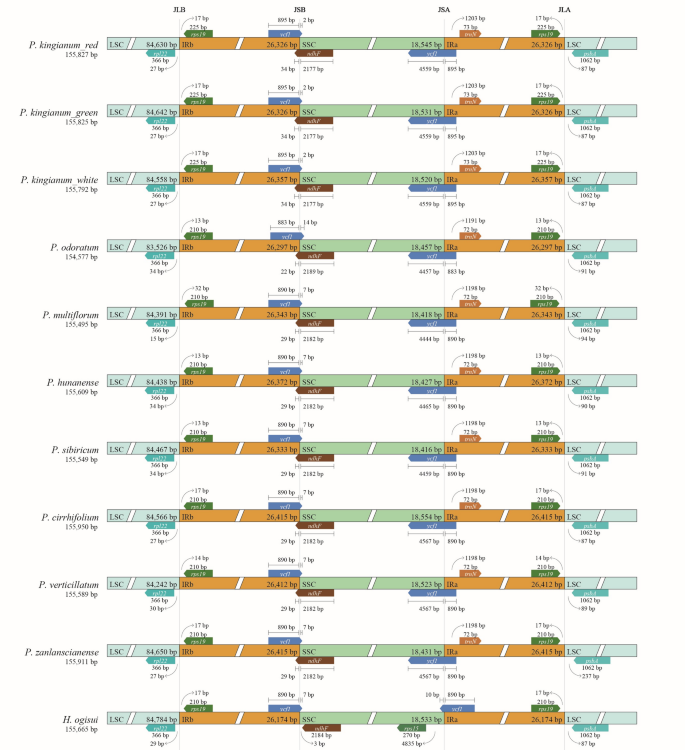
Distance between adjacent genes and junctions of the small single-copy (SSC), large single-copy (LSC), and two inverted repeat (IR) regions of P. kingianum with related species cp genomes. Boxes above and below the main line indicate the adjacent border genes. The figure is not to scale with respect to sequence length, and it only shows relative changes at or near the IR/SC borders
To investigate the chloroplast genome similarities and variations across different floral phenotypes of P. kingianum, we analyzed 11 species using mVISTA, with red-flowered P. kingianum as a reference. Visualization of the full chloroplast genome revealed high similarity among the three floral phenotypes of P. kingianum. Compared with those of other species, variations were primarily concentrated in noncoding regions, with IR regions showing greater conservation than the LSC and SSC regions. Notable differences were observed in the rps16-psbK, atpF-atpH, and trnS-UGA-rps14 regions among the P. kingianum flower color phenotypes and other species. Additionally, the psbA gene in P. odoratum exhibited greater variation compared to other species, whereas the ycf1 gene in sect. Polygonatum presented substantial differences compared with those in other species. The psbN gene presented greater variation in sect. Verticillata than in P. kingianum and other taxa (Fig. 8).
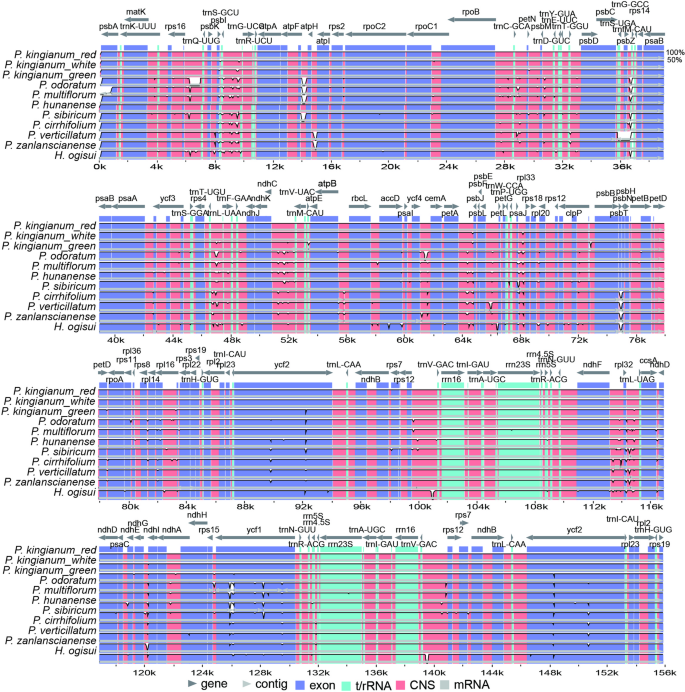
mVISTA percent identity plot comparing the three P. kingianum chloroplast genomes with red P. kingianum as a reference. The top line shows genes in order (transcriptional direction indicated by arrows). The y-axis represents the percent identity within 50–100%. The x-axis represents the coordinates in the chloroplast genome. Genome regions are color-coded as protein-coding (exon), tRNA or rRNA, and conserved noncoding sequences (intergenic regions). The white block represents regions with sequence variation between the two species
Single-nucleotide polymorphism analysis of the chloroplast genomes of 11 species revealed 109 genes (Fig. 9). Among these genes, 41 exhibited nucleotide polymorphism (Pi) values of 0, and these genes primarily consisted of tRNA genes. Using a threshold of pi = 0.005, four highly mutated genes were identified: psbM (pi = 0.00658), rpl16 (pi = 0.01283), ccsA (pi = 0.00696), and rps15 (pi = 0.00539). Additionally, 145 intergenic regions (IGSs) were identified, with 25 regions showing pi = 0. Among these, three high-mutation regions were identified with a pi ≥ 0.03: psbI-trnS-GCU, rpl22-rps19, and the highest mutation rate was observed in the rps19-psbA region.
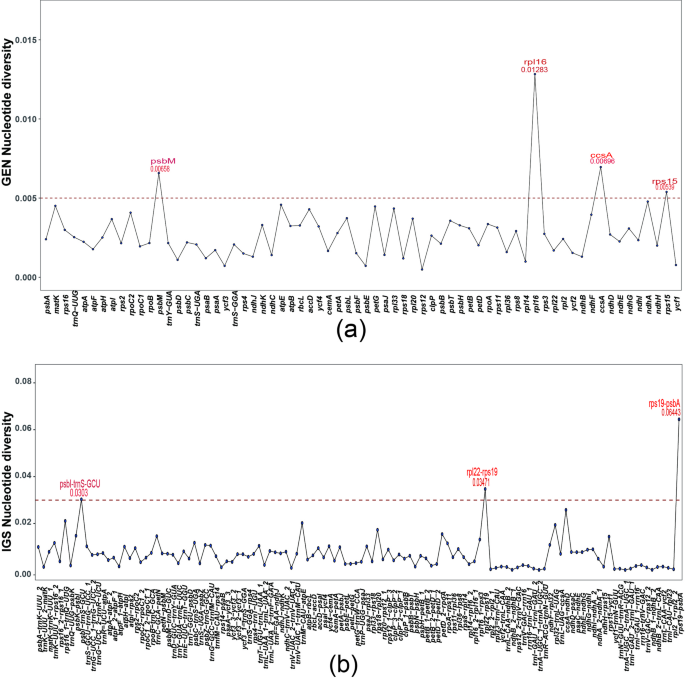
Distribution of nucleotide polymorphisms in the chloroplast genomes of 11 species. A Nucleotide polymorphisms of genes; B Nucleotide polymorphisms of intergenic spacer (IGS) regions