
7 October 2025
- Current account surplus at €326 billion (2.1% of euro area GDP) in four quarters to second quarter of 2025, after a €396 billion surplus (2.7% of GDP) a year earlier
- Geographical counterparts: largest bilateral current account surplus vis-à-vis United Kingdom (€198 billion) and largest deficit vis-à-vis China (€134 billion)
- International investment position showed net assets of €1.43 trillion (9.3% of euro area GDP) at end of second quarter of 2025
Current account
The current account of the euro area recorded a surplus of €326 billion (2.1% of euro area GDP) in the four quarters to the second quarter of 2025, following a €396 billion surplus (2.7% of GDP) a year earlier (Table 1). This decrease was mainly driven by a shift in the balance for primary income from a surplus (€42 billion) to a deficit (€6 billion) and, to a lesser extent, by a wider deficit for secondary income (from €164 billion to €180 billion) as well as a lower surplus for services (from €166 billion to €154 billion). These developments were partly offset by a larger surplus for goods (from €352 billion to €359 billion).
Estimates on goods trade broken down by product group show that in the four quarters to the second quarter of 2025, the increase in the goods surplus was mainly due to a larger surplus for chemical products (from €256 billion to €311 billion) and a smaller deficit for energy products (from €274 billion to €250 billion). These developments were partly offset by a shrinking surplus for machinery and manufactured products (from €313 billion to €257 billion).
The smaller surplus for services in the four quarters to the second quarter of 2025 was mainly due to larger deficits for other business services (from €42 billion to €72 billion) and for charges for the use of intellectual property (from €104 billion to €127 billion). These developments were partly offset by a widening surplus for telecommunication, computer and information services (from €194 billion to €226 billion).
The shift from surplus to deficit in primary income in the four quarters to the second quarter of 2025 was mainly due to smaller surplus in direct investment (from €94 billion to €39 billion) and a larger deficit in portfolio equity (from €184 billion to €197 billion). These developments were partly offset by a larger surplus in portfolio debt (from €69 billion to €82 billion) and other investment income (from €5 billion to €10 billion).
Table 1
Current account of the euro area
(EUR billions, unless otherwise indicated; transactions during the period; non-working day and non-seasonally adjusted)
Source: ECB.
Notes: “Equity” comprises equity and investment fund shares. Goods by product group is an estimated breakdown using a method based on statistics on international trade in goods. Discrepancies between totals and their components may arise from rounding.
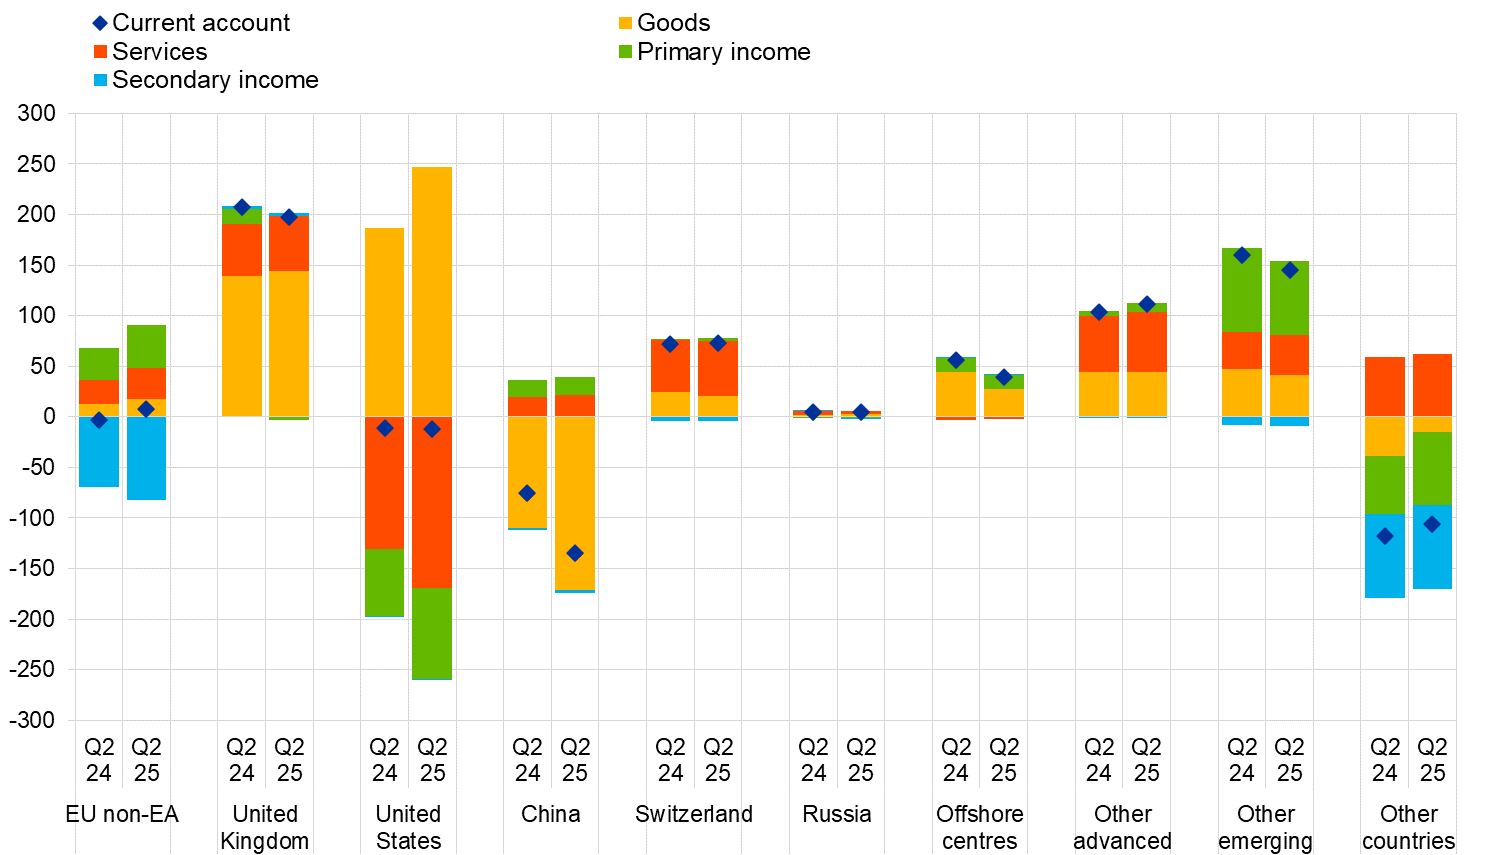
Data on the geographical counterparts of the euro area current account (Chart 1) show that in the four quarters to the second quarter of 2025, the euro area recorded its largest bilateral surpluses vis-à-vis the United Kingdom (€198 billion, down from €208 billion a year earlier) and Switzerland (€73 billion, slightly up from €72 billion). The euro area also recorded surpluses vis-à-vis other emerging economies (€145 billion, down from €160 billion a year earlier), other advanced economies (€111 billion, up from €104 billion) and offshore centres (€39 billion, down from €56 billion). The largest bilateral deficit was recorded vis-à-vis China (€134 billion, up from €76 billion a year earlier) and a deficit was also recorded vis-à-vis the residual group of other countries (€106 billion, down from €118 billion).
The most significant changes in the current account components by geographical counterpart over the four quarters ending in the second quarter of 2025 relative to the previous year were as follows: in goods, the surplus vis-à-vis the United States increased from €186 billion to €247 billion, while the deficit vis-à-vis China widened from €110 billion to €172 billion. In services, the deficit vis-à-vis the United States increased from €131 billion to €169 billion, while the surplus vis-à-vis EU Member States and EU institutions outside the euro area increased from €23 billion to €31 billion. In primary income, the deficit vis-à-vis the United States increased from €66 billion to €90 billion, while in secondary income the deficit vis-à-vis EU Member States and EU institutions outside the euro area increased from €70 billion to €82 billion.
Chart 1
Geographical breakdown of the euro area current account balance
(four-quarter moving sums in EUR billions; non-seasonally adjusted)
Source: ECB.
Note: “EU non-EA” comprises the non-euro area EU Member States and those EU institutions and bodies that are considered for statistical purposes as being outside the euro area, such as the European Commission and the European Investment Bank. “Other advanced” includes Australia, Canada, Japan, Norway and South Korea. “Other emerging” includes Argentina, Brazil, India, Indonesia, Mexico, Saudi Arabia, South Africa and Türkiye. “Other countries” includes all countries and country groups not shown in the chart, as well as unallocated transactions.
International investment position
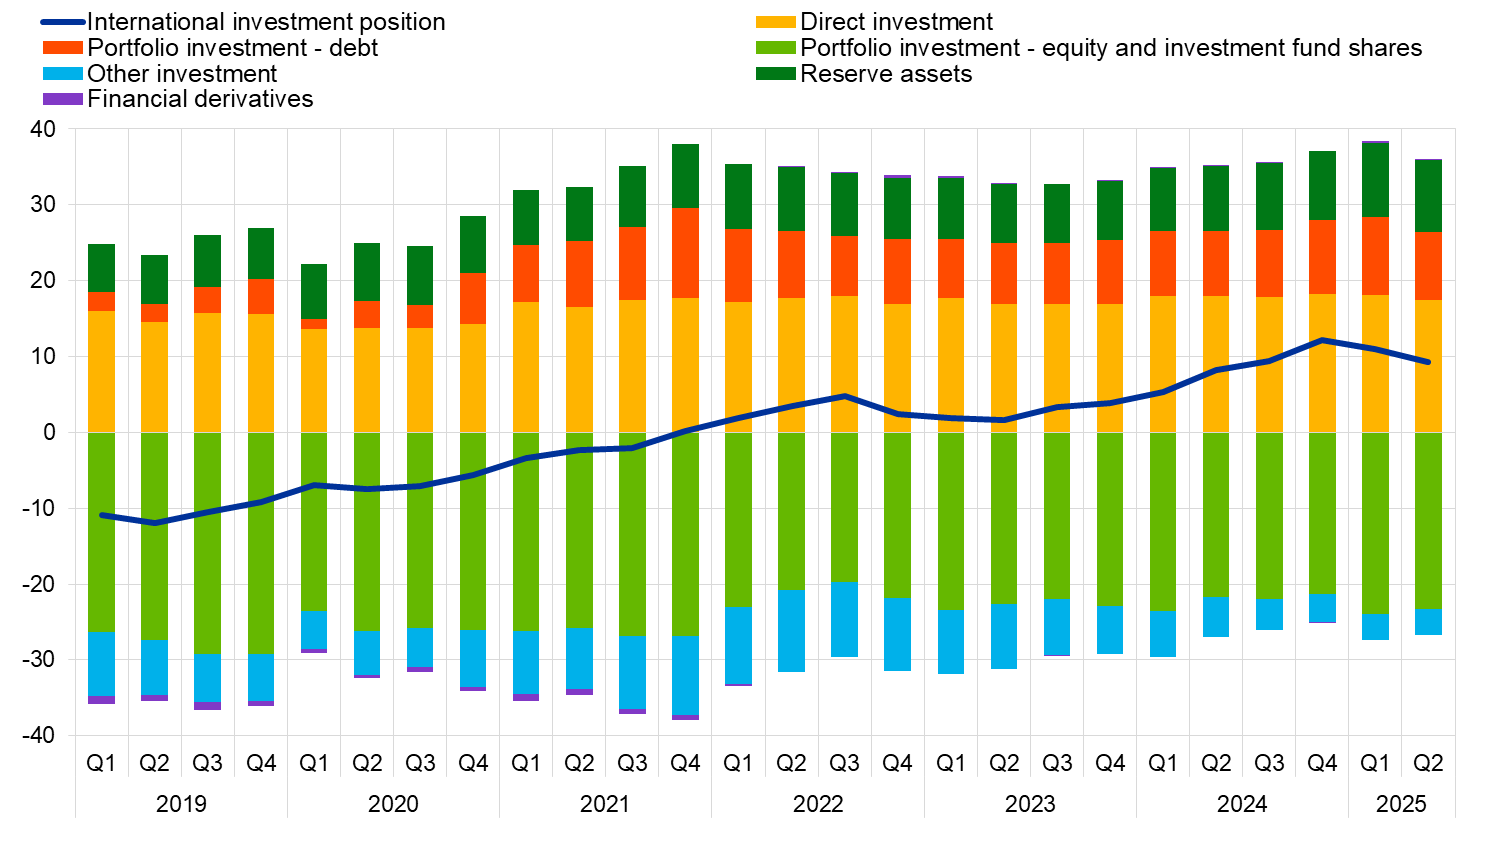
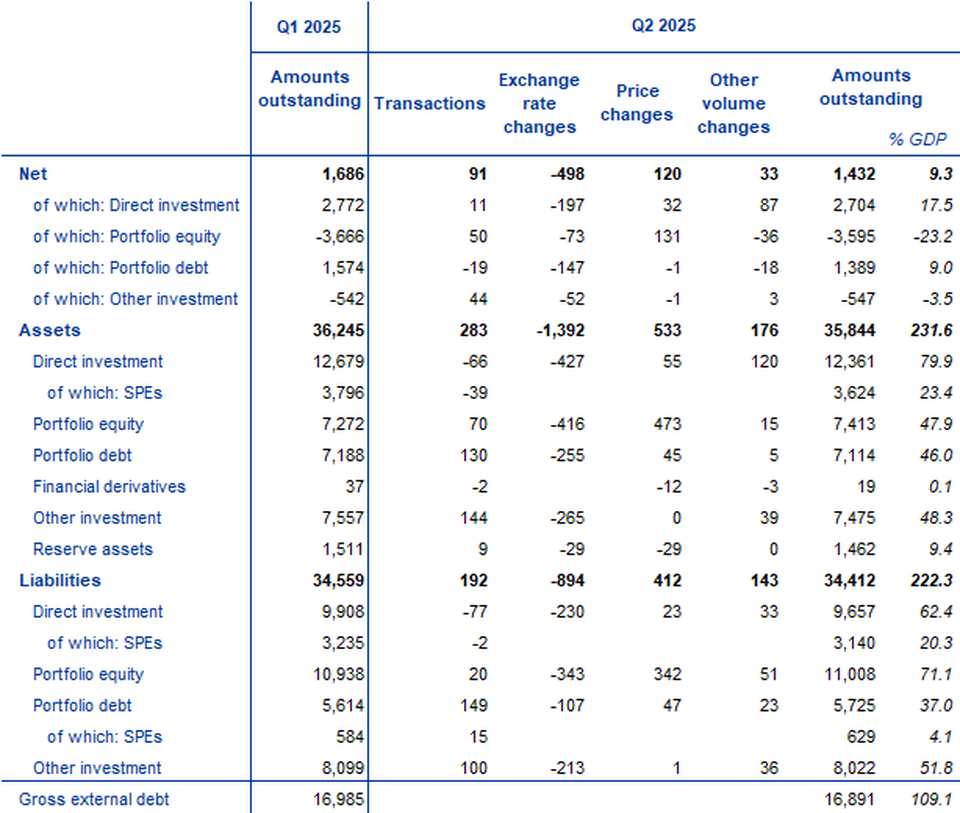
At the end of the second quarter of 2025, the international investment position of the euro area recorded net assets of €1.43 trillion vis-à-vis the rest of the world (9.3% of euro area GDP), down from €1.69 trillion in the previous quarter (Chart 2 and Table 2).
Chart 2
Net international investment position of the euro area
(net amounts outstanding at the end of the period as a percentage of four-quarter moving sums of GDP)
Source: ECB.
The €254 billion decrease in net assets was mainly driven by lower net assets in portfolio debt (down from €1.57 trillion to €1.39 trillion). This development was partly offset by lower net liabilities in portfolio equity (down from €3.67 trillion to €3.60 trillion).
Table 2
International investment position of the euro area
(EUR billions, unless otherwise indicated; amounts outstanding at the end of the period, flows during the period; non-working day and non-seasonally adjusted)
Source: ECB.
Notes: “Equity” comprises equity and investment fund shares. Net financial derivatives are reported under assets. “Other volume changes” mainly reflect reclassifications and data enhancements. Discrepancies between totals and their components may arise from rounding.
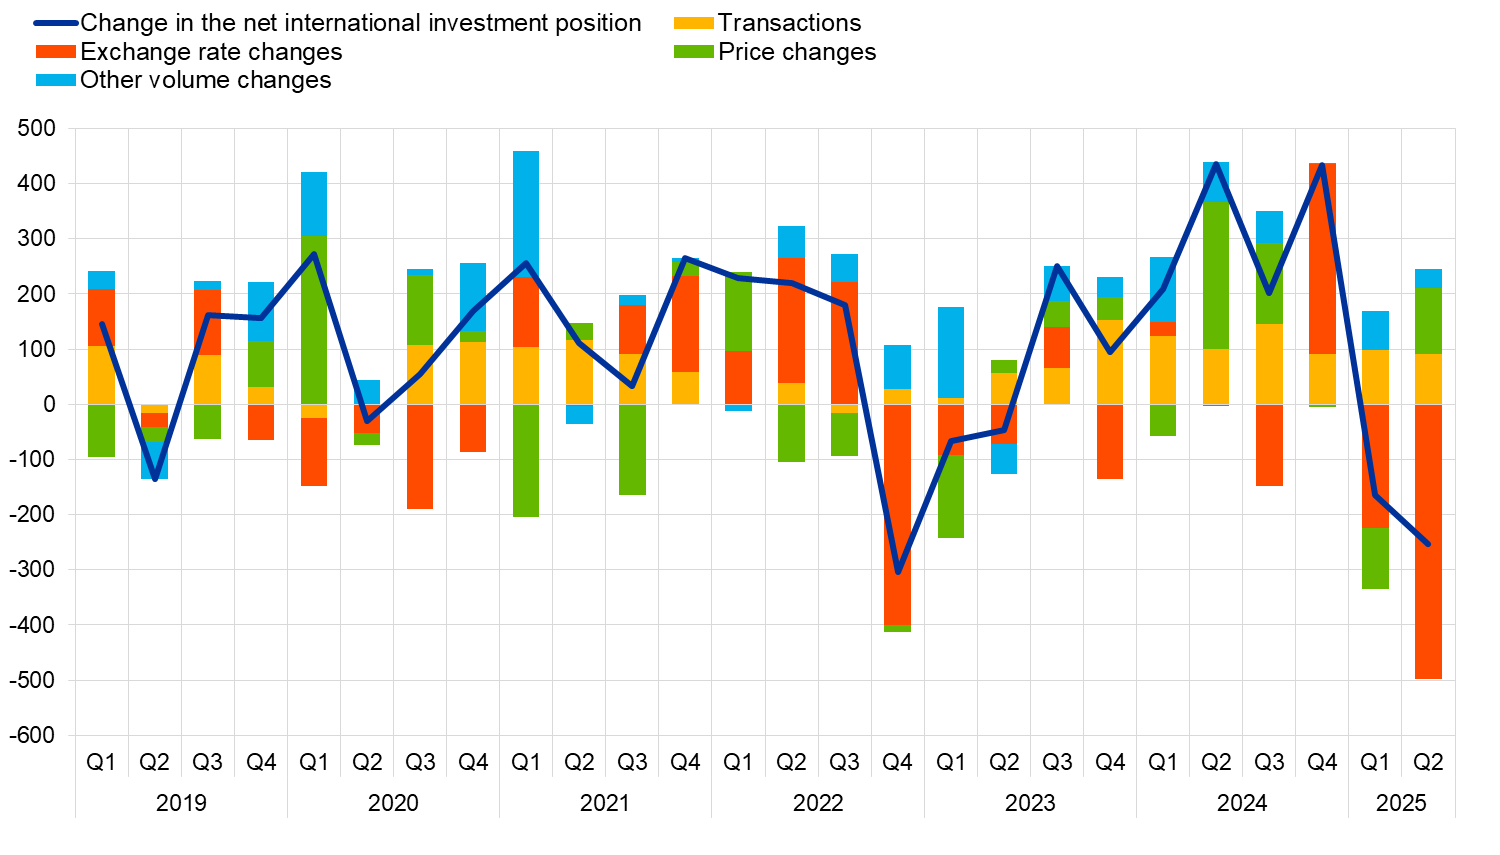
The developments in the euro area’s net international investment position in the second quarter of 2025 were driven mainly by negative exchange rate changes (€498 billion), which were partly offset by positive price changes (€120 billion), transactions (€91 billion) and other volume changes (€33 billion) (Table 2 and Chart 3).
At the end of the second quarter of 2025, direct investment assets of special purpose entities (SPEs) amounted to €3.62 trillion (29% of total euro area direct investment assets), down from €3.80 trillion at the end of the previous quarter (Table 2). Over the same period, direct investment liabilities of SPEs decreased from €3.24 trillion to €3.14 trillion (33% of total direct investment liabilities).
Gross external debt of the euro area amounted to €16.89 trillion (109% of euro area GDP) at the end of the second quarter of 2025, down by €94 billion compared with the previous quarter.
Chart 3
Changes in the net international investment position of the euro area
(EUR billions; flows during the period; non-working day and non-seasonally adjusted)
Source: ECB.
Note: “Other volume changes” mainly reflect reclassifications and data enhancements.
Data revisions
This statistical release incorporates revisions to the data for the reference periods between the first quarter of 2021 and the first quarter of 2025. The revisions reflect revised national contributions to the euro area aggregates because of the incorporation of newly available information.
Next releases
- Monthly balance of payments: 20 October 2025 (reference data up to August 2025)
- Quarterly balance of payments and international investment position: 13 January 2026 (reference data up to the third quarter of 2025)[1]
For queries, please use the Statistical information request form.
Notes
- Data are neither seasonally nor working day-adjusted. Ratios to GDP (including in the charts) refer to four-quarter sums of non-seasonally and non-working day-adjusted GDP figures.
- Hyperlinks in this press release lead to data that may change with subsequent releases as a result of revisions.