Some intriguing new measurements of salinity in the oceans around Antarctica have set off reams of sensationalist speculations. Maybe some context is helpful…
What we’ve been seeing
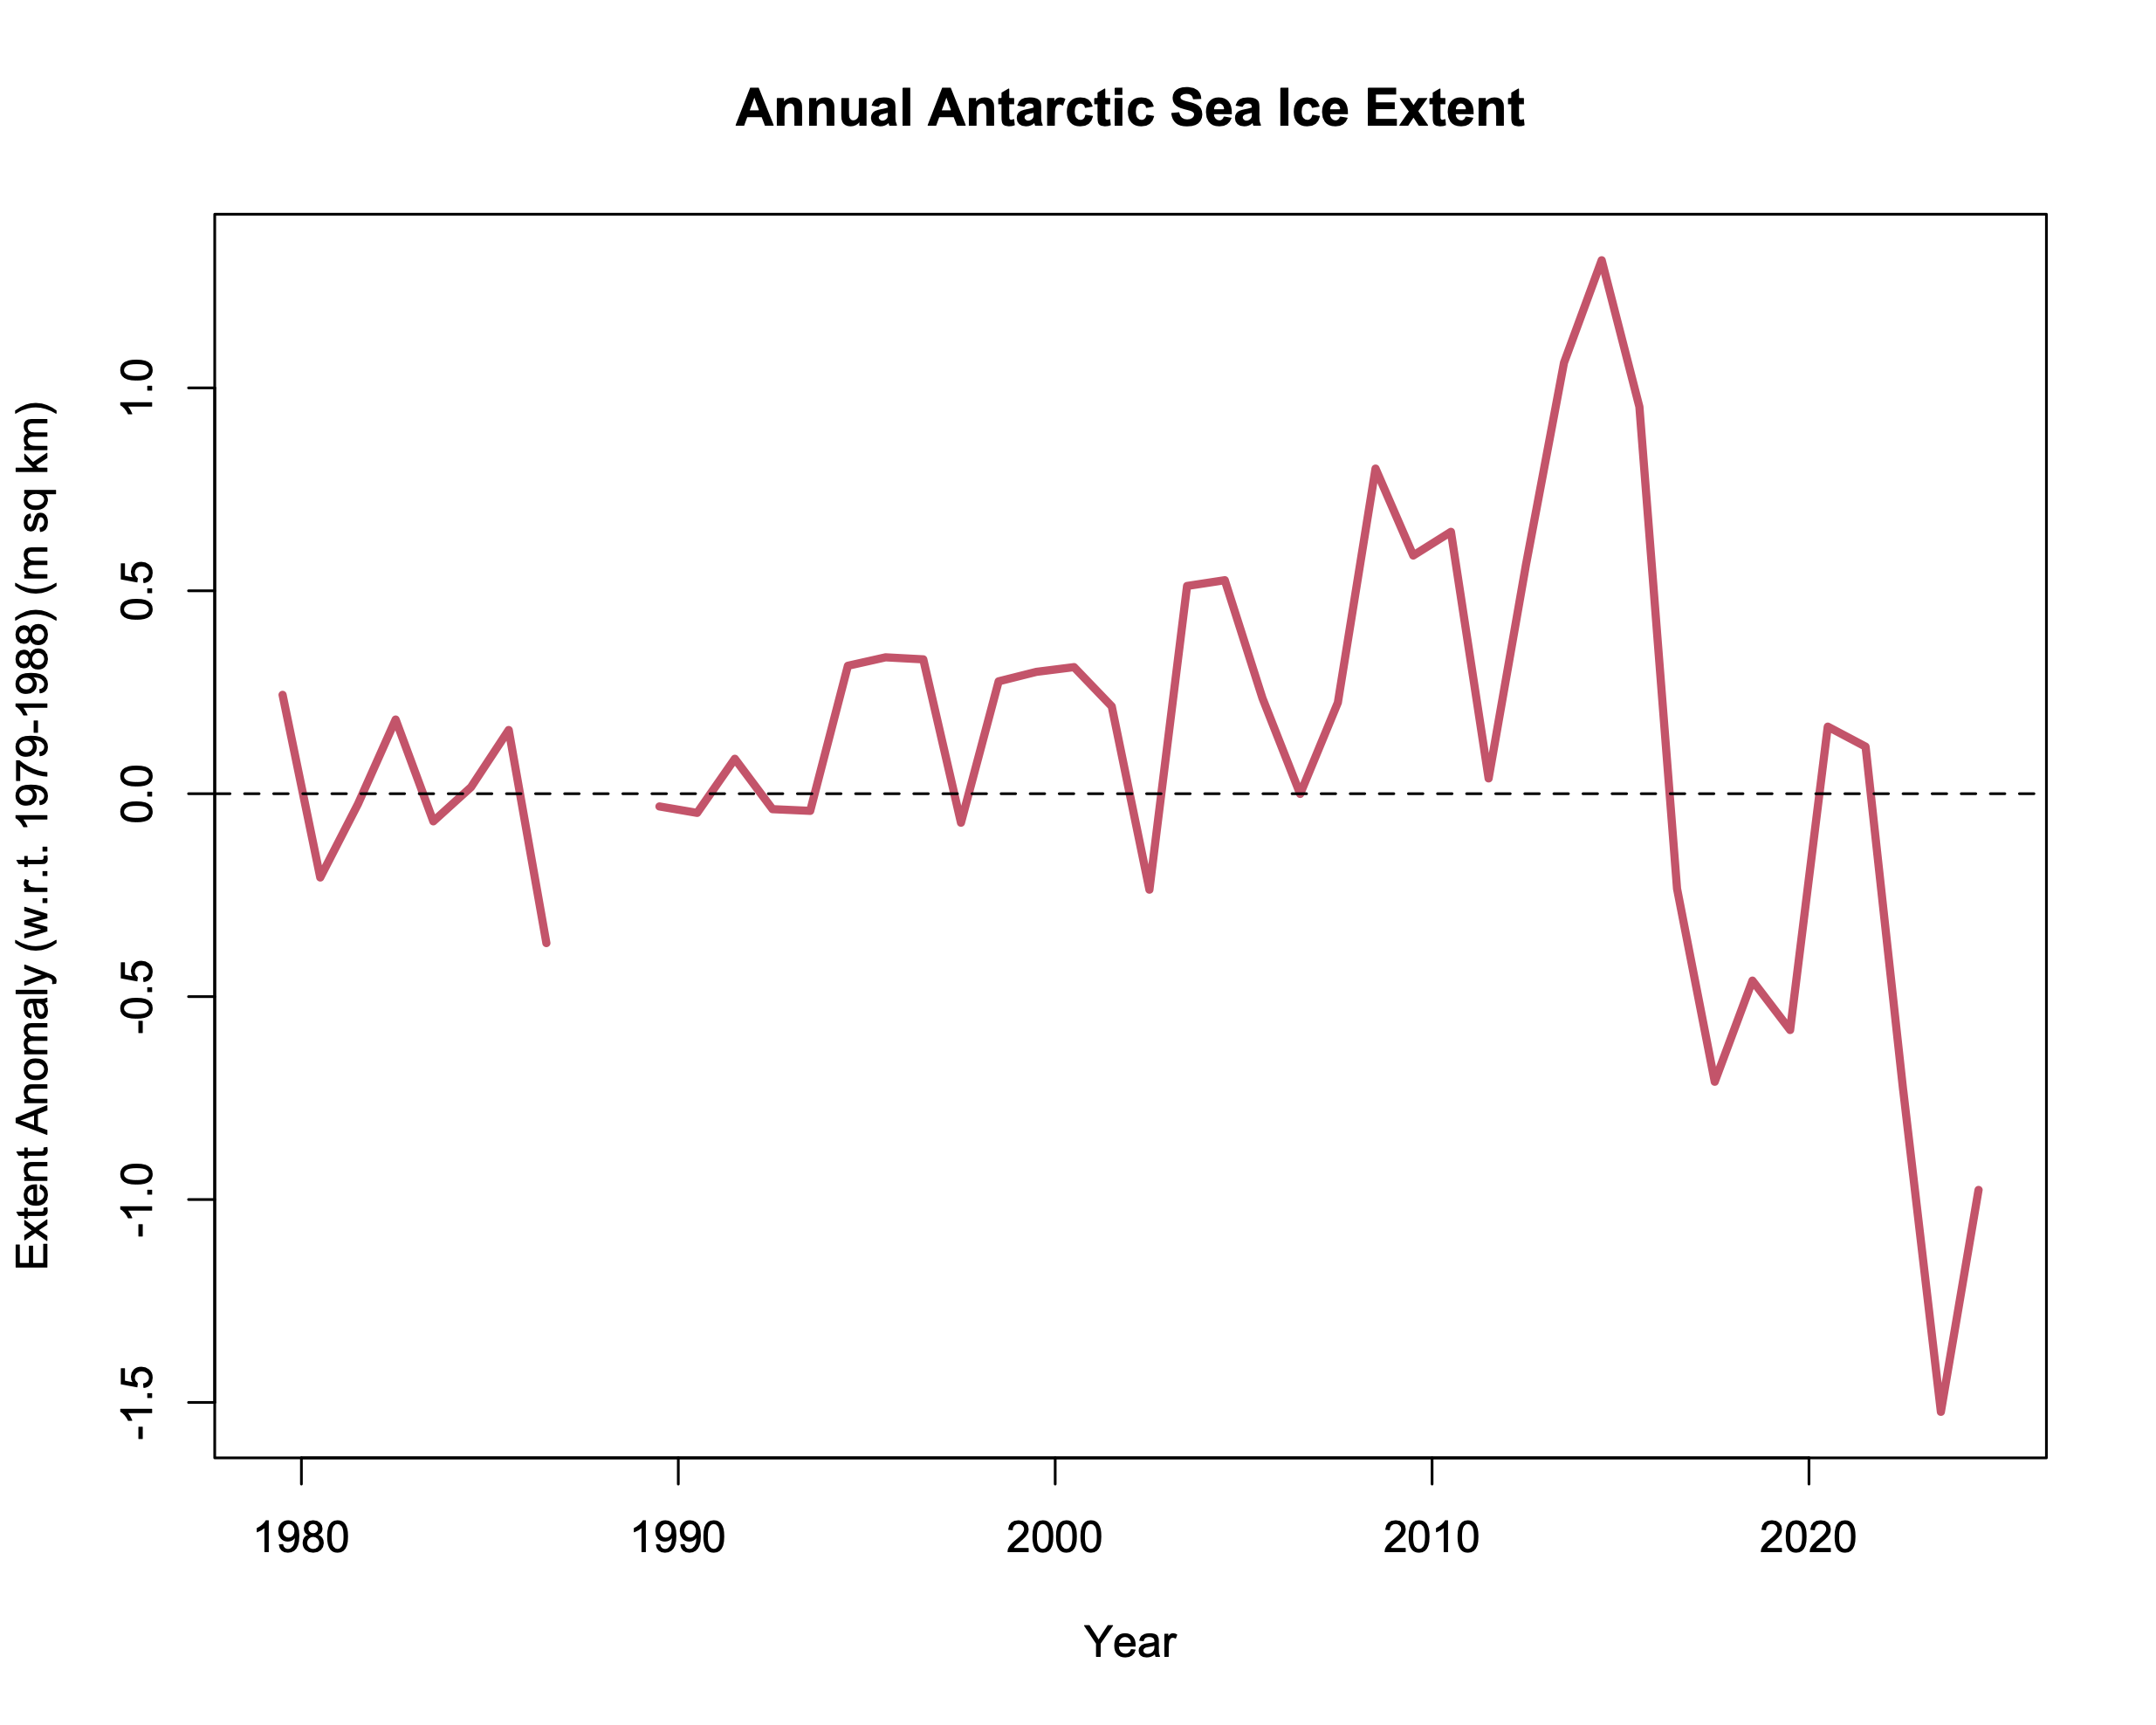
The climate change situation in the Southern Oceans (those seas surrounding Antarctica and connected by the massive Antarctic Circumpolar current) have been anomalous for many years, decades even. While even the earliest climate projections from the 1980s suggested that the climate change signal around Antarctica would be muted (especially compared to the Arctic), they did not predict that it would actually cool – which it actually has (at least until around 2015/2016). Similarly, the increase in sea ice extent (again to around 2015) was not expected.
At the same time, we saw long term increases in the southern ocean winds (which was expected, mainly as a function of the polar ozone hole and increasing CO2) and mostly steady mass loss from the continental ice sheet (via the GRACE/GRACE-FO satellites) (from WAIS and the Antarctic Peninsula mainly, offset by a slight gain in the center of the East Antarctic ice sheet).
Scientists speculated that the change in the winds led the increase sea ice (but the models did not support this), or that the freshwater meltwater anomaly had led to freshening, more stratification, and higher sea ice (for which there is some support Schmidt et al., 2023).
However, since 2016 we’ve seen the sea ice go from record high amounts to record low amounts (somewhat surprisingly), and the puzzle has switched signs. There have also been some hiccups in the mass loss from continental ice sheet, with actual increases in mass from 2020 to about 2023.
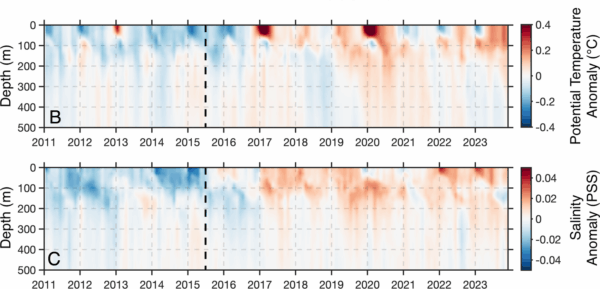
And now we have a new assessment of remote sensing and Argo measurements for ocean salinity in this region which suggests that the freshening trend to 2015 has reversed in recent years Silvano et al. (2025).
Reporting
This new result got some pretty straightforward attention in the NY Times, but the initial press release from one of the institutions (ICM) involved went way further than was justified by the paper (possibly as a result of poor translations and choices of words). The subsequent press release and a piece in The Conversation from the first author stressed the potentially global impact of the changes being seen.
I think much of this is a little overblown – these are not large changes in salinity (though the change in trend is interesting), and while the changes in Antarctic sea ice did play a small role in the record global temperatures we saw in 2023 and 2024, I think the real importance of this result are the clues it provides as to the complex processes at play in this hard-to-measure region.
Where do we start?
But to understand how processes are changing, we need a good understanding of what normally happens. The seasonal cycle in this region is large, with a massive expansion of sea ice in the winter months (with a maximum extent in September), driven mainly by ice formation near the coast. That ice is then pushed by the wind northward into the more open ocean, where there is more snowfall and a thickening of ice due to ‘snow-ice’ formation (when you get so much snow that it pushes the freeboard of the ice below the water level and sea water then mixes with the snow and freezes in situ), until the ice gets into warmer and rougher seas where it melts and breaks up.
With a few exceptions (such as was seen in a recent polynya in the Weddell Sea), deep water formation happens in the basins around the continent (as opposed to the open ocean), driven by salt rejection during sea ice formation, and this sets up an ocean circulation which is poleward at the surface and northward at depth, and where the stratification in the ocean is quite strong. This circulation is very unlikely to reverse.
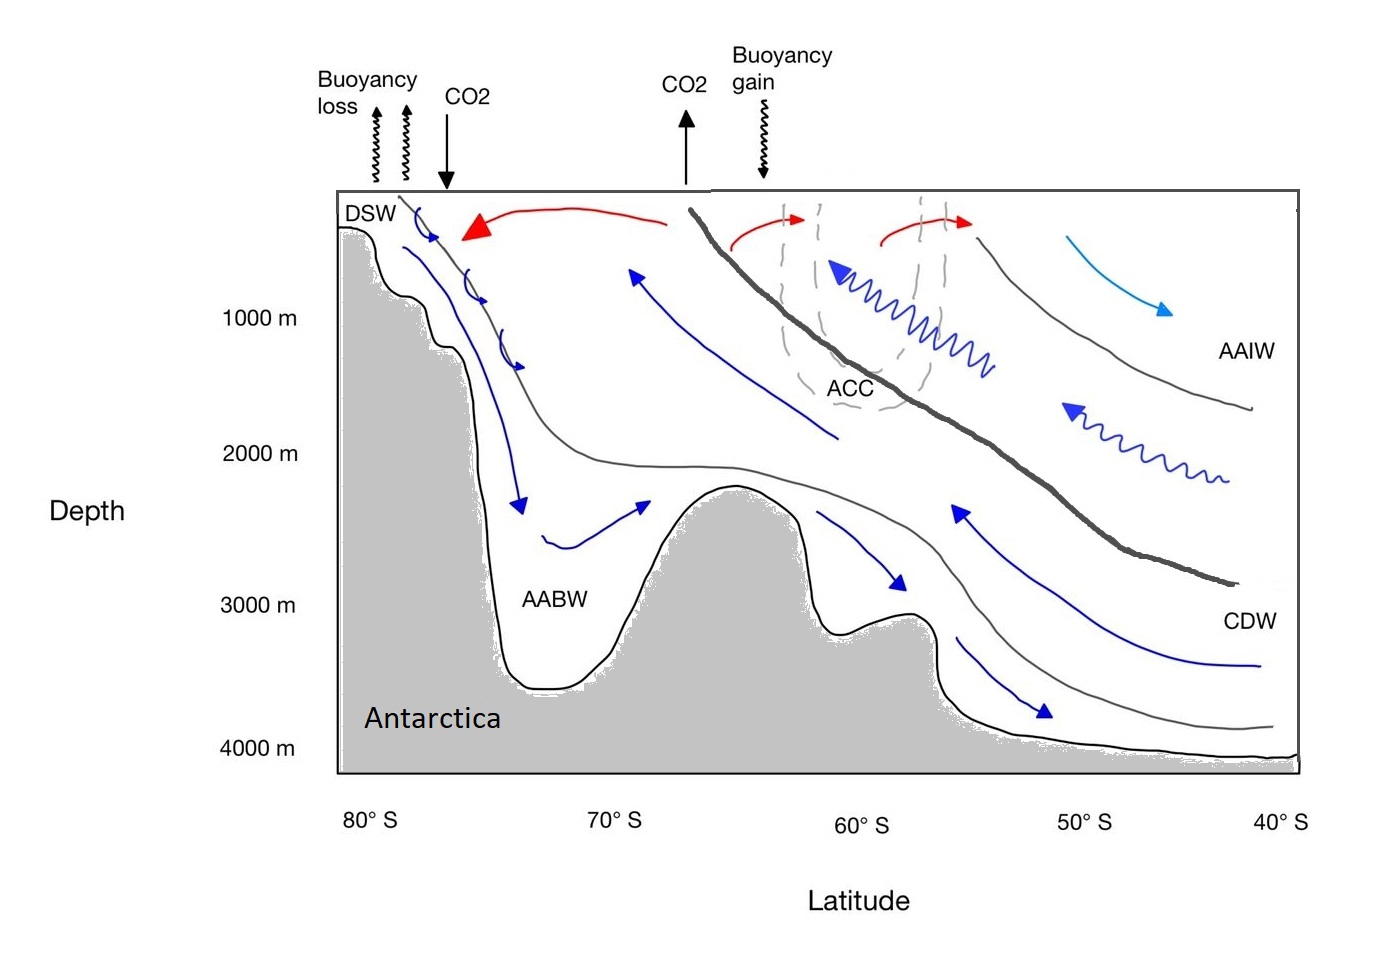
Note that the area over which the salinity trends are clearest is somewhat away from the coast and deep water origins.
Oh Buoyancy
In the schematic above, there are two areas where ‘buoyancy’ is gained and lost. In this context, adding heat and/or freshwater reduces the density and adds buoyancy, while extracting heat and/or forming sea ice (which leaves brine behind) removes buoyancy, making the water denser. Freshwater however comes in many forms – submarine meltwater from the ice sheets, melting icebergs, direct rain and snow into the ocean from storms, and even melting sea ice (further to the north usually). Changes in the salinity can be affected by changes in any of these processes – a change in the ice sheet melt or calving rate or a shift of the storm tracks – and is mediated directly by the sea ice cover itself (snow falling on sea ice has a much more muted impact on surface salinity than snow falling in the ocean).
So what does this mean?
To be clear, I don’t have any particular theory for what is happening in the Southern Ocean. The changes to 2015 (I think) are related to increasing amounts of freshwater from the ice shelves/sheets, but the very rapid turnaround subsequently is still mysterious. There are coherent signals – decreasing sea ice and higher salinity go together, poleward shifts in snowfall impact both the GRACE data and the salinity etc. but causality is hard. Was there a big decrease in meltwater? Was there a shift in storm tracks driven from the tropics? Is there a complex interplay between sea ice, salinity, winds, stratification etc. – yes.
But we don’t have great models for this – you need to include the specific histories of ice sheets and ice shelves, high resolution oceans, ice-shelf/ocean interactions, good observations of the winds and maybe better clouds and aerosols etc… The climate models that are being used for understanding the impacts of climate change don’t (yet) have interactive ice sheets, they have large biases in the Southern Ocean and very varied cloud feedbacks. The high resolution ocean models are better tools perhaps, but there are still biases in the reanalysis winds. The ice sheet models have their own issues.
There are useful things that can be done with existing models and this data will be an important target for the modeling that will get done. But understanding and better predictions will come from a synthesis of all the different elements, not just from the observations themselves, and it behoves the science community to acknowledge that more than they sometimes do.
References
- G.A. Schmidt, A. Romanou, L.A. Roach, K.D. Mankoff, Q. Li, C.D. Rye, M. Kelley, J.C. Marshall, and J.J.M. Busecke, “Anomalous Meltwater From Ice Sheets and Ice Shelves Is a Historical Forcing”, Geophysical Research Letters, vol. 50, 2023. http://dx.doi.org/10.1029/2023GL106530
- A. Silvano, A. Narayanan, R. Catany, E. Olmedo, V. González‐Gambau, A. Turiel, R. Sabia, M.R. Mazloff, T. Spira, F.A. Haumann, and A.C. Naveira Garabato, “Rising surface salinity and declining sea ice: A new Southern Ocean state revealed by satellites”, Proceedings of the National Academy of Sciences, vol. 122, 2025. http://dx.doi.org/10.1073/pnas.2500440122