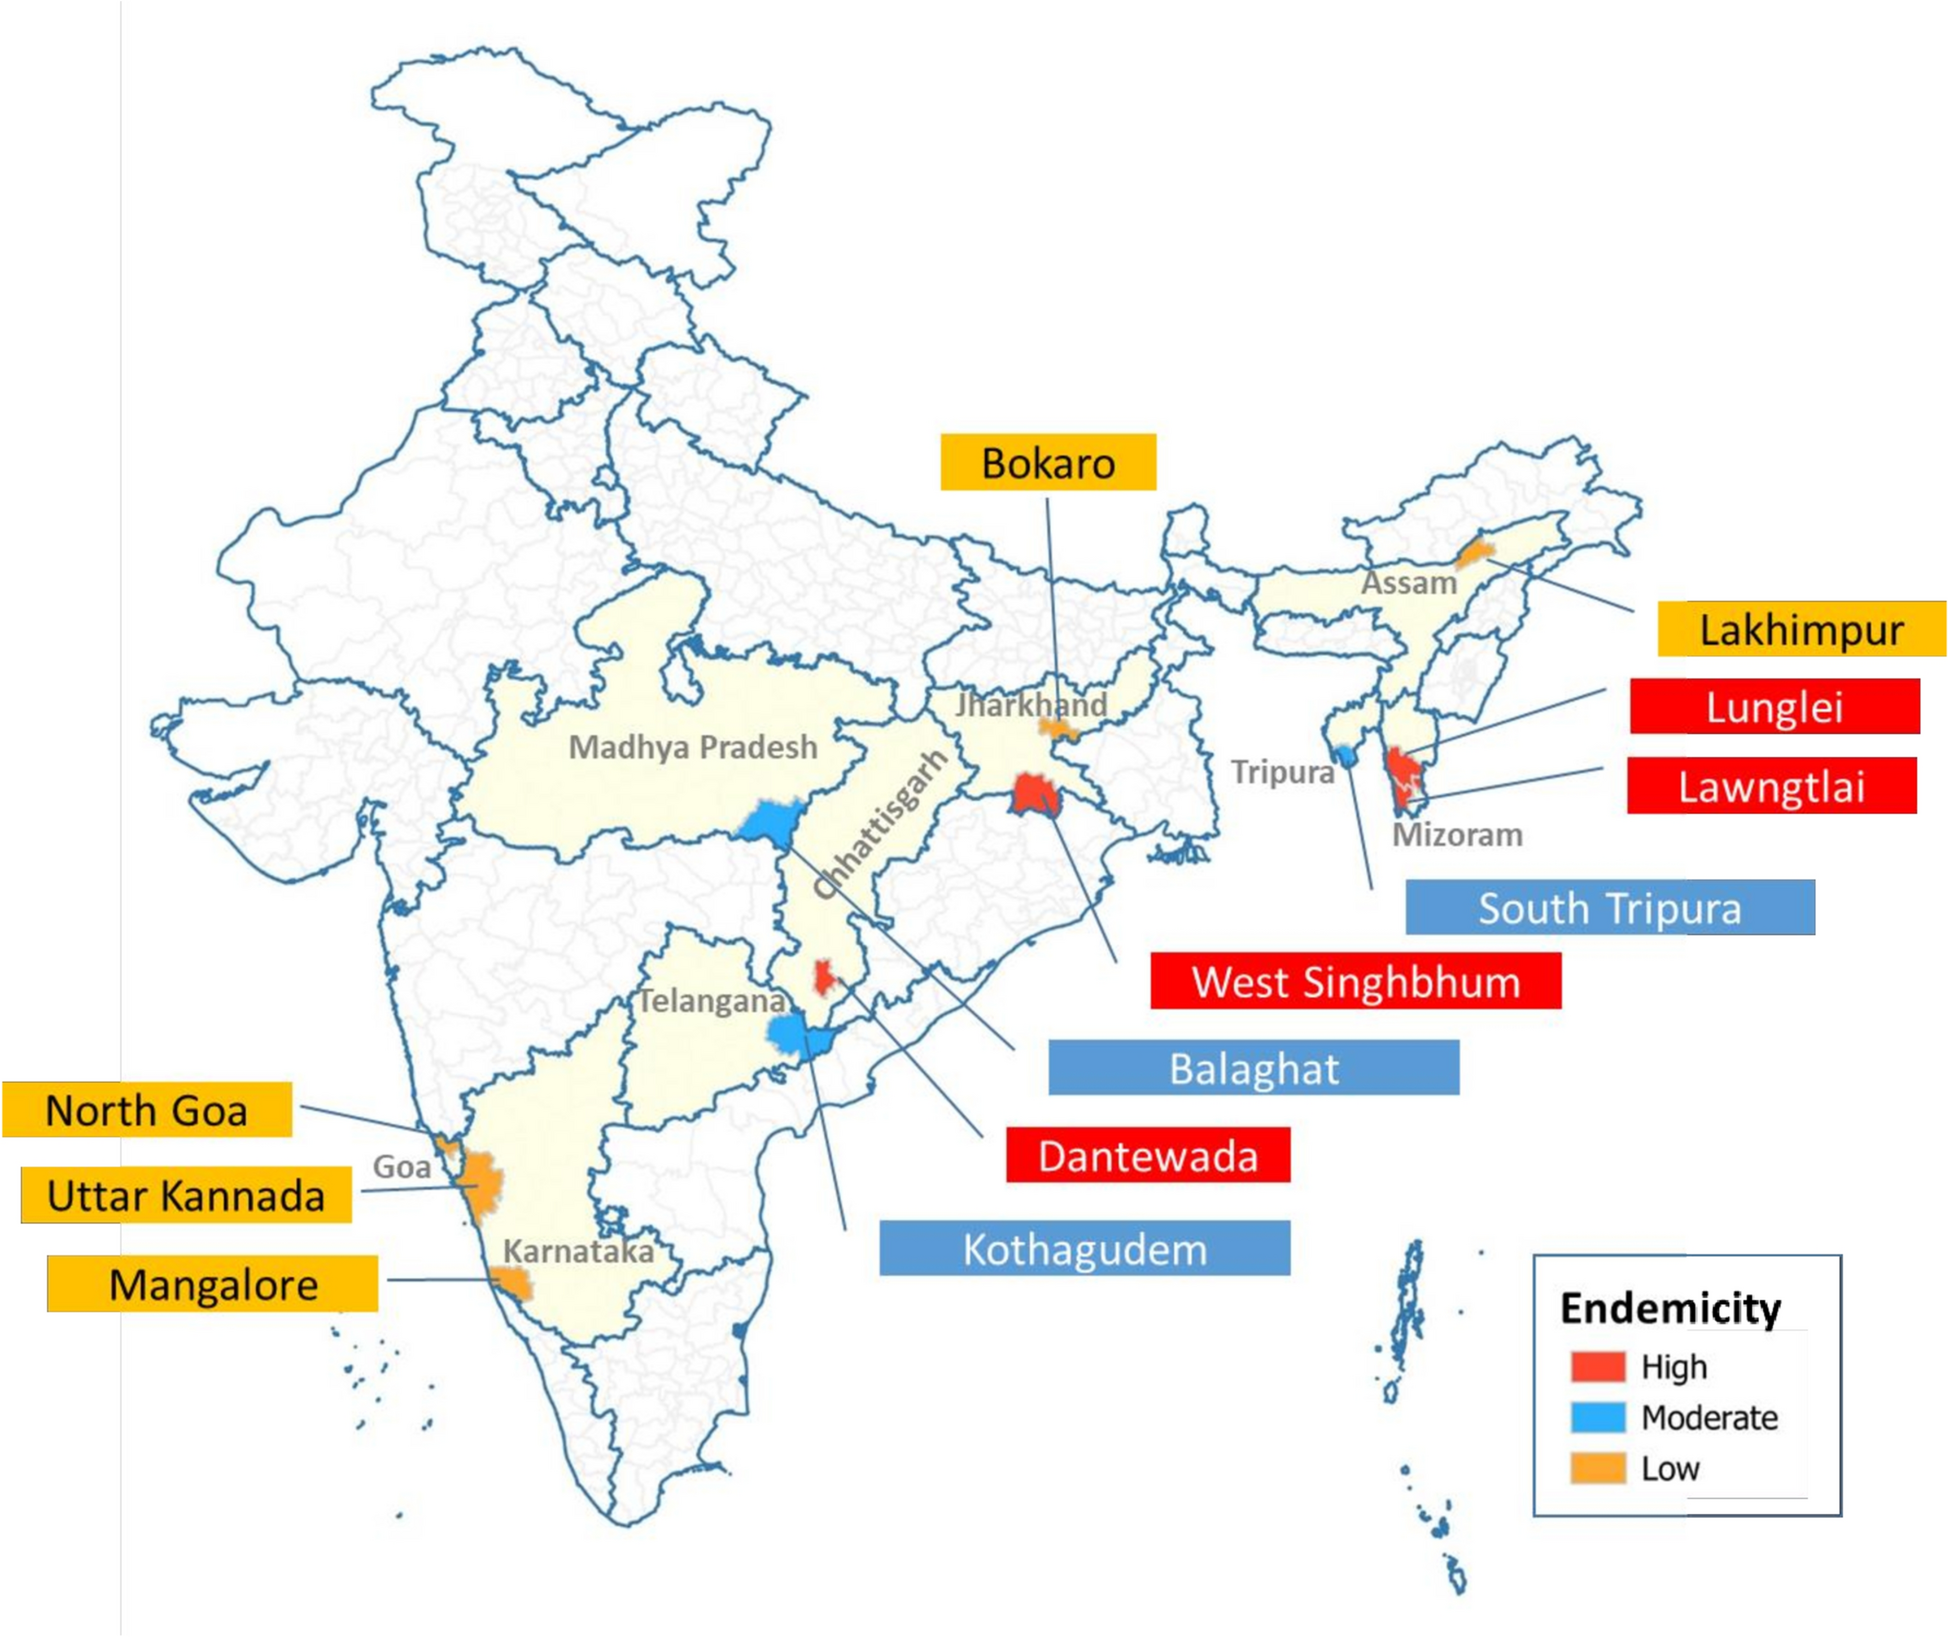
During the study period (September 2023 to April 2024), 10,290 febrile participants who consented to inclusion in the study were tested by RDT and subsequently by microscopy across 12 different study locations (Fig. 1, Table 1). Of these, 4,237 (41.2%) participants were from four highly endemic sites (Lawngtlai, Dantewada, Lunglei, and West Singhbhum), 3,477 (33.8%) were from three moderately endemic sites (Kothagudem, South Tripura, and Balaghat), and 2,576 (25.0%) were from 5 sites with low malaria endemicity (North Goa, Lakhimpur, Mangalore, Uttara Kannada, and Bokaro). Overall, 5,349 (52%) participants were female and 4,941 (48%) male. A total of 1,022 (9.9%) participants were < 5 years old, 2,774 (27.0%) were between 5 and < 15 years old, and the remaining 6,494 (63.1%) were aged 15 years or older (See supplemental file S1).
Overall malaria positivity using RDT and microscopy
Of the 10,290 participants, 1,516 (14.7%, 95% confidence interval (CI) 7.7–21.8%) tested positive for malaria (any species; either mono-infection or a mixed infection) by RDT (Fig. 2). Paired microscopic slide results were not available in 36 (0.3%) participants; reasons included damage during transportation, staining issues, and poor-quality smear. Of the 36 with missing microscopic results, 34 was RDT negative (any malaria) and 2 were RDT positive for P. falciparum. Among 10,254 participants in whom microscopy slides were available, 1,436 (14.0%, 95% CI: 6.9%–21.1%) tested positive for malaria (any species).
Malaria prevalence using microscopy and RDT for each of the study sites. 95% CI estimated using Wilson’s method. Current endemicity status for each site shown in parenthesis
Malaria positivity estimates across the study sites are presented in Table 1 and Fig. 2. In the high endemicity sites, the proportion of participants who tested positive for malaria by RDT and microscopy were 21.2% (225/1,059) and 18.2% (193/1,058) respectively in Dantewada, 23.0% (385/1,671) and 23.8% (397/1,668) in Lawngtlai, 13.9% (124/893) and 13.2% (118/891) in Lunglei, and 49.5% (304/614) and 48.4% (297/614) in West Singhbhum. The corresponding estimates in moderately endemic sites were 30.6% (272/890) and 28.8% (256/888) in Balaghat, 7.9% (131/1,681) and 6.5% (110/1,681) in Kothagudem, and 4.1% (37/906) and 3.1% (28/904) in South Tripura. The corresponding estimates in areas of low endemicities were: 0% (0/241) and 0% (0/215) in Bokaro, 0.5% (3/644) and 0.5% (3/644) in Lakhimpur, 3.4% (22/642) and 3.4% (22/642) in Mangalore, 1.7% (11/647) and 1.7% (11/647) in North Goa, and 0.2% (1/402) and 0.2% (1/402) in Uttara Kannada. Further details are presented in supplemental file S1.
Causative parasite species
Of the 1,516 RDT positives, 1,105 (72.9%) were P. falciparum mono-infection, 290 (19.1%) were P. vivax mono-infection, and the remaining 121 (8.0%) had P. falciparum and P. vivax mixed infections. Of the 1,436 who tested positive using microscopy, 1,025 (71.4%) had P. falciparum mono-infection, 304 (21.2%) had P. vivax mono-infection, 2 (0.1%) were identified as P. malariae mono-infection, 104 (7.2%) presented with a mixed P. falciparum and P. vivax, and 1 (0.1%) patient had a mixed P. falciparum and P. malariae. Species specific breakdown of the malaria status is presented in Table 1.
Performance of RDT for detecting P. falciparum mono-infection
The diagnostic accuracy of the RDTs in detecting malaria by causative parasite species is presented in Tables 2, 3, and 4. Among 10,254 participants for whom both the RDT and microscopy results were available, 8,987 (87.3%) tested negative by both methods i.e., microscopy and RDT, and 1,087 (10.6%) tested positive by both methods. Further 43 participants (0.4%) were RDT negative but were subsequently found to be microscopy positive, while the remaining 137 (1.3%) were RDT-positive but subsequently tested negative by microscopy. Overall, this resulted in sensitivity and specificity estimates for the RDT (compared to microscopy) of 95.0% [95% CI 93.0–97.0%] and 98.0% [95% CI 97.0–98.0%] respectively in high endemicity areas, 95.0% [95% CI 92.0–97.0%] and 99.0% [95% CI 98.0–99.0%] in the areas of moderate endemicities, and 100% sensitivity and specificity were observed in the areas of low endemicities (Table 3). Pooled across the study sites, the overall sensitivity and specificity estimates of the RDT was 95.0% [95% CI 94.0–96.0%] and 99.0% [95% CI 98.0–99.0%] respectively (Table 2). See Tables 2 and 3 for the predictive values and further accuracy measures.
Performance of RDT for detecting P. vivax mono-infection
The sensitivity and specificity of the RDT were respectively 81.0% [95% CI 76.0–86.0%] and 99.0% [95% CI 99.0–100%] in the areas of high endemicity, 81.0% [95% CI 58.0–95.0%] and 100% [95% CI 99.0–100%] in the areas of moderate endemicities, and 100% sensitivity and specificity were observed in the areas of low endemicities (Table 4). Pooled across the 12 study sites, the overall sensitivity and specificity of the RDT for detecting a P. vivax mono-infection were 83.0% [95% CI 78.0–87.0%] and 100% [95% CI 99.0–100%] (Table 2). See Tables 2 and 4 for the predictive values and further accuracy measures.
Performance of RDTs for detecting mixed P. falciparum and P. vivax infection
The overall sensitivity and specificity of the RDT for detecting a mixed P. vivax and P. falciparum infection were 88% [95% CI: 80%–93%] and 100% respectively (see Table 2). See Table 2 for the predictive values.
Relationship between age, sex and malaria status
In a multivariable logistic regression containing age, sex, and transmission endemicity, the following variables were associated with increased odds of test positivity by RDTs: every 5 yearly increase in age was associated with 12% lower odds of testing positive (adjusted odds ratio (AOR): 0.88, 95% CI 0.86–0.90), being male (AOR: 1.24, 95% CI 1.10–1.39) (compared to females), and residing in the areas of high malaria endemicity (AOR: 17.33, 95% CI 12.55–24.68) or moderate endemicity (AOR: 7.81, 95% CI 5.62–11.21) (compared to areas of low transmission) (Fig. 3 and see supplemental Table 1 and supplemental Table 2).
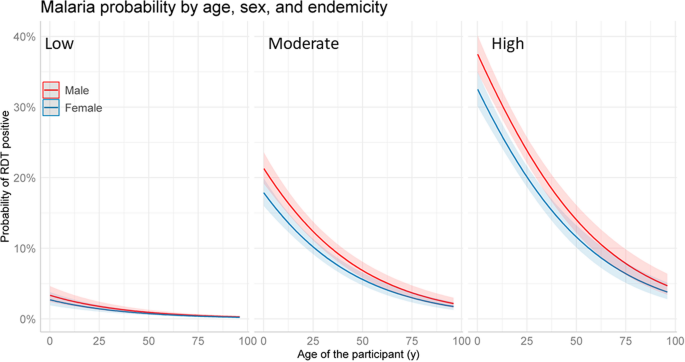
Probability of RDT confirmed malaria status by age, sex, and transmission setting. Predictions obtained from a multivariable logistic regression that contained age, transmission setting and sex. The model had age as a linear effect which was the most parsimonious model. For comparison of different model fits, see supplemental file 1