The biological characteristics of Bambusa oldhamii Munro
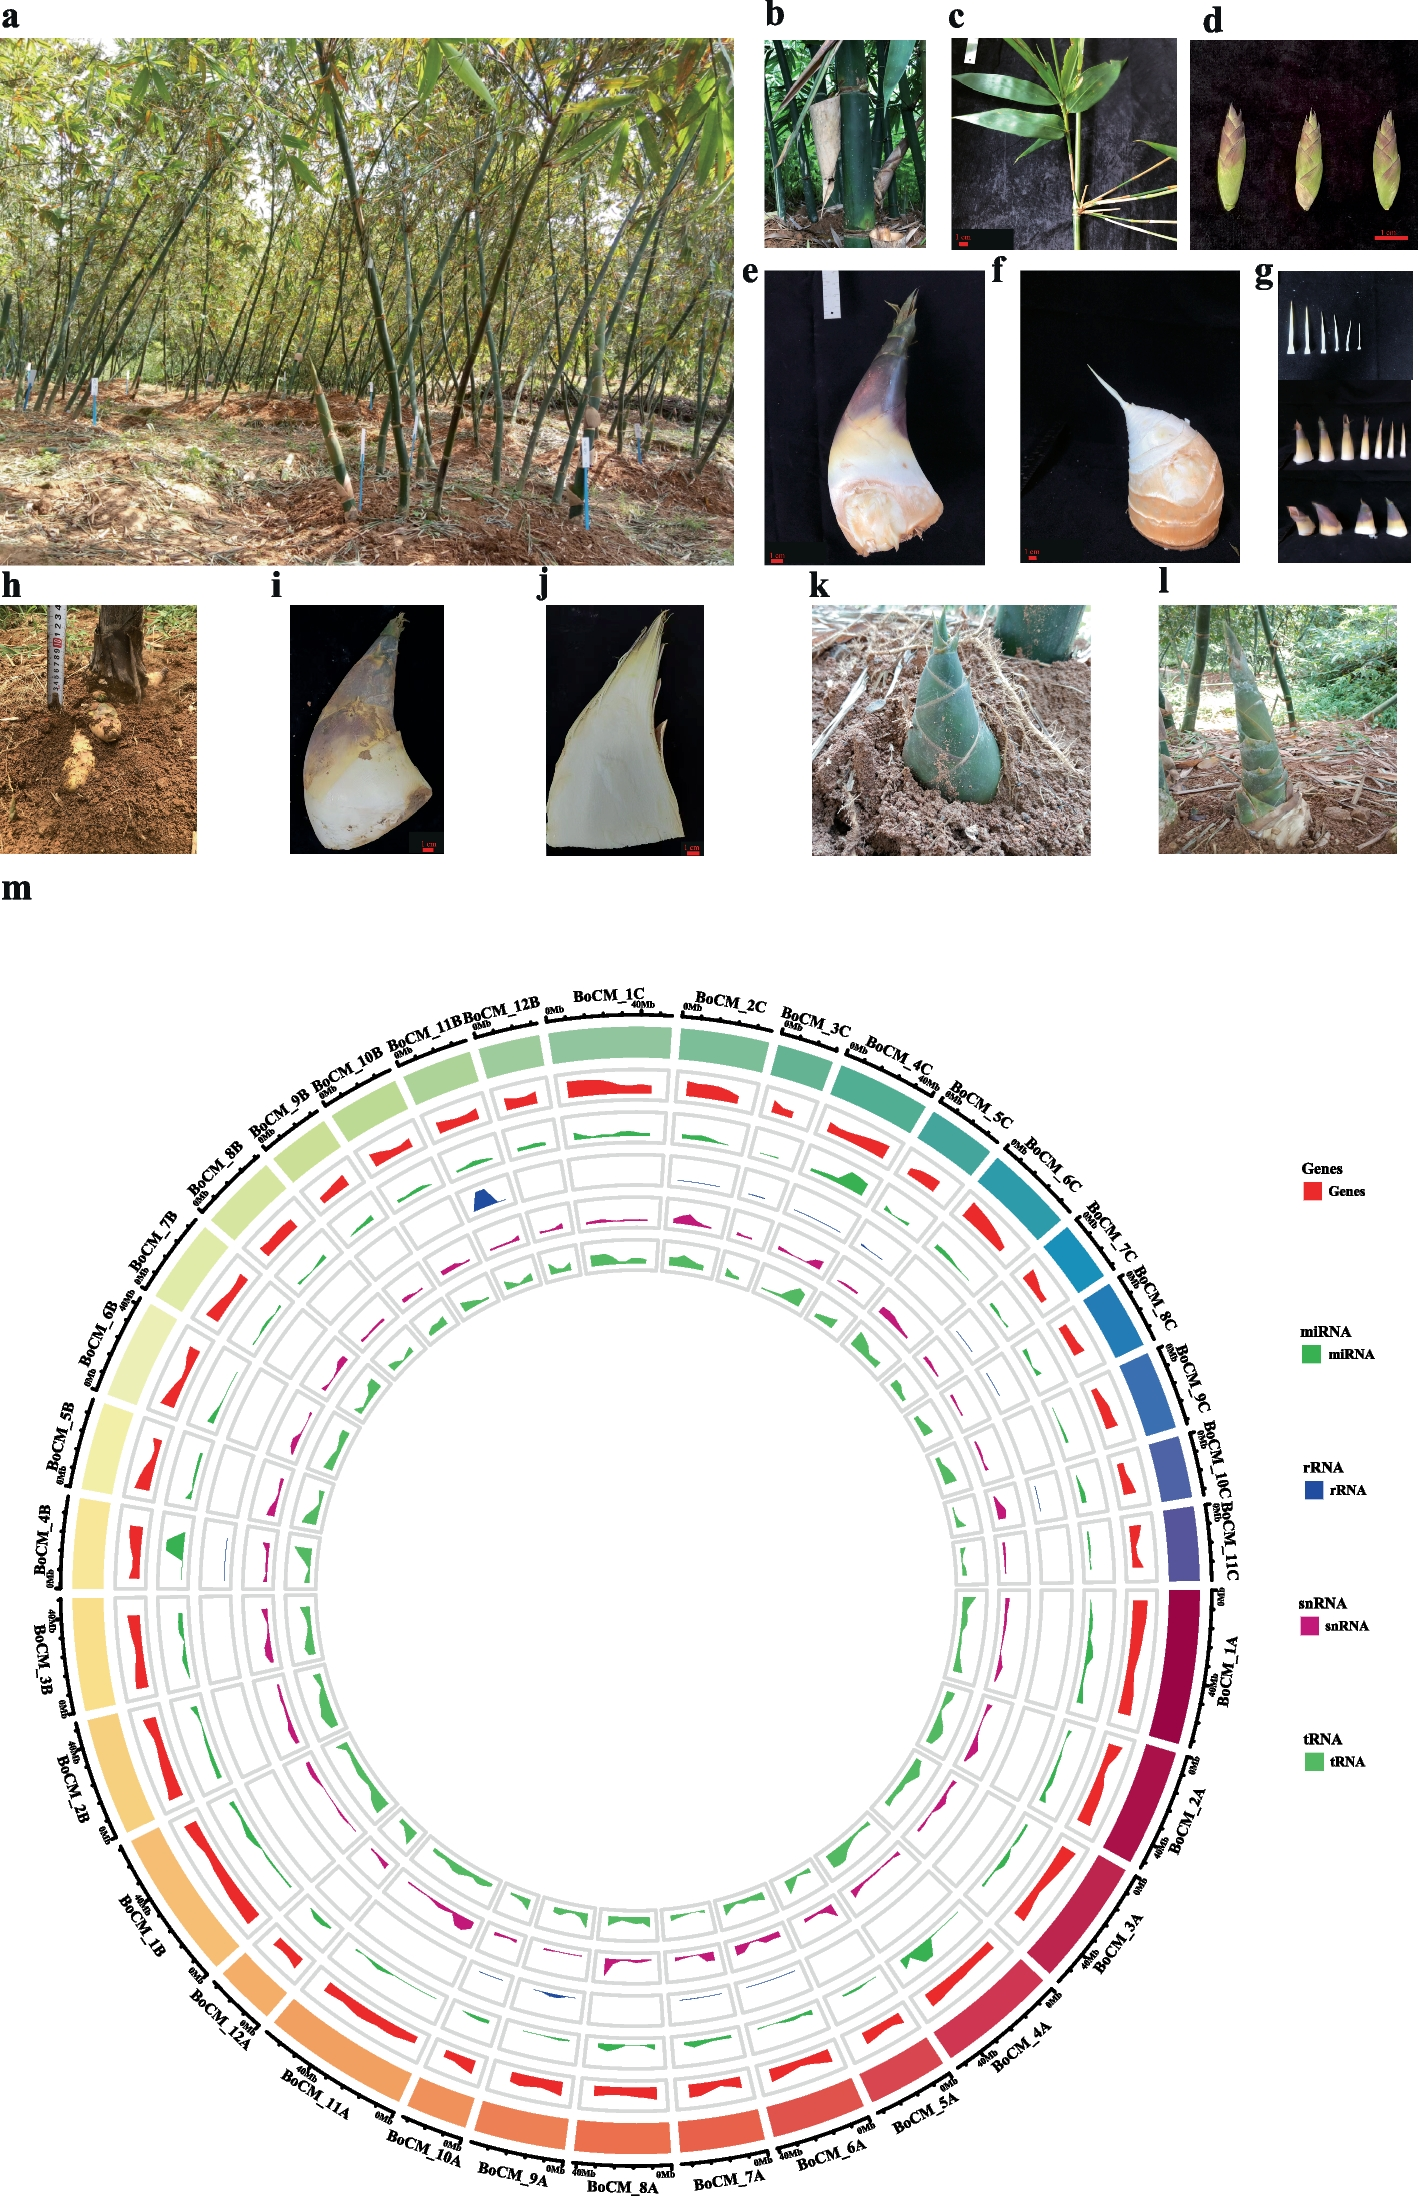
Clumping bamboo has sympodial rhizomes that are characterized by their rhizomes growing outwards from buds on a “mother” rhizome, eventually turning upwards to become new culms (Fig. 1a). The culm height of B. oldhamii ranges from 6 to 12 m, the culm diameter ranges from 3 to 9 cm, depending on the growth environment, the internode length ranges from 20 to 35 cm, and the wall thickness ranges from 4 to 12 mm, depending on growth conditions (Fig. 1b). There are multiple branches in each node of the middle and top culms in B. oldhamii, about 5 leaves in each little branch, and the leaf length ranges from 10–20 cm, and the leaf width ranges from 1.0 to 1.5 cm (Fig. 1c). The flowering period happens between May to November and includes bracts (3–5) and florets (5–9) (Fig. 1d). The shooting period is from May to November, the young edible shoots are sold as fresh vegetables on the market or marked as processed food, and the sheaths of the shoots are deciduous, leathery, dark brown spinous-hairy (Fig. 1e-g). The shoot of B. oldhamii had their best taste and maximum edible portion when they had not erupted out of the soil surface (Fig. 1h-j). When the shoot of B. oldhamii erupted out of the soil surface, the above-ground part of the shoot sheaths would be green with the sunlight and days (Fig. 1k). The old inedible shoots would be degraded or grown into young bamboo culms and then form a new bamboo (Fig. 1l).
The biological phenotype and genome characteristics of B. oldhamii. a A clumping forest of B. oldhamii; b A culm internode of B. oldhamii; c A leaf branch of B. oldhamii; d The florets of B. oldhamii; e A edible shoot of B. oldhamii; f The shoots of B. oldhamii with shells off; g The off shells of a bamboo shoot; h Phenotype of the shoots under soil surface; i The phenotype of the edible shoot usually sold on market. j The longitudinal section of the edible shoot is usually sold on the market. k–l The shoot has erupted out of the soil surface within several days. m The genome circular graph of B. oldhamii from the inner to outer track represents the density of tRNA, snRNA, rRNA, miRNA, and Genes; the last outer track represents the length of chromosomes in different colors
To comprehend this bamboo species more deeply, the genetic genome information of B. oldhamii was explored. Compared with the internal standard tomato with a genome size of 800 Mb and a peak around 51.03 using flow cytometric fluorescent detection (Fig. S1a), the estimated genome size of B. oldhamii is 1.375 Gb with a peak around 87.77 (Fig. S1b). The Illumina sequencing method was used to estimate the genome size of B. oldhamii around 1.33 Gb based on the 27 K-mer length (Fig. S2). Based on the above genome size estimation results, we processed the whole nuclear genome sequence with PacBio HiFi (40X) and HiC (100X) sequencing projects. After the PacBio HiFi and Hi-C sequencing of B. oldhamii, about 97.23% of contig sequences were anchored on the pseudomolecule chromosomes, and a total of 35 pseudochromosomes were acquired based on synteny analysis with the relative species D. latiflorus. The final Pseudochromosome genome was evaluated with the Chromosome Hi-C signal heatmap, corresponding to the Hi-C assisted genome assembly thesis (Fig. S3), and the final genome BUSCO evaluation is 96.59%.
The final assembled genome size of B. oldhamii is 1.446 Gb, the N50 of all the 1851 scaffolds is 38,936,033 bp, and the GC contents are 45% (Table 1). After the gene structure annotation, a total of 88,140 genes were acquired. All 88,140 genes were annotated in Nr, Swissprot, KEGG, KOG, TrEMBL, Interpro, and GO databases with rates of 76.87%, 50.46%, 49.24%, 47.25%, 76.70%, 62.48%, and 55.74% respectively. Finally, about 78.11% (68,843) of genes acquired the functional annotations (Table 1) (Table S1). The noncoding RNA, including miRNA, tRNA, rRNA, and snRNA, was annotated at the rate of 0.003297%, 0.043679%, 0.356499%, and 0.008666% respectively, on the whole genome (Fig. 1m) (Table S2). In the genome annotation of B. oldhamii, a total of 779,839,625 bp repeat genome sequences were acquired and occupied 53.89% of the genome size (Table S3). Based on the transcription factor annotation, the large number of transcription factor families is bHLH, NAC, MYB, bZIP, C2H2, AP2/ERF-ERF, and AP2/ERF-AP2 (Table S4).
The basic genome analysis of B. oldhamii Munro
Through the identification and analysis of genome homologous genes and families can obtain single-copy gene families and multi-copy gene families. We statistics the families and genes in the following species: A. thaliana, A. trichopoda, B. oldhamii (subgenomes A, B, and C), D. latiflorus (subgenomes A, B, and C), O. latifolia, O. sativa, P. edulis (subgenomes C and D), P. trichocarpa, and R. guianensis (Table S5). The results of orthologs and family statistics showed that A. trichopoda has the greatest number of Single-copy orthologs, P. trichocarpa has the greatest number of Multi-copy orthologs, and O. latifolia has the most Unique paralogs (Fig. S4a) (Table S5). 5522 ortholog families exist in both species of B. oldhamii (subgenomes A, B, and C) and O. sativa (Fig. S4b), and 8250 ortholog families that exist in the species of B. oldhamii_A, P. edulis_C, D. latiflorus_A, and O.latifolia (Fig. S4c). As the Phylogenetic tree analysis results show that the species of A. trichopoda is the outer taxa, the other species in the phylogenetic tree are consistent with the phylogenetic positions of the APG IV system. A. thaliana and P. trichocarpa branched together, and the others belong to Poaceae including the bamboos and rice, moreover, the A sub-genome of D. latiflorus_A and B. oldhamii_A branched together, the B sub-genome of D. latiflorus_B and B. oldhamii_B branched together, and the C sub-genome of D. latiflorus_C and B. oldhamii_C branched together (Fig. S5).
Based on the time tree criterion (http://www.timetree.org/), the divergence time between O. sativa and A. thaliana was 130–200 million years ago (Mya), and between P. trichoparca and A. thaliana was 100–120 Mya. As the result shows that the divergence time between O. latifolia and R. guianensis is 47.5 (26.3—69.8) Mya, and the divergence time between O. sativa and bamboos is 100.7 (76.1–126.1) Mya (Fig. 2a). The results of 4DTv analysis showed that the last whole genome duplication of B. oldhamii_A, B. oldhamii_B, and B. oldhamii_C happened after the first divergence of O. sativa. (Fig. 2b). We do the gene family expansion and contraction between genomes and subgenomes (Fig. 2c) (Table S6). The results showed that A. thaliana has the most expansion gene families, and P. trichocarpa has the most contraction gene families, and then is the plant species A. trichopoda (Fig. 2c). The genes in the collinearity fragment have maintained a high degree of conservation throughout species evolution. The genome synteny results showed that there are more blocks between O. sativa and B. oldhamii than between B. oldhamii and D. latiflorus, but the mean block length was larger in B.oldhamii and D. latiflorus than in B. oldhamii and O.sativa (Fig. 2d-f) (Table S7).
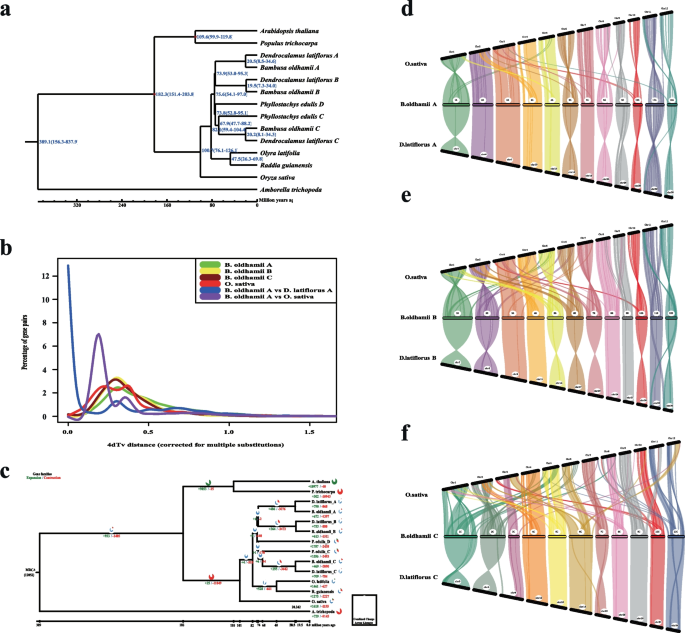
The phenotype and genome characteristics of B. oldhamii. a The estimation of divergence time among species. The number in blue color on the branches means the estimated divergence time (Mya), and the red nodes are tagged as the criteria divergence time (Mya). b The distribution of 4DTv distance (corrected for multiple substitutions). c The gene family expansion and contraction between A. thaliana, A. trichopoda, B. oldhamii (subgenomes A, B, and C), D. latiflorus (subgenomes A, B, and C), O.latifolia, O.sativa, P.edulis (subgenomes C and D), P. trichocarpa, and R. guianensis. d The synteny analysis between O. sativa, B. oldhamii_A, and D. latiflorus_A. e The synteny analysis between O.sativa, B.oldhamii_B, and D.latiflorus_B. (f) The synteny analysis between O. sativa, B. oldhamii_C, and D. latiflorus_C
We acquired the expansion and contraction genes in the three subgenomes of B. oldhamii, in B. oldhamii_A, there were 160 contraction genes and 888 expansion genes (Table S8), and the expansion genes were enriched in the pathway of Plant-pathogen interaction, sulfur relay system, homologous recombination, and valine leucine and isoleucine degradation and others (Fig. S6) (Table S9). In B. oldhamii_B, there are 163 contraction genes belong to 128 families and 669 expansion genes belong to 99 families (Table S10), and the expansion genes were enriched in the pathway of alpha-Linolenic acid metabolism, homologous recombination, glycerophospholipid metabolism, arginine biosynthesis, sesquiterpenoid and triterpenoid biosynthesis, diterpenoid biosynthesis, flavonoid biosynthesis and others (Fig. S7) (Table S11). In B. oldhamii_C, there are 167 contraction genes belonging to 182 families, and 372 expansion genes belong to 46 families (Table S12), and the expansion was enriched in the pathway of homologous recombination and basal transcription factors (Fig. S8) (Table S13).
Data mining of transcriptome and metabolome in multiple shoot developmental phases
Seven developed phases of the shoot in B. oldhamii were picked out searching for the bitter chemicals and key genes contributing to the taste transition from delicious taste to a little bitter taste with transcriptome and metabolome (Fig. 3a). DNBSEQ platforms were used to sequence the 21 shoot samples (7 phases with three biological replicates in each phase). The transcriptome data of each sample is about 6.45 Gb, the average mapping rate of the genome is 91.49%, and the average mapping rate of the gene sets is 65.69%. Based on the reference genome annotation, 88,140 genes were Known Genes, and 3,228 Novel Genes from the RNA-seq data (Table S14). A total of 53,252 genes were detected as expressed genes, 50,129 were known genes (49,365 DEG and 764 Non DEG), and 3,123 genes were novel (3121 DEG and 2 Non DEG) (Fig. 3b) (Table S15). A total of 42,887 new transcripts were detected, 39,659 new alternative splice isoforms distributed in 20,786 known protein-coding genes, and 3,228 were novel gene coding transcripts (Table S16). The FPKM distribution of the transcription factor families in Known Genes was analyzed (Fig. 3c). The results showed that the families of bHLH, MYB-related, bZIP, C3H, HB-, C2H2-, and TUB transcription factors might play crucial roles in shoot growth and development. There are large number of those transcription factors whose expressions were activated in certain shoot developing phases (FPKM > 10).
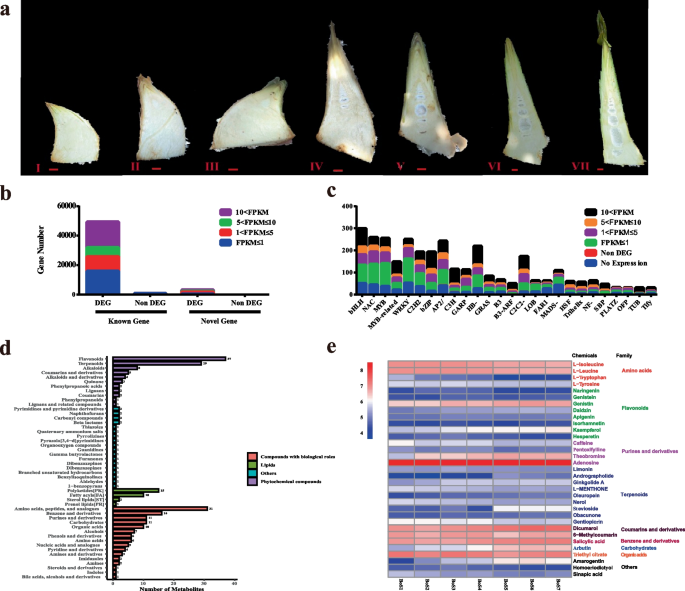
Basic data mining of transcriptome and metabolome in multiple shoots developing phases of B. oldhamii. a The sectional shoot morphology of seven developing phases; b The FPKM distribution of expressed Known genes and Novel genes in the transcriptome of seven developing phases. c The FPKM distribution of transcription factors in the genome’s known genes is based on the transcriptome expression data. d The classification of all metabolites detected in the shoot of seven developing phases; e The classification of mined bitter metabolites and relative accumulated patterns in seven developing bamboo shoots of B. oldhamii
A total of 428 qualified metabolites were identified (Table S17). The class of phytochemical compounds includes 37 flavonoids, 29 terpenoids, and others (Fig. 3d). The class of compounds with biological roles includes 31 amino acids, peptides, and analogs, 16 benzene and derivatives, 11 carbohydrates, 11 purines and derivatives, 10 organic acids, and others (Fig. 3d). The class of Lipids includes 15 polyketides, 10 Fatty acyls, and others (Fig. 3d). In order to acquire the bitter metabolites, each metabolite was checked against bitterDB. Finally, 33 bitter metabolites were acquired in this research, major distributed in the families of Amino acids metabolites (L-Isoleucine, L-Leucine, L-Tryptophan, and L-Tyrosine), Flavonoids (Naringenin, Genistein, Genistin, Daidzin, Apigenin, Isorhamnetin, Kaempferol, and Hesperetin), Purines and derivatives (Caffeine, Pentoxifylline, Theobromine, and Adenosine), Terpenoids (Limonin, Andrographolide, Ginkgolide A, L-MENTHONE, Oleuropein, Nerol, Stevioside, Obacunone, Gentiopicrin) and others (Dicumarol, Arbutin, Amarogentin, and others) (Fig. 3e). The taste transition is complex; bitter taste is usually accompanied by astringent taste generation. Tannin is a criterion to measure astringent taste. In the correlation analysis, we added tannin as a measurement criterion for mining the accompanied bitter metabolites. The bitter metabolites positively correlated with the content of tannins were Flavonoids (Genistin, Daidzin, Kaempferol), Terpenoids (Oleuropein, Stevioside, Obacunone), Purine and derivatives (Theobromine), Coumarin and derivatives (Dicumarol), Benzene and derivatives (Salicylic acid), Carbohydrate (Arbutin), and Amarogentin. The negative correlation between bitter metabolites with tannin content was amino acids (L-Isoleucine, L-Leucine, L-Tyrosine), Terpenoids (L-menthone, Nerol, Gentiopicrin), and Sinapic acid (Fig. S9).
The differentially accumulated metabolites between phases were analyzed (Table S18). In the comparison of BoS2 vs. BoS1 (81 DAMs, 46 up DAMs, and 35 down DAMs), all the DAMs were significantly enriched in the pathway of flavone and flavonol biosynthesis, monoterpenoid biosynthesis, and tyrosine metabolism (Fig. S10a). In the comparison of BoS3 vs. BoS2 (49 DAMs, 25 up DAMs, and 24 down DAMs), all the DAMs were significantly enriched in the pathway of phenylalanine, tyrosine, and tryptophan biosynthesis (Fig. S10b). In the comparison of BoS4 vs. BoS3 (61 DAMs, 26 up DAMs, and 35 down DAMs), all the DAMs were significantly enriched in the pathway of Monoterpenoid biosynthesis, Metabolic pathways, and Biosynthesis of secondary metabolites (Fig. S10c). In the comparison of BoS5 vs. BoS4 (172 DAMs, 89 up DAMs, and 83 down DAMs), the total DAMs were significantly enriched in the pathway of aminoacyl-tRNA biosynthesis, metabolic pathway, biosynthesis of secondary metabolites, biosynthesis of amino acids, and phenylalanine metabolism (Fig. S10d). In the comparison of BoS6 vs. BoS5 (45 DAMs, 31 up DAMs, and 14 down DAMs), all the DAMs were enriched in the pathway of Stilbenoid, diarylheptanoid, and gingerol biosynthesis (Fig. S10e). In the comparison of BoS7 vs. BoS6 (23 DAMs, 14 up DAMs, and 9 down DAMs), all the DAMs were enriched in the pathway of flavone and flavonol biosynthesis (Fig. S10f). Finally, a total of 373 non-repeated differentially accumulated metabolites were acquired (Table S19).
Joint analysis between transcriptome and metabolome
From the combined analysis between metabolome and transcriptome, the DAMs and DEGs in each comparison were enriched with KEGG pathways. All the 81 DAMs and 858 DEGs in comparison of BoS2 vs. BoS1 enriched in the pathway of Biosynthesis of secondary metabolites, Glyoxylate and dicarboxylate metabolism, Glycolysis/Gluconeogenesis, and other pathways (Fig. S11) (Table S20). All the 49 DAMs and 439 DEGs in comparison of BoS3 vs. BoS2 enriched in the pathway of Biosynthesis of secondary metabolites, beta-alanine metabolism, Amino sugar and nucleotide sugar metabolism, Alanine, aspartate, and glutamate metabolism, Tryptophan metabolism, and other pathways (Fig. S12) (Table S21). All the 61 DAMs and 388 DEGs in comparison of BoS4 vs. BoS3 enriched in the pathway of Biosynthesis of secondary metabolites, Glutathione metabolism, Flavonoid biosynthesis, Plant hormone signal transduction, and other pathways (Fig. S13) (Table S22). All the 172 DAMs and 516 DEGs in the comparison of BoS5 vs. BoS4 enriched in the pathway of Biosynthesis of secondary metabolites, Isoflavonoid biosynthesis, Plant hormone signal transduction, and other pathways (Fig. S14) (Table S23). All the 45 DAMs and 337 DEGs in comparison of BoS6 vs. BoS5 enriched in the pathway of Biosynthesis of secondary metabolites, Pyrimidine metabolism, and other pathways (Fig. S15) (Table S24). All the 23 DAMs and 410 DEGs in comparison of BoS7 vs. BoS6 enriched in the pathway of Flavone and flavonol biosynthesis and Flavonoid biosynthesis (Fig. S16) (Table S25). From this joint comparison analysis, we find that the pathway of biosynthesis of secondary metabolites, amino acid metabolism, biosynthesis of flavonoid, flavone, flavonol and isoflavonoid, plant hormone signal transduction, and others play important roles in the flavor transition biological process.
The WGCNA analysis between the bitter metabolites and gene expression showed that the bitter metabolites, such as L-Isoleucine, L-Leucine, and L-Tyrosine, were positively correlated with the module of MEturquoise, while Salicylic acid, arbutin, dicumarol, genistin, stevioside, and amarogentin were negatively correlated with the module of MEturquoise (Fig. 4a). The correlated analysis between bitter metabolites and transcription factors showed that the family of bHLH and HB- (including HB-BELL, HB-HD-Zip, HB-KNOX, HB-WOX, and HB-others) has large genes correlated with bitter metabolites, indicating that bHLH and HB- transcription factor families might play pivotal roles in regulating the biosynthesis or metabolism of bitter metabolites (Fig. 4b). To mine out the key genes in bHLH transcription factors, we did the network analysis of the bHLH transcription factor existing in MEturquoise (weight > 0.3) and sorted with degree values, and the results showed that Bo00073447 (bHLH) was a hub gene in the bHLH Co-expression Network (Fig. 4c) (Table S26). To mine out the key genes in HB- transcription factors, we do the network analysis of HB- transcription factors existing in MEturquoise (weight > 0.3) and sorted by degree values, and we find some key genes, Bo00029783(HB-HD-ZIP), Bo00006584(HB-HD-ZIP), Bo00043187(HB-KNOX), and Bo00010600 (HB-WOX) play roles in the HB- Co-expression Network (Fig. 4d) (Table S27).
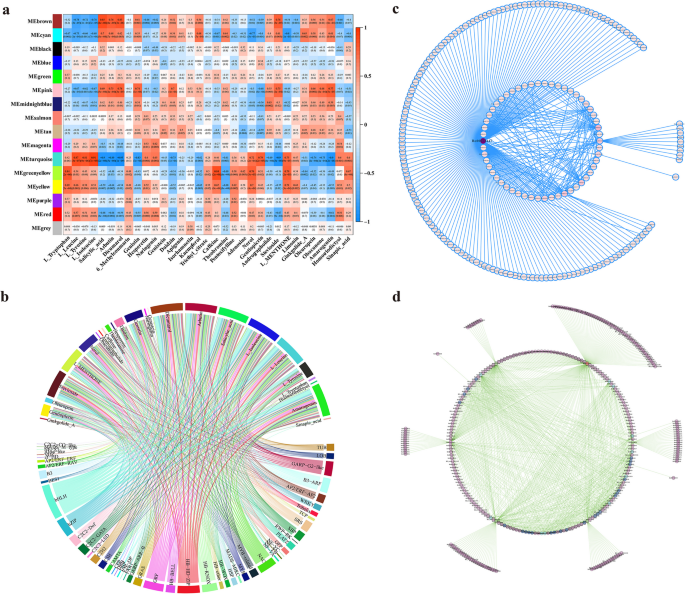
Weighted correlation network analysis and gene co-expression network between bitter metabolites and transcription factor families. a Weighted correlation network analysis (WGCNA) between bitter metabolites and expressed genes (FPKM ≥ 5). b Chord Diagram of the correlated relationship between bitter metabolites and transcription factors. c Gene Co-expression Network of bHLH transcription factors existed in the MEturquois module (weight > 0.3). d Gene Co-expression Network of HB- transcription factors existed in the MEturquois module (weight > 0.3)
Model of bitter flavor formation in the shoot of B. oldhamii
From the above joint analysis between bitter metabolites and transcription factors, we found that the expression of bHLH and HB- transcription factors was relevant to the accumulation of bitter metabolites might play roles in the biosynthesis and metabolic pathways of bitter metabolites. In this research, combined with our previous research [15], the mined bitter chemicals were searched against the KEGG pathway database, the bitter metabolites related pathways in each class were simplified and merged with flavonoids, amino acids, terpenoids, purine, solanidine, and hydrogen cyanide pathways (Fig. S17). The flavonoid bitter metabolites (Naringenin, Genistein, Genistin, Daidzin, Apigenin, Kaempferol, and Hesperetin) and other researched metabolites (Salicylate, Salicin, Arbutin, Amygdalin [15], Sinapic acid) are merged in the flavonoid-related pathway originally synthesized from bitter amino acid L-Phenylalanine (Fig. S17a). The bitter amino acids (L-Isoleucine, L-Leucine, L-Tryptophan, and L-Tyrosine) and arginine [15] merged in the amino acid biosynthesis and metabolic pathways (Fig. S17b). The terpenoid metabolites (Limonin, Ginkgolide A, Oleuropein, Nerol, Stevioside, Menthone, and Gentiopicrin) were merged in the terpenoid pathway originating from terpenoid backbone biosynthesis (Fig. S17c). Purine bitter metabolites (Caffeine, Theobromine, and Adenosine) and hypoxanthine [15] were merged in the Purine metabolism pathway (Fig. S17d). Solanidine and Amygdalin were detected in our previous research [15] were merged in the abbreviated biosynthesis of various alkaloids pathway (Fig. S17e) and the abbreviated cyanoamino acid metabolism pathway (Fig. S17f). Amygdalin is a kind of cyanogenic glucoside, but the majority of academics regard taxiphyllin as the major cyanogenic glucoside that exists in the edible bamboo shoot tip [57] and is easily decomposed to hydrogen cyanide (HCN), which causes a bitter flavor. The bitter amino acids (phenylalanine, tyrosine, isoleucine, leucine, and valine) were substances for the biosynthesis of cyanogenic glucosides(Fig. S17f) in plants [12]. We consider that there are several kinds of cyanogenic glucosides that exist in the bamboo shoot, causing the bitter flavor transition, not just one kind of cyanogenic glucoside.
From the above analysis, we hypothesize a simple model about this research (Fig. 5a). In an appropriate environment, when the shoot of B. oldhamii grown out of the soil surface and accepted sunlight signals for days, the expression of bHLH and HB- transcription factors were activated or repressed which influence the genes’ expression in the related pathways (such as, Circadian rhythm; Plant hormone signal transduction; Phenylpropanoid biosynthesis; Flavonoid biosynthesis; Flavone and flavonol biosynthesis; and others) to determine the content accumulation variation of bitter metabolites (such as, flavonoids; amino acids; terpenoids; Purines and derivatives; Cyanogenic glycosides; and others), and finally causing the bitter flavor formation or transition in the tip shoot of B. oldhamii (Fig. 5a). There were exist diversity bamboo species in the world, and the bamboo forests have diverse usages, such as edible shoots collection, bamboo timber collection, city or road ornamental, germplasm preservation, soil improvement, nature reserve, and others. Multiple bamboo species and forests were used to produce edible shoots, which could be sold as fresh shoots or used to make processed food (Picked shoots, Salted shoots, Boiled shoots, Soused shoots, Canned shoots, Dried shoots) (Fig. 5b). The majority of bamboo forests were used for ecosystem balance and bamboo timber, such as bamboo weaving, bamboo charcoal, disposable tableware, bamboo fiber clothes, bamboo timber architecture, bamboo flooring, and bamboo crafts (Fig. 5c). This research was focused on the bamboo species of B. oldhamii, which is especially distributed in the southeast of China, and the shoots that emerged in summer are mainly used as an edible shoot locally. The hypothetical model about the bitter flavor formation or transition in the tip shoot is based on the Multi-omics data in B. oldhamii, which needs to be verified with deep research. Bamboo has a variety of species, and the shoot shape, color, taste, and properties of various bamboo species were different, and the edible portion or part was different depending on the bamboo species. Each bamboo species has its unique flavor and taste; the flavor formation or transition in the edible shoot of other bamboo species still needs further research.
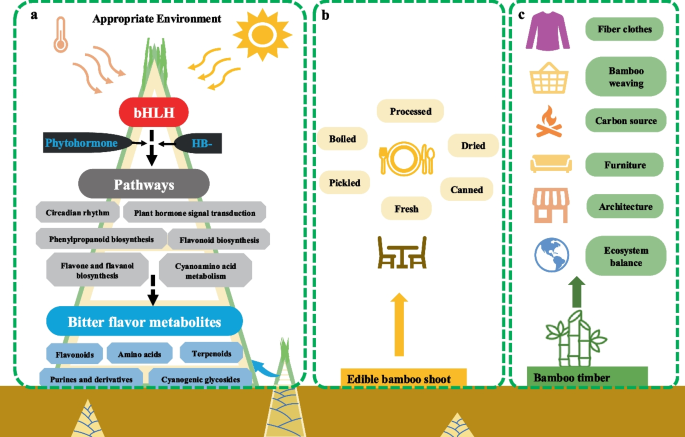
A hypothetical model of bitter metabolites formation, and the usages of edible bamboo shoot and timber in B. oldhamii. a The hypothetical model of bitter flavor metabolites formation in the shoot tip of B. oldhamii. b The traditional uses of edible bamboo shoots. c The traditional usages of bamboo timber