Shafali Verma’s record-breaking knock
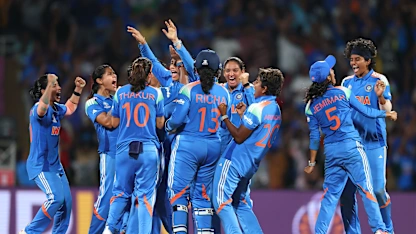
Deemed the Aramco Player of the Match in the final, Shafali Verma smashed 87 off 79 balls in the final, setting a new record for the highest score by an Indian opener in a World Cup final. The previous best…
Deemed the Aramco Player of the Match in the final, Shafali Verma smashed 87 off 79 balls in the final, setting a new record for the highest score by an Indian opener in a World Cup final. The previous best…