
25 July 2025
- Euro area net saving decreased to €799 billion in four quarters to first quarter of 2025, compared with €813 billion one quarter earlier
- Household debt-to-income ratio decreased to 81.7% in first quarter of 2025 from 83.8% one year earlier
- Non-financial corporations’ debt-to-GDP ratio (consolidated measure) decreased to 67.2% in first quarter of 2025 from 68.4% one year earlier
- Share of net wealth held by wealthiest 10% of households stood at 57.3% in 2024, largely unchanged from previous years.
Total euro area economy
Euro area net saving decreased to €799 billion (6.5% of euro area net disposable income) in the four quarters to the first quarter of 2025 compared with €813 billion in the four quarters to the previous quarter. Euro area net non-financial investment was broadly unchanged at €441 billion (3.6% of net disposable income), due to broadly unchanged net investment of all sectors (see Chart 1 and Table 1 in the Annex).
Euro area net lending to the rest of the world decreased to €388 billion (from €401 billion previously) reflecting the decreased net saving and broadly unchanged net non-financial investment. Non-financial corporations’ net lending decreased to €130 billion (1.1% of net disposable income) from €156 billion, while that of households increased to €598 billion (4.9% of net disposable income) from €588 billion. Financial corporations’ net lending (€123 billion, 1.0% of net disposable income) and general government net borrowing were broadly unchanged, the latter contributing negatively to euro area net lending (-€463 billion, -3.8% of net disposable income).
Chart 1
Euro area saving, investment and net lending to the rest of the world
(EUR billions, four-quarter sums)
Sources: ECB and Eurostat.
* Net saving minus net capital transfers to the rest of the world (equals change in net worth due to transactions).
Data for euro area saving, investment and net lending to the rest of the world (Chart 1)
Households
Household financial investment increased at a broadly unchanged annual rate of 2.5% in the first quarter of 2025. Among its components, investment in currency and deposits grew at an unchanged rate of 3.0%. Investment in debt securities increased at a lower rate (3.0%, after 8.2%), while investment in shares and other equity grew at a higher rate (2.3%, after 1.8%) – the latter mainly due to investment fund shares.
Households purchased, in net terms, mainly debt securities issued by the rest of the world, general government, and other financial institutions (see Table 1 below and Table 2.2. in the Annex). Households were overall net sellers of listed shares, selling predominantly listed shares of MFIs, while buying listed shares issued by the rest of the world (i.e. shares issued by non-euro area residents). Households increased their purchases of euro area non-money market investment fund shares, and continued to purchase money market fund shares, while purchases of investment fund shares issued by the rest of the world decelerated.
The household debt-to-income ratio[1] decreased, to 81.7% in the first quarter of 2025 from 83.8% in the first quarter of 2024. The household debt-to-GDP ratio decreased, to 51.2% in the first quarter of 2025 from 52.3% in the first quarter of 2024 (see Chart 2).
Table 1
Financial investment and financing of households, main items
(annual growth rates)
|
Financial transactions |
|||||
|
2024 Q1 |
2024 Q2 |
2024 Q3 |
2024 Q4 |
2025 Q1 |
|
|
Financial investment* |
2.0 |
2.3 |
2.4 |
2.4 |
2.5 |
|
Currency and deposits |
1.5 |
2.3 |
2.5 |
3.0 |
3.0 |
|
Debt securities |
41.4 |
29.8 |
17.1 |
8.2 |
3.0 |
|
Shares and other equity** |
0.2 |
0.4 |
0.9 |
1.8 |
2.3 |
|
Life insurance |
0.0 |
0.4 |
1.3 |
1.6 |
1.7 |
|
Pension schemes |
2.0 |
1.8 |
1.9 |
1.8 |
2.1 |
|
Financing*** |
0.9 |
1.2 |
1.2 |
1.6 |
1.8 |
|
Loans |
0.6 |
0.6 |
0.9 |
1.3 |
1.7 |
Source: ECB.
* Items not shown include: loans granted, prepayments of insurance premiums and reserves for outstanding claims and other accounts receivable.
** Includes investment fund shares.
*** Items not shown include: financial derivatives’ net liabilities, pension schemes and other accounts payable.
Data for financial investment and financing of households (Table 1)
Chart 2
Debt ratios of households and NFCs
(percentages of GDP)
Sources: ECB and Eurostat. * Outstanding amount of loans, debt securities, trade credits and pension scheme liabilities. 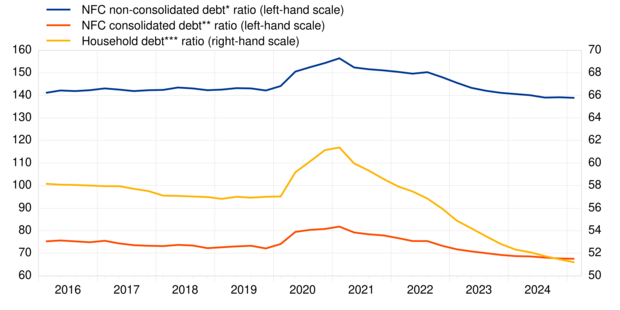
** Outstanding amount of loans and debt securities, excluding debt positions between NFCs
*** Outstanding amount of loan liabilities.
Data for debt ratios of households and non-financial corporations (Chart 2)
Developments in household wealth distribution in 2024
The Distributional Wealth Accounts show that household net wealth continued to increase in 2024, while wealth inequality, as measured by the Gini coefficient of net wealth, has remained broadly unchanged in recent years (see Chart 3). The share of household net wealth held by the wealthiest 10% of households stood at 57.3% at the end of 2024, largely unchanged from previous years.
Chart 3
Household net wealth distribution and wealth inequality
(left-hand scale: EUR trillions; right-hand scale: percentages)
Sources: ECB.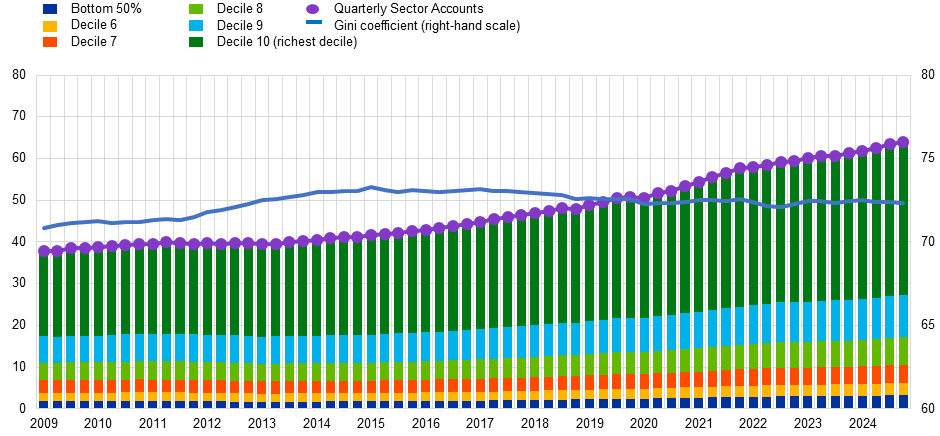
The growth in net wealth across the various household wealth groups was primarily driven by valuation effects of both financial and non-financial assets, while contribution of net saving was stable but lower. Since the fourth quarter of 2019, net wealth has risen substantially across all wealth groups, with increases of 32% for the bottom 50% of the wealth distribution, 24% for the next 40%, and 26% for the top 10%. The developments varied between different asset classes, resulting in distinct portfolio dynamics across household wealth groups (see Chart 4). A significant portion of overall net wealth growth – more than half in each wealth group – was driven by increases in housing wealth. For the bottom 50% of households, deposits were the second-largest contributor (+9 percentage points), with smaller contributions from other wealth components. Among the next 40% of households, deposits also made a positive contribution (+4 percentage points) to net wealth growth, though this was largely offset by the negative effect of increasing mortgages (-3 percentage points). For the wealthiest 10% of households, the growth in net wealth was also supported by significant increases in business wealth (+6 percentage points) and investment fund shares (+3 percentage points).
Chart 4
Contributions to growth of household net wealth between Q1 2019 and Q4 2024
(percentage points, percentage change)
Sources: ECB. Note: The left-hand scale measures the percentage growth of net wealth and the percentage point contributions to net wealth growth of all other legend items.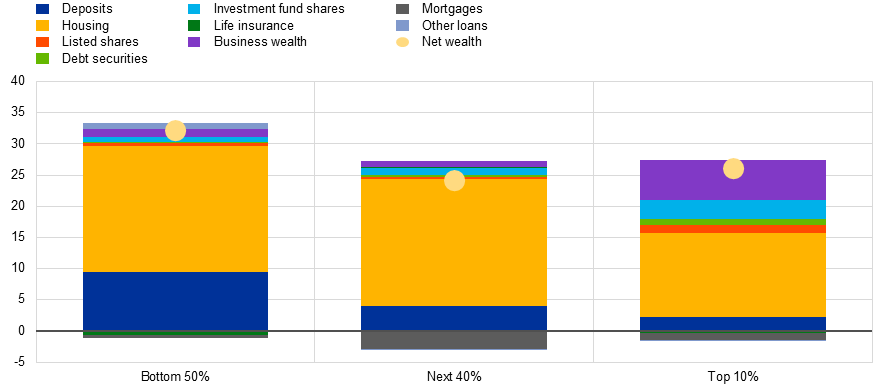
Non-financial corporations
Financing of NFCs increased at a higher annual rate of 1.3% in the first quarter of 2025 (after 0.9% in the previous quarter). This was the result of an acceleration in financing by loans (2.0% after 1.3%) and trade credits (4.1% after 3.6%), while the financing via the issuance of debt securities and of equity grew at broadly unchanged rates (see Table 2).The acceleration in loan financing is mainly due to loans granted by MFIs (2.6% after 1.6%, see Table 3.2 in the Annex), by the rest of the world (1.6% after -0.2%), and by other financial institutions (-0.5% after -2.5%).
NFCs’ debt-to-GDP ratio (consolidated measure) decreased to 67.2% in the first quarter of 2025, from 68.4% first quarter of 2024; the non-consolidated, wider debt measure decreased to 138.9% from 140.6% (see Chart 2).
Table 2
Financing and financial investment of NFCs, main items
(annual growth rates)
|
Financial transactions |
|||||
|
2024 Q1 |
2024 Q2 |
2024 Q3 |
2024 Q4 |
2025 Q1 |
|
|
Financing* |
0.8 |
0.9 |
1.0 |
0.9 |
1.3 |
|
Debt securities |
2.0 |
2.9 |
2.5 |
1.5 |
1.6 |
|
Loans |
1.6 |
1.4 |
1.4 |
1.3 |
2.0 |
|
Shares and other equity |
0.3 |
0.6 |
0.6 |
0.4 |
0.5 |
|
Trade credits and advances |
1.0 |
2.0 |
2.5 |
3.6 |
4.1 |
|
Financial investment** |
1.7 |
1.8 |
2.0 |
1.8 |
2.0 |
|
Currency and deposits |
0.2 |
2.6 |
1.7 |
2.4 |
2.1 |
|
Debt securities |
10.9 |
8.1 |
3.9 |
2.1 |
4.1 |
|
Loans |
3.9 |
3.7 |
3.2 |
2.6 |
2.8 |
|
Shares and other equity |
1.1 |
0.9 |
1.2 |
0.7 |
0.4 |
Source: ECB.
* Items not shown include: pension schemes, other accounts payable, financial derivatives’ net liabilities and deposits.
** Items not shown include: other accounts receivable and prepayments of insurance premiums and reserves for outstanding claims.
Data for financial investment and financing of non-financial corporations (Table 2)
For queries, please use the statistical information request form.
Notes
- These data come from a second release of quarterly euro area sector accounts for the first quarter of 2025 by the ECB and Eurostat, the statistical office of the European Union. This release incorporates revisions and completed data for all sectors compared with the first release on “Euro area households and non-financial corporations” of 3 July 2025.
- The euro area and national financial accounts data of NFCs and households are available in an interactive dashboard.
- The debt-to-GDP (or debt-to-income) ratios are calculated as the outstanding amount of debt in the reference quarter divided by the sum of GDP (or income) in the four quarters up to the reference quarter. The ratio of non-financial transactions (e.g. savings) as a percentage of income or GDP is calculated as the sum of the four quarters up to the reference quarter for both numerator and denominator.
- The annual growth rate of non-financial transactions and of outstanding assets and liabilities (stocks) is calculated as the percentage change between the value for a given quarter and that value recorded four quarters earlier. The annual growth rates used for financial transactions refer to the total value of transactions during the year in relation to the outstanding stock a year before.
- Hyperlinks in the main body of the statistical release lead to data that may change with subsequent releases as a result of revisions. Figures shown in annex tables are a snapshot of the data as at the time of the current release.
- The release of results of experimental Distributional Wealth Accounts (DWA) for the first quarter of 2025 is planned for 29 August 2025 (tentative date).