Quick overview
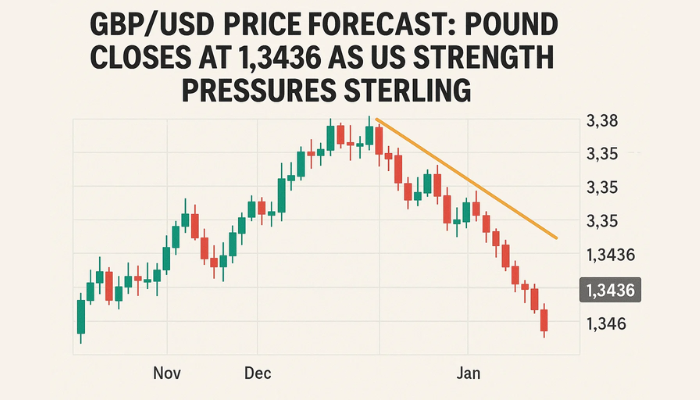
- The pound closed the week at 1.3436 against the dollar, influenced by strong US economic data and weak UK retail performance.
- UK retail sales showed a modest rebound but fell short of expectations, putting pressure on consumer spending and the Bank of England’s rate hike strategy.
- Technically, GBP/USD is in a bearish trend with key support at 1.3416, and a break below this level could lead to further declines.
- Despite current weakness, the overall outlook for GBP/USD remains bullish as long as it stays above the critical support level of 1.3320.
The pound finished the week at 1.3436 against the dollar, breaking below key support as US data was strong and UK retail was weak. Here’s what to expect this week.
UK Retail Woes and US Economic Resilience Weigh on GBP/USD
GBP/USD ended Friday at 1.3436, down for the second week in a row as the macro gap between the US and UK widens. Investors are still favouring the dollar, thanks to good jobless claims, core durable goods and stronger than expected earnings – all of which give the Fed room to delay rate cuts.
Meanwhile the UK economy is struggling with mixed signals. June retail sales was a modest rebound but softer than expected. Consumer spending – the key driver of UK GDP – is under pressure from high borrowing costs and sticky inflation in essentials. This undermines confidence in the BoE’s ability to support the pound through rate hikes alone.
With the Fed patient and the BoE struggling the macro backdrop is still dollar positive and the pound is vulnerable to further downside.
EUR/USD Technical Outlook: RSI Oversold, But Bears Still in Control
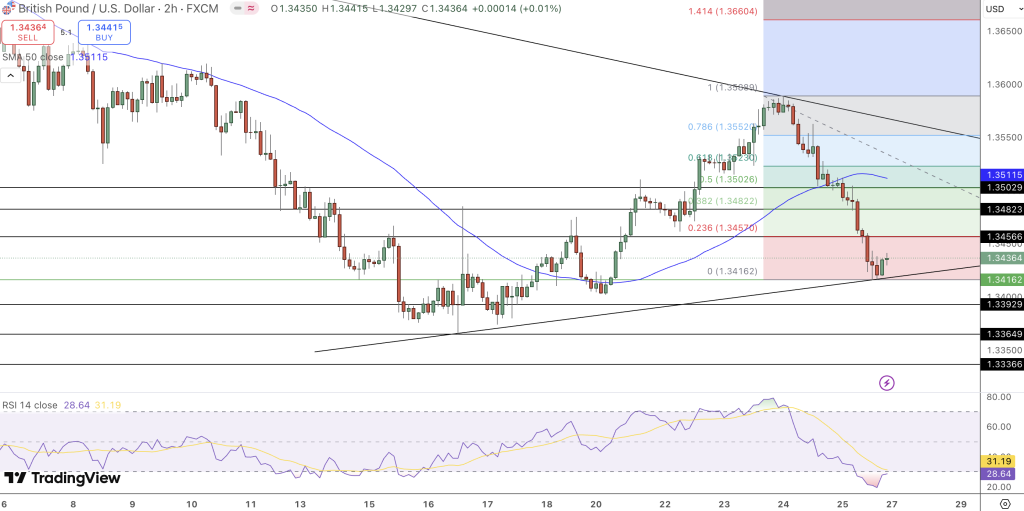
Technically the GBP/USD forecast is fragile. The pair is inside a well defined falling channel and has rejected the upper band at 1.3590 earlier last week. Price action printed a “three black crows” candlestick formation – three consecutive long bodied bearish candles – which signals strong downside momentum and a potential trend reversal from the recent rally.
The pair broke below the 50 period EMA at 1.3511 and closed below the 23.6% Fibonacci retracement at 1.3457 further confirming short term bearish pressure. Momentum is stretched with the RSI at 28.6, a deeply oversold condition but no bullish divergence has emerged yet.
Interestingly price action found support at 1.3416 which is both the 0% Fib retracement and a historical support level. A long lower wick on Friday’s candle suggests some buying interest – potentially the early signs of a reversal.
GBP/USD Price Forecast: Key Levels and Trade Setup for the Week
Look for 1.3416 to be the level to watch. If the bulls can hold this area and form a bullish reversal pattern such as a hammer, morning star or bullish engulfing it could trigger a short covering rally. A break above 1.3482 – the 38.2% Fib and minor resistance – could open up 1.3502 and 1.3552 where the falling channel resistance and 61.8% Fib align.
But if the pair breaks 1.3416 downside risks accelerate with 1.3365 the next support and then 1.3320 the 100 day SMA and June 23 swing low and broader trendline support from the March uptrend.
Despite short term weakness the overall outlook for GBP/USD is still bullish as long as price is above 1.3320 the last major higher low. A deeper drop below this area would invalidate the trend and change sentiment.
Arslan Butt
Lead Markets Analyst – Multi-Asset (FX, Commodities, Crypto)
Arslan Butt serves as the Lead Commodities and Indices Analyst, bringing a wealth of expertise to the field. With an MBA in Behavioral Finance and active progress towards a Ph.D., Arslan possesses a deep understanding of market dynamics.
His professional journey includes a significant role as a senior analyst at a leading brokerage firm, complementing his extensive experience as a market analyst and day trader. Adept in educating others, Arslan has a commendable track record as an instructor and public speaker.
His incisive analyses, particularly within the realms of cryptocurrency and forex markets, are showcased across esteemed financial publications such as ForexCrunch, InsideBitcoins, and EconomyWatch, solidifying his reputation in the financial community.
Related Articles