Banks have differing commitments and targets when it comes to climate change and environmental issues, providing financing and loans for industries varying from fossil fuels to renewable energy.
In Australia, some banks and super funds have been linked to mass deforestation and fossil fuel investments, while others have been criticised for their investments in nuclear weapons manufacturers.
Sign up: AU Breaking News email
Globally, banks boosted their financing for fossil fuel companies last year, and none of the world’s largest banks have committed to stop funding new oil and gas fields or coal capacity.
But 76% of Australians now want their super funds and banks to make a formal commitment to zero emissions by 2050, while 88% expect their deposits to be invested ethically, according to the Responsible Investment Association Australasia (RIAA).
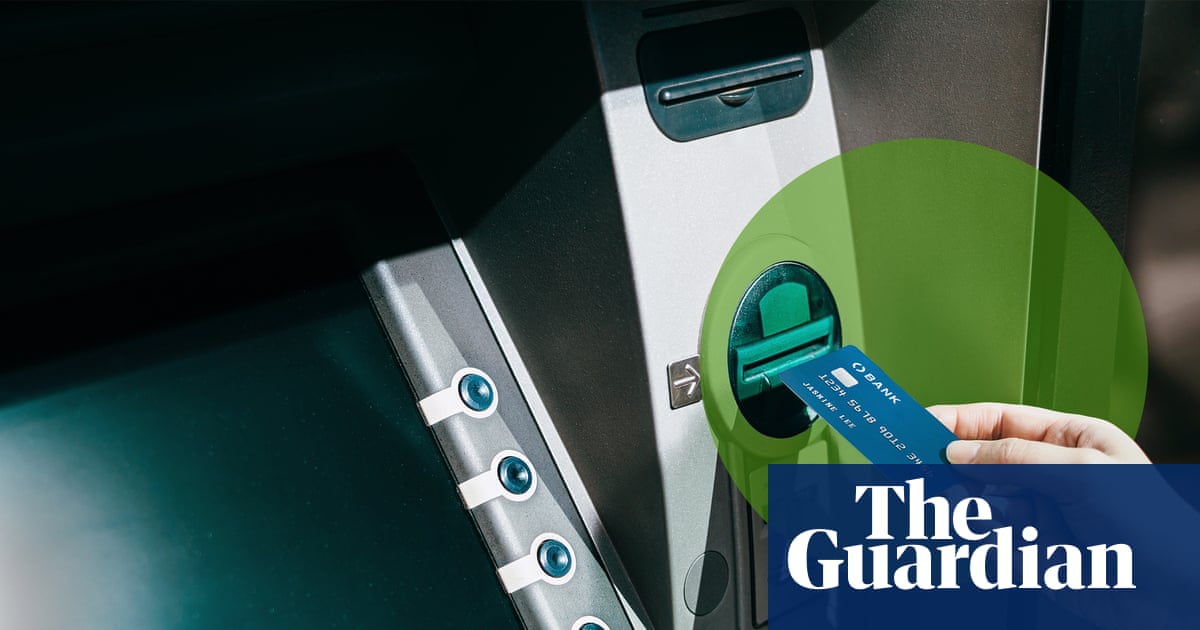
As individuals, we can choose to bank according to our values – here’s how to put your money where it can do some good.
Which banks are changing their practices, and how do you track them?
Morgan Pickett, policy analyst and campaigner for Market Forces, says major banks play a major role in shaping the economy, and they now need to listen to the majority of Australians who want their money directed towards renewable energy.
“Major Australian banks and super funds are responding to growing public appetite by slashing funding for fossil fuels, and pressuring coal and gas companies. Many super funds are voting against company directors at major Australian fossil fuel companies but a groundswell of members are demanding faster climate action,” he says.
Australia’s biggest bank, Commonwealth Bank, has announced it will stop loaning to fossil fuel companies without transition plans in line with the Paris Agreement goal of limiting warming to 1.5C. Westpac has also closed funding to thermal coalmines, which have often relied on banks for financing.
Although Australia’s banks rarely make public comments on their clients, including the divestment decisions, Pickett says the most effective way to exert pressure is to contact your bank or super fund directly and tell them you are not happy with their investments and will shift your money unless they change their practices.
“It’s hard to sift through the bank and super fund spin,” Pickett says. “If people move their money on climate grounds, it’s vital that they tell their bank or super fund that this is the reason, otherwise they won’t know.”
Market Forces has created a comprehensive comparison tool that allows you to compare your bank’s investments against others, and to contact them if you’re unhappy.
“The financial industry needs to listen closely,” says Estelle Parker, co-CEO of the RIAA. “There’s a clear market for responsible investment products, but consumers need to be confident their money is truly aligned with their values. Addressing greenwashing concerns and offering a wider range of responsible options is critical.”
What about super?
Australia’s superannuation sector is worth more than A$4.2tn and will soon be the second largest pension pool globally. According to Margaret Beavis from Quit Nukes, an initiative of the Medical Association for Prevention of War, reducing the flow of capital to nuclear weapons manufacturers is an integral part of progress towards the abolition of nuclear weapons.
A 2024 report by Quit Nukes and the Australia Institute found all but one of the 14 major super funds – the exception being Hostplus – failed to exclude investments in nuclear weapons companies from their MySuper portfolios.
“We continue to meet with super funds about excluding nuclear weapons companies from their portfolios,” Beavis says, noting that Vanguard Super and Australian Super recently took the step of removing nuclear weapons from their investment portfolios.
Beavis says banks and super funds need to recognise and take into account the future overall costs to people beyond financial return. However, according to Market Forces’ Superannuation Climate Wreckers Index report, 30 of Australia’s largest super funds have more than doubled their fossil fuel investments to more than $39bn over the past two years.
“Climate change will have terrible consequences for generations with disasters and loss of so many ecosystems and species. Similarly funding weapons – particularly indiscriminate and inhumane ‘controversial’ weapons like nuclear weapons – builds in massive risk of appalling harm to current and future generations,” Beavis says. “As a society we are all impacted, and generations to come will curse us for our negligence.”
Is there any such thing as a truly ethical bank?
Jonathan Moylan from the Australian Conservation Foundation says the influence of the financial sector on the future liveability of the planet can’t be overstated.
“The consequences of climate change on the insurability of properties in disaster-prone regions or fisheries affected by algal blooms will shape the kind of world we live in in decades to come, but the solutions are clear – we need to roughly triple investment in solutions like wind, solar, green metals and transport, halt further expansion of coal and gas, and end deforestation.”
Moylan says Australian banks have provided over $23bn to fossil fuel industries over the past decade, but that tide is shifting and as a direct result of public pressure, major Australian banks are now changing their practices.
Over the last three financial years, Australia’s big four banks have cut lending to fossil fuel extraction, production and power by $9.96bn, according to recent analysis from Market Forces.
“Switching banks can help send a message to the big banks to change, but it only works if they know why, by contacting the bank directly, speaking out publicly, or joining a campaign,” Moylan says. “Ethical banking can help – but ultimately we need to move the whole system, and that takes people power.”