Study design
This retrospective cohort recruited 776 patients hospitalized in three tertiary teaching hospitals in Shiraz, Iran, from March to September 2020. We included hospitalized adult patients with COVID-19 confirmed by positive results of real-time RT-PCR from nasopharyngeal oropharyngeal swabs and underwent at least one chest CT imaging without any contrast agents. The patients below 18 years of age and those who lacked positive PCR results or did not undergo chest CT at the initial stage of their hospital admission were excluded. Applying the eligibility criteria, we excluded 87 patients due to a lack of positive PCR report and 123 due to a lack of chest CT or assessable CT imaging. Hence, a total number of 566 patients were included in this study. Afterward, the study population was divided into two groups based on in-hospital mortality status: survivors and nonsurvivors.
All the patients underwent initial laboratory testing such as CBC, coagulation markers, and kidney and liver function tests. Patients at each center received treatment and managed based on a similar national guideline released by Iran’s Ministry of Health and Medical Education (DTFC: Diagnostic Therapeutic Flowchart for COVID-19) [17]. Indications for ICU admission, mechanical ventilation use, and discharging criteria have been described in guideline [17].
Variables
This study collected data on three domains of patients’ demographic features, initial clinical manifestations, disease outcomes, and radiologic findings. Clinically relevant variables included sex, fever, dry cough, dyspnea, admission to intensive care units, and mortality status. Regarding laboratory variables, leukopenia was defined as WBC count < 4.0 × 10⁹ per liter, thrombocytopenia as PLT count < 150 × 109 per liter, and lymphocytopenia as lymphocyte count < 1.5 × 10⁹ per liter. Reviewing CT images, we recorded radiologic findings, including crazy paving pattern, halo sign, reversed halo sign, air bronchogram, pleural effusion, GGO/consolidation, and mediastinal lymphadenopathy (Fig. 1).
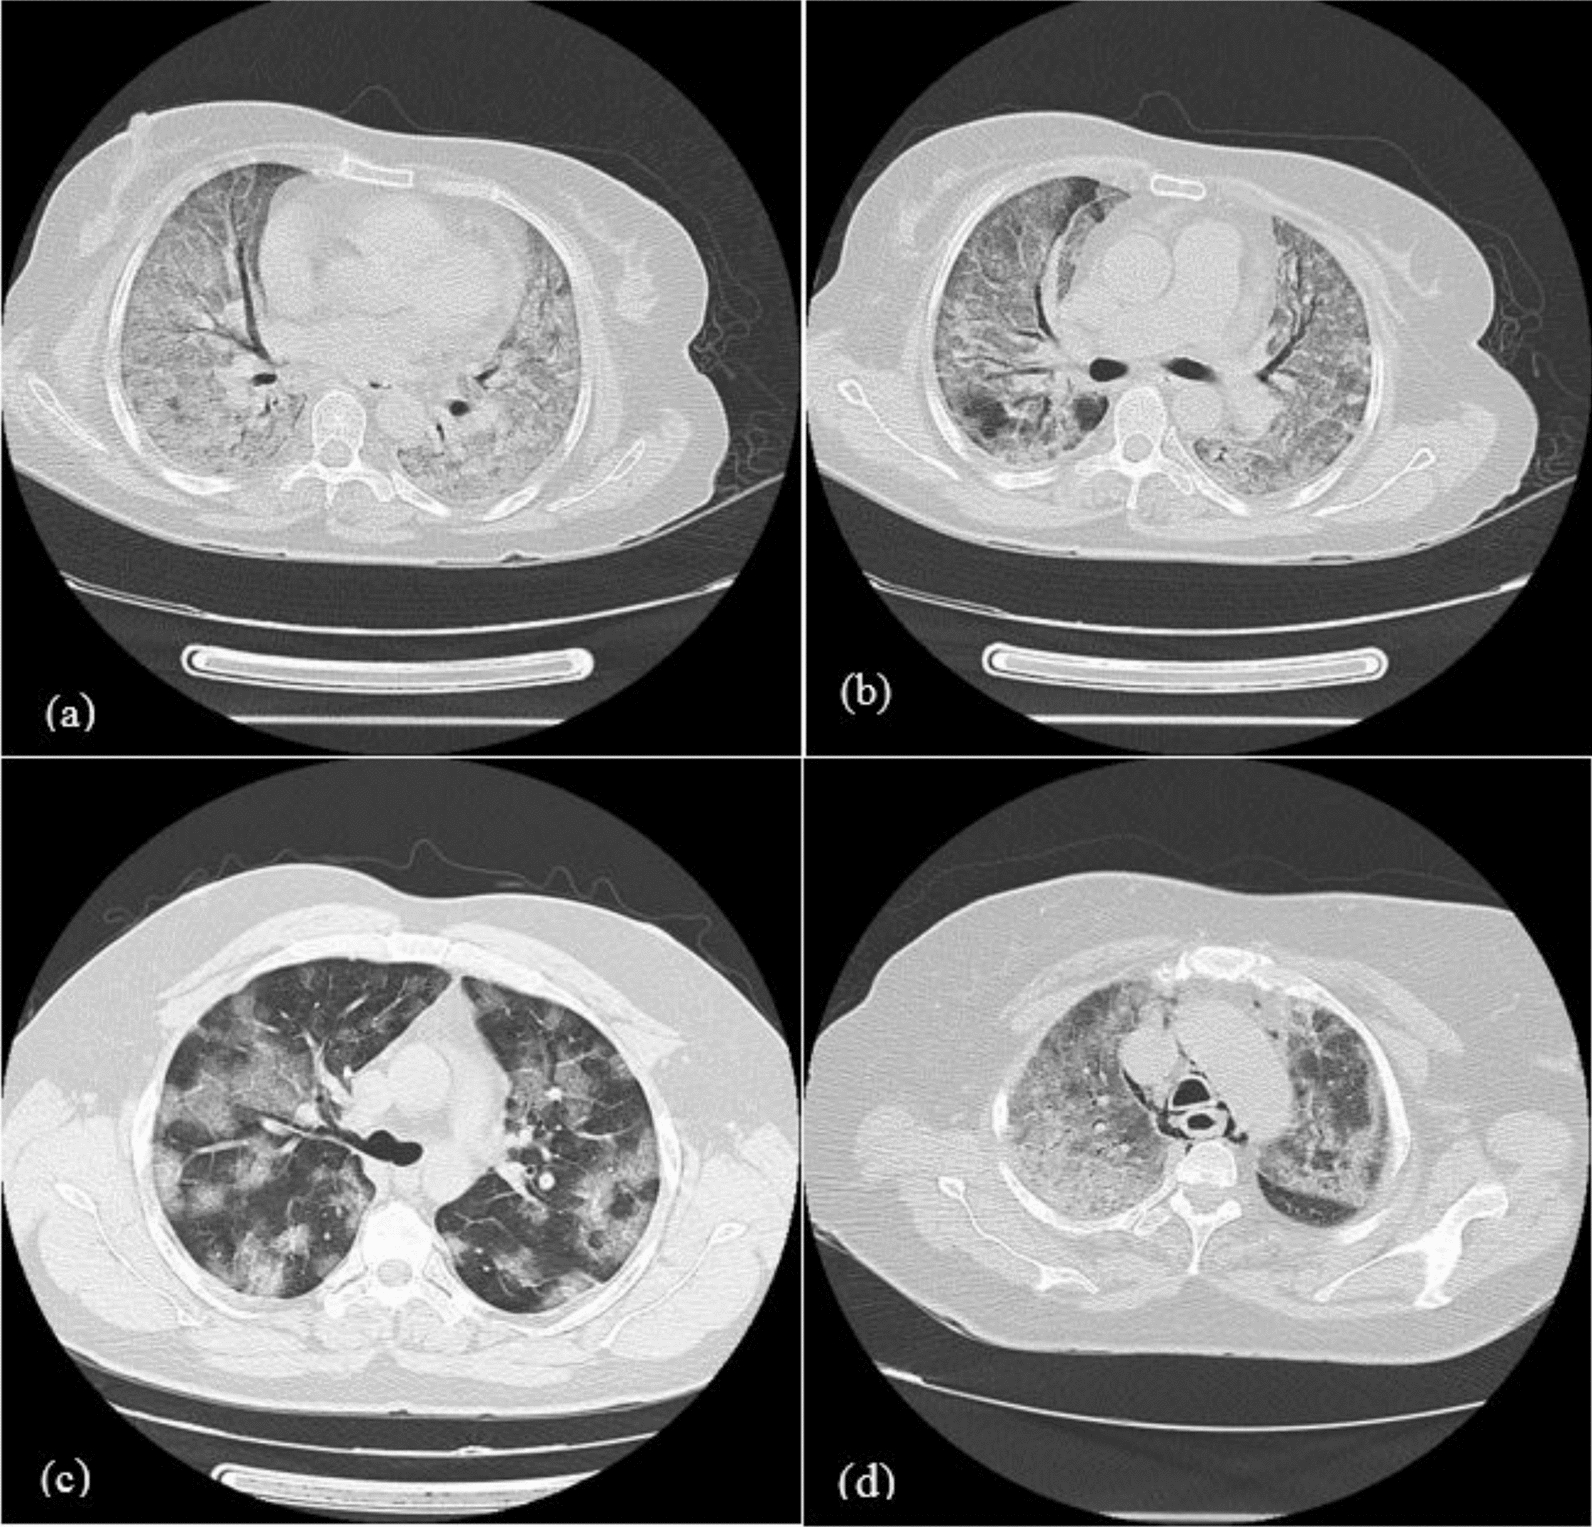
Several radiologic patterns of COVID-19: a, b Diffuse ground-glass opacity (GGO) with some areas of consolidations and associated air bronchogram, c Multiple patches of GGO with crazy paving appearance, d Diffuse GGO and consolidation associated with pneumomediastinum
Validation of visual severity scores
We searched the electronic database using the keywords of “prognostic modeling,” AND “COVID-19,” AND “CT findings”. We reviewed 13 related papers with the development of a prognostic model identifying COVID-19 patients at high risk of mortality. Then, three articles were chosen based on sample size, methodology, and their proposed prognostic models. Upon quality assessment of the radiologic-based scoring component of these selected models, three CT severity scoring systems [12,13,14] were finally selected to be validated in this study, and their respective variables were investigated. Table 1 summarizes the details about the function and interpretation of the selected radiologic models. All the patients were evaluated by three prognosis-predictive models of COVID-19. We extend our analyses to propose the most fitting model according to results obtained from our study population (Table 1).
The data required to validate selected prognostic models include patients’ demographic features, clinical history, laboratory results, and radiologic findings. All data were registered in patients’ medical records at the hospital admission course. Also, these patients received the necessary medical treatment and supportive care during their hospitalization course. The review of the selected articles clarified three systems of radiologic severity scoring as follows:
-
15-Score model Wang et al. [13] introduced a prognostic model with a maximum score of 15
-
20-Score model Tabatabaei et al. [14] defined a CT-based predictive model with a sum score ranging from 0 to 20
-
24-Score model Zheng et al. [12] introduced a prognostic nomogram based on clinical and CT features with a sum score ranging from 0 to 24
CT-scan acquisition
All the patients underwent chest CT-scan without contrast injection with a single inspiratory phase while holding their breath. The acquisition of images in all centers was conducted in the supine position of the patients using a multidetector 16-section scanner (GE Medical Systems, Milwaukee, WI, USA). The tube voltage was set at 120 kV for all scans. The CT images included the whole extent of the chest and the upper portion of the abdomen. The CT apparatus photographed the images with a 1.25–2-mm thickness and intervals of 1.25 mm.
The patients’ CT images were reviewed and analyzed by a certified expert radiologist (with more than 15 years of experience) blinded to the disease outcomes, clinical presentations, demographic features, and laboratory profile. The radiologist stratified the severity of pulmonary involvement according to each scoring system, as explained in Table 1. Each scan was evaluated for GGO, consolidation, crazy paving, halo sign, reversed halo sign, air bronchogram, pleural effusion, and lymphadenopathy. The definition of these CT manifestations had been previously explained in Fleischner’s Glossary of Terms for Thoracic CT [18]. Further, the CT images were evaluated for changes in liver density as described previously [12,13,14]. We categorized opacification patterns into GGO, consolidation, and mixed GGO and consolidation. Also, mediastinal lymphadenopathy was considered when the axial diameter of lymph nodes exceeded 1 cm.
Statistical analysis
The data obtained were analyzed by SPSS v.24 software. All the qualitative data were presented in frequency and percentages. These categoric variables were compared between groups using the Chi-square test. On the other hand, quantitative data were presented in median (IQ2) due to non-normal distribution. These continuous variables were compared using a nonparametric Mann–Whitney U test. We compared the CT findings across the survivor and nonsurvivor groups using linear-by-linear association.
The external validation was performed using a logistic multivariate regression model. At this step, each radiologic severity scoring system was independently assessed with three variables of age, gender, and lymphocyte count by multivariate logistic regression model. Our statistical goal was to predict the mortality outcome (Y or dependent variable) based on predictor factors (X or independent variables). Four variables were chosen to build a multivariable prediction curve to avoid overfitting bias. It means that the independent variables should minimally show inter-dependence on each other. We conducted a correlation analysis between the predictors to avoid multicollinearity in the regression model. The correlation for each pair of these four variables was separately calculated before including them in the logistic regression model. Finally, to identify the COVID-19 patients with a high risk of mortality in the most accurate fashion, we conducted ROC analysis to determine the most optimal system of radiologic severity scoring. A significance was considered when P < 0.05 for all the analytic tests.