Bacterial isolates and growth conditions
Forty-one MDR A. baumannii clinical isolates were obtained from sputum and respiratory secretions of hospitalized patients in Egypt. These isolates were provided by Mabaret Elasafra clinical microbiology laboratory serving multiple hospitals in Alexandria, Egypt, between August 2020 and April 2021, where they had been pre-identified and characterized, with species-level identification conducted using the VITEK2 Compact system (bioMérieux, Marcy-l’Étoile, France). The presence of carbapenemase-encoding genes was further confirmed by PCR with specific primers [34].
The collected bacterial isolates were sub-cultured on MacConkey agar (Oxoid, England), and they were preserved in tryptic soy broth (TSB; Merck, USA) supplemented with 25% glycerol for long-term storage at -80 °C.
Bacteriophage isolation and characterization
Isolation and purification of bacteriophages
The protocol described by Clokie and Kropinski (2009) was used for phage isolation with minor modifications [35]. The wastewater samples were centrifuged in a 50 ml centrifuge tube at 5,000 × g for 20 min at 4 °C. For enrichment, 5 ml supernatant of wastewater was transferred to a sterile centrifuge tube with an equal volume of the TSB 2X in a sterile flask with 100 µl of mixed culture (AB20, AB21, AB22, AB23, AB24, AB25, AB26, AB27, AB28, and AB29) of A. baumannii isolates for overnight in a shaking incubator at 37 °C. The enrichment was transferred to 50 ml centrifuge tube and centrifuged at 5,000 ×g for 20 min at 4 °C. The supernatant was filtered by a 0.45 μm syringe membrane filter (Membrane Solution, USA). Double agar overlay plaque assay was used to evaluate bacteriophage activity; an overnight bacterial culture was combined with molten soft nutrient agar with a concentration of 0.75% agar and poured onto a 1.5% agar plate. 10 µl of supernatant was dropped onto the plate and incubated overnight at 37°C [36].
The formed plaques were purified by picking the single plaques from the plate with a sterile pipette tip and transferred to sterile SM buffer (100 mM NaCl, 8 mM MgSO4 • 7H2O, 50 mM Tris-Cl; pH 7.5) to elute the phage overnight at 4°C [4]. The eluted phage was diluted tenfold in SM buffer to be spotted on the overlay of bacterial lawn to pick a single plaque, and this procedure was repeated seven times to ensure that a single phage type was isolated from the plaques. The isolated phages were amplified in small volumes (5 ml) by mixing TSB of log-phase bacterial culture 108 CFU/ml and 50 µl of isolated phages with titer 109 PFU/ml.
Host range assay
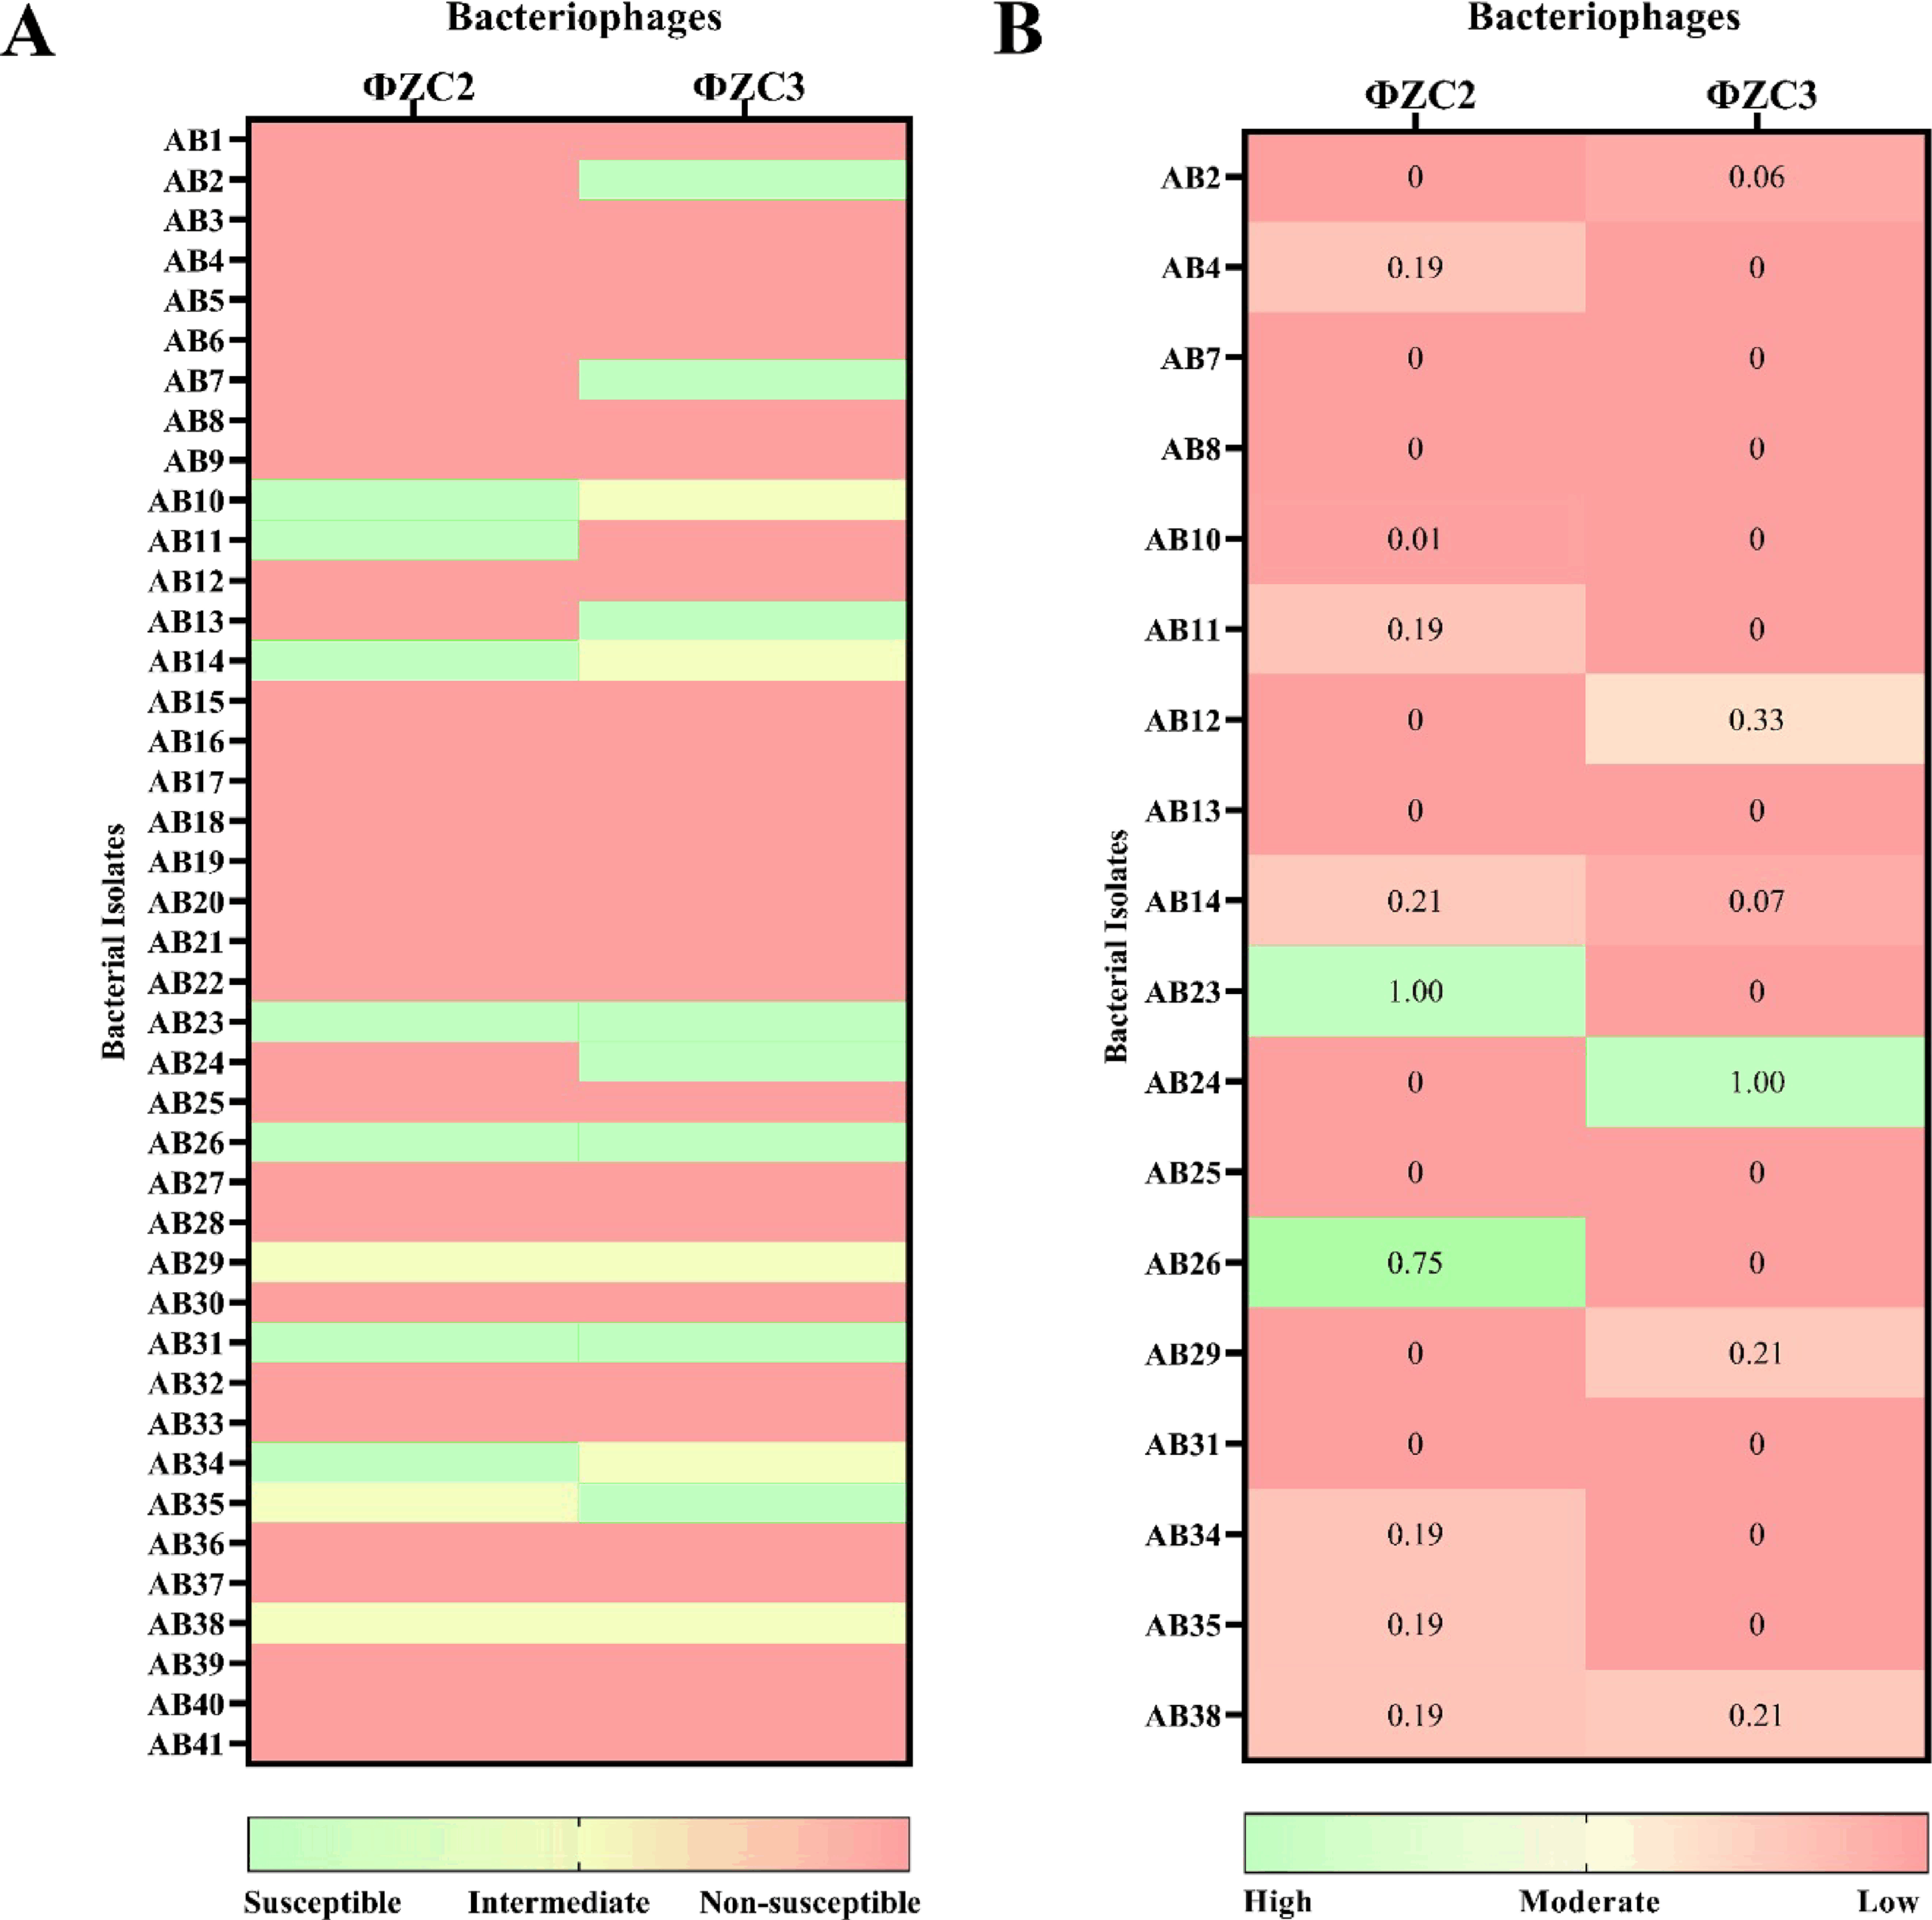
The phages’ host range was investigated using the spot assay method against forty-one MDR A. baumannii isolates, as previously described [37]. In brief, 10 µL of each phage lysate was added on overlays of bacterial lawns from each isolate and followed by overnight incubation at 37 °C. The phage lysis intensity to the host was assessed based on the clarity of the formed plaques. This assay was carried out in triplicate.
Relative efficiency of platting (EOP)
As detailed previously [27]the relative efficacy of plating (EOP) of the phages was determined by counting the number of clear lysis plaques formed after applying 10-fold successive dilutions of the phage onto freshly prepared lawns of each susceptible bacterial isolate. The spotting assay was performed on a double agar overlay, and the plaques were enumerated. The EOP was determined by calculating the ratio of the phage titer on each tested clinical isolate to the titer of host isolate. The EOP ratio was categorized into four levels based on defined quantitative thresholds. Isolates with EOP values ≥ 0.5 were classified as highly efficient. Moderate efficiency was assigned to isolates with 0.1 ≤ EOP < 0.5, while low efficiency corresponded to values in the range of 0.001 ≤ EOP < 0.1. Isolates with EOP values < 0.001 were considered inefficient or resistant.
Morphological characterization
The phages were serially diluted to obtain a plaques per plate, when plating 0.1 ml of the diluted stock. Dilutions were prepared in TSB, for plaque formation, 0.1 ml of bacterial culture was mixed with 3.0 ml of molten soft nutrient agar (0.75% agar), followed by the addition of 0.1 ml of the diluted phage. The mixture was poured onto a tryptic soy agar (TSA; Merck, USA) plate. Plates incubated at 37 °C for 18 h. Plaque formation was observed, with the potential for plaque lysis [38]. Plaque size measurement was measured by image j software.
The structure of phages was analyzed using transmission electron microscopy (TEM) in the Faculty of Science, University of Alexandria, Egypt. Initially, 10 µL of the phage, containing 1010 PFU/ml was stained with 2.5% uranyl acetate. Subsequently, the sample was attached to a carbon-coated Cu-grid and incubated for 10 min before being analyzed using TEM. The stained phage was imaged using a TEM (1230 JEOL, Tokyo, Japan). The captured images from a JEOL 1230 TEM were measured using ImageJ software version 1.53n [39].
Phage production by bioreactor
Phage production was carried out in the BioFlo 120 bioreactor = (Eppendorf, Germany), as previously described, with minor modification [40],1.6 L of TSB was autoclaved in a vessel (Borosilicate glass, 316 L stainless steel). The temperature was 37 °C, and pH 7 was optimized through two front-mounted fixed-speed pumps connected to NaOH and HCL bottles. A single colony of the A. baumannii host isolate was resuspended in 200 ml TSB and incubated at 37 °C for overnight culture. After cultivation, 200 ml of the overnight culture was subcultured.
in the bioreactor vessel. The bacterial culture was cultivated at 37 °C and 100 rpm for 4 h until reaching the early log phase (OD600 = 0.1). The multiplicity of infection (MOI) of 0.1 was achieved with 0.8 ml of phage (8 × 10⁹ PFU/ml) to the bioreactor vessel by syringe. The agitation was set to 100 rpm, and the gas flow was 2 barg for 5 h. Aliquots were collected in triplicate for phage enumeration and bacterial OD measurement from sample ports using syringes at each time point.
Phage stability assay
Phage stability assays were carried out as previously described, with minor modifications [41]. Phage lysates were serially diluted and spotted on their hosts of bacterial culture to evaluate their pH, temperature, and UV stability. The phages’ titers were measured after incubating 1 h with different pH values (2, 3, 4, 7, 10, 11, and 12). Likewise, the temperature stability was assessed by incubating tubes containing phages separately at temperature points − 80, -20, 4, 37, 50, 60, 70, 80 and 90 °C for 1 h. The phage’s tolerance to UV exposure was assessed at 15, 30, 45, 60, 80, and 90. minutes. The stability of the phage was evaluated based on the reduction in phage titer compared to the initial phage titer in SM buffer. For the UV stability assay, the phages were exposed to UV-C light at a wavelength of 254 nm using the built-in UV lamp of the biosafety cabinet (ESCO, Singapore). The distance from the lamp to the sample surface was approximately 60 cm. The lamp’s intensity at this distance was estimated to be 40µW/cm² [42].
Time kill kinetics assay
Kinetics of bacterial killing by the isolated phages was investigated at different phage MOIs (0.01, 0.1, 1, 10, 100) using the previously established method of time-killing curve assay [27]. The bacterial strains AB23 and AB24 were used as bacterial host for the isolated phages. Briefly, bacterial culture at 106 CFU/ml was treated with the phage at different MOIs in a 96-well microtiter plate. The bacterial O.D. at a wavelength of 600 nm was determined at 1 h intervals for a duration of 11 h by using FLUOstar® Omega plate reader, BMG LABTECH, Germany. A control of bacterial culture without phage treatment and a blank containing only the culture media were used.
Bacteriophage insensitive mutants (BIM)
The BIM frequency was estimated using the previously described method [43]. Briefly, 1 ml of bacterial culture at a concentration 107 CFU/ml was mixed with the phage to achieve MOI of 100. The bacterial strains AB23 and AB24 were used as hosts for isolated phages to assess phage-resistant mutant bacterial cells. After 24 h of incubation at 37 °C, 100 µl of the mixture (phage with its bacterial host) was serially diluted, spotted on TSA, and incubated at 37 °C for 24 h. Phage-resistant mutant bacterial cells were calculated by dividing viable bacterial counts after phage infection by the initial viable count [44].
Phage genome sequencing
Bacteriophage genomic DNA extraction
The genomic DNA of the phage was extracted using phenol-chloroform–isoamyl alcohol method with a minor modification [45]. The phage genomic DNA was extracted from 10 ml of high-titer (1010 PFU/ml) and filter-sterilized in a sterile tube. In brief, 1 ml of lysis buffer was added to the phage and then incubated at 56 °C for 1 h. After incubation, 10 ml of phenol/chloroform isoamyl alcohol was added and then centrifuged at 18,000 × g for 10 min to separate the organic phase and aqueous phase; the DNA was collected from the top of the aqueous phase while the organic phase, which contains proteins was discarded. The DNA from the aqueous phase was precipitated overnight at -20 °C by adding a 1:10 volume ratio of 3 M sodium acetate (pH 5.2) and a 2:1 volume ratio of ice-cold isopropanol. By centrifugation at 18,000 × g for 10 min, the precipitated DNA was formed in a pellet. The supernatant was removed, and the pellet was re-suspended in 90% ice-cold ethanol before being transferred to a new 1.5 mL tube. The DNA pellet was washed twice with 70% ethanol, allowed to dry, and then resuspended in 100 ml of nuclease-free water. DNA concentration and quality were evaluated using the FLUOstar Omega Microplate reader (BMG LABTECH, Germany).
Genome sequencing and bioinformatics analysis
The Illumina MiSeq platform was used to perform nucleotide sequencing. Library preparation was carried out using the Illumina Nextera tagmentation protocol (Illumina, Cambridge, UK). Quality control of the sequence reads was performed with FastQC (v0.11.9), and de novo assembly was carried out using Unicycle (v0.4.8) via the BV-BRC portal [46]. Genomic visualization, comparison, and orientation were performed using ProgressiveMauve and Ugene software, v43.0 [47, 48]. The single assembled contig was then annotated with the Rapid Annotation using Subsystem Technology Toolkit (RASTtk) pipeline [49]. The annotation process was customized, beginning with the ‘annotate-proteins-phage’ step, followed by ‘annotate-proteins kmer-v2 [50]. Following the RASTtk annotation, a second round of annotation was performed to confirm the assigned functions and to assign functions to proteins that were previously unassigned, using NCBI BLASTp, HHPred, and InterProScan. ARAGORN v1.2.41 was used to identify tRNA genes [51]. A phage genomic map was generated using the Proksee web-based tool [52] by CGView family tools [53].
The phage lifestyle prediction, virulent factor and antimicrobial resistance gene detection, and anti-CRISPR protein were analyzed by PhageScope [54]. In addition, the therapeutic potential of the phage was assessed using PhageLeads [55]which analyzes the phage genome for temperate genetic markers, antimicrobial resistance (AMR), and virulence factors. The transmembrane domains of the phage-predicted proteins were examined using DeepTMHMM, a tool that employs a deep learning algorithm based on a protein language model [56]. The genomic sequence was analyzed with the Phage Depolymerase Finder (PhageDPO, Galaxy Version 0.1.0) prediction tool to identify genes potentially encoding depolymerase functions [57].
Phylogenetic analysis
Genome-genome distancing was assessed by ViPtree (proteome-based) [58] and VIRIDIC (nucleotide-based) [59]. VIRIDIC assigned taxa using ICTV species and genus thresholds based on average nucleotide identity (ANI) at 95% and 70%, respectively. Additionally, a phylogenetic tree was constructed on NGPhylogeny.fr [60]using MUSCLE for amino acid sequence alignment [61] and PhyML 3.3.2 with the LG model for amino acid substitution [62]and a BioNJ initial tree to infer the evolutionary relationships of the terminase large subunit protein (encoded by a core gene). A gamma distribution with 4 rate categories was used to handle different mutation rates across sites, and SH-like branch supports were calculated to assess the reliability of the tree branches [63].
Cell cytotoxicity assay
The phage with a broader host range and better killing capacity was further evaluated for its safety on the human alveolar basal epithelial cell line A549 (ATCC Cat No. CCL-185) by using an MTT assay [27]. A549 cells were cultured in 96-well plates with a seeding density of 104 cells/well, in RPMI-1640 medium supplemented with 10% fetal bovine serum 100 I.U./ml penicillin, and 100 µg/ml streptomycin and incubated for 24 h at 37 °C/ 5% CO2. Then, serially diluted phage lysate was added to the cells with different concentrations (109, 108, 107, and 106) and incubated for another 24 h at 37 °C/ 5% CO2. After incubation, the medium was removed, and 100 µl of MTT solution (10 µl MTT and 90 µl RPMI) was added and incubated for 4 h at 37 °C and 5% CO2. 100 µl of DMSO as a solvent was added and incubated for 15 min in the dark, following OD measurement at 590 nm by using FLUOstar® Omega plate reader, BMG LABTECH, Germany, and the images was taken by an inverted microscope camera (Optika IM-3, Italy).
Dynamic of phage-bacteria interaction with A549 cells
To assess the effectiveness of the phage in the cell culture line, the bacteria were co-cultured with A549 cell lines and exposed to phage with different MOIs [27]. Bacterial and phage titer were assessed throughout the experiment at different time points, A549 cell viability was assessed only at the end of the assay time (6 h). In brief, human alveolar basal epithelial cell line A549 was used as a model for the in vitro study of phage-bacteria interaction. The cells were cultured in RPMI-1640 medium supplemented with 10% fetal bovine serum, 100 I.U./ml penicillin and 100 (µg/ml) streptomycin at 37 °C/ 5% CO2. When it reached confluency, the cells were trypsinzed and cultured in 96-well plates with seeding density 5 × 10⁴ cells/well, incubated at 37 °C/ 5% CO2 for 24 h.
At the same time, an overnight culture of AB24 was prepared and incubated at 37 °C. After 24 h, the bacterial culture was centrifuged at 8000 × g for 1 min, resuspended in phosphate buffer saline (PBS) (MP Biomedicals, LLC, Ohio), and OD was measured to obtain a final concentration of 105 CFU/ml. Then, the bacterial culture was centrifuged again and resuspended into complete RPMI without antibiotics.
After checking the cell adhesion on a 96-well plate, the old medium was removed and washed twice with PBS, and 100 µl/well of bacteria suspension in RPMI was added to reach a final concentration of 105 CFU/well. The cells were incubated for 1 h at 37 °C/ 5% CO2. Then, the planktonic bacteria were removed, and 100 µl of phage was added with several MOI (0.1, 1, 10, and 100); then, 100 µL of RPMI without antibiotics was added to all the wells. these wells were compared to the control with bacteria and the free cells without bacteria.
The plate count technique was used to enumerate the viable bacterial count and phage titer at (zero, 2, and 6 h). After 6 h, the cells were counted by removing the supernatant, washed twice with PBS, and 40 µl of trypsin was added and incubated for 15 min. Then, 60 µl of complete RPMI was added and mixed well, and cells were counted with trypan blue under a hemocytometer.
Statistical analysis
Each experiment was carried out in triplicate, with results expressed as the mean ± standard deviation (SD). GraphPad Prism 9.5.1 software was used for data analysis, including generating graphs and conducting one-way ANOVA.