Bacteria strains
The 59 strains of E. faecalis, 5 strains of E. faecium, 2 strains of Staphylococcus aureus, 2 strains of Listeria monocytogenes, and 2 strains of Escherichia coli used in this study (for details, see Table 2) were conserved by Institute of Microbe & Host Health, Linyi University (Linyi, Shandong province, China). VR-Efs V583 was provided by the Utrecht University (Netherlands) and stored by the Institute of Microbe & Host Health (Linyi, Shandong province, China).
Isolation and purification of phage
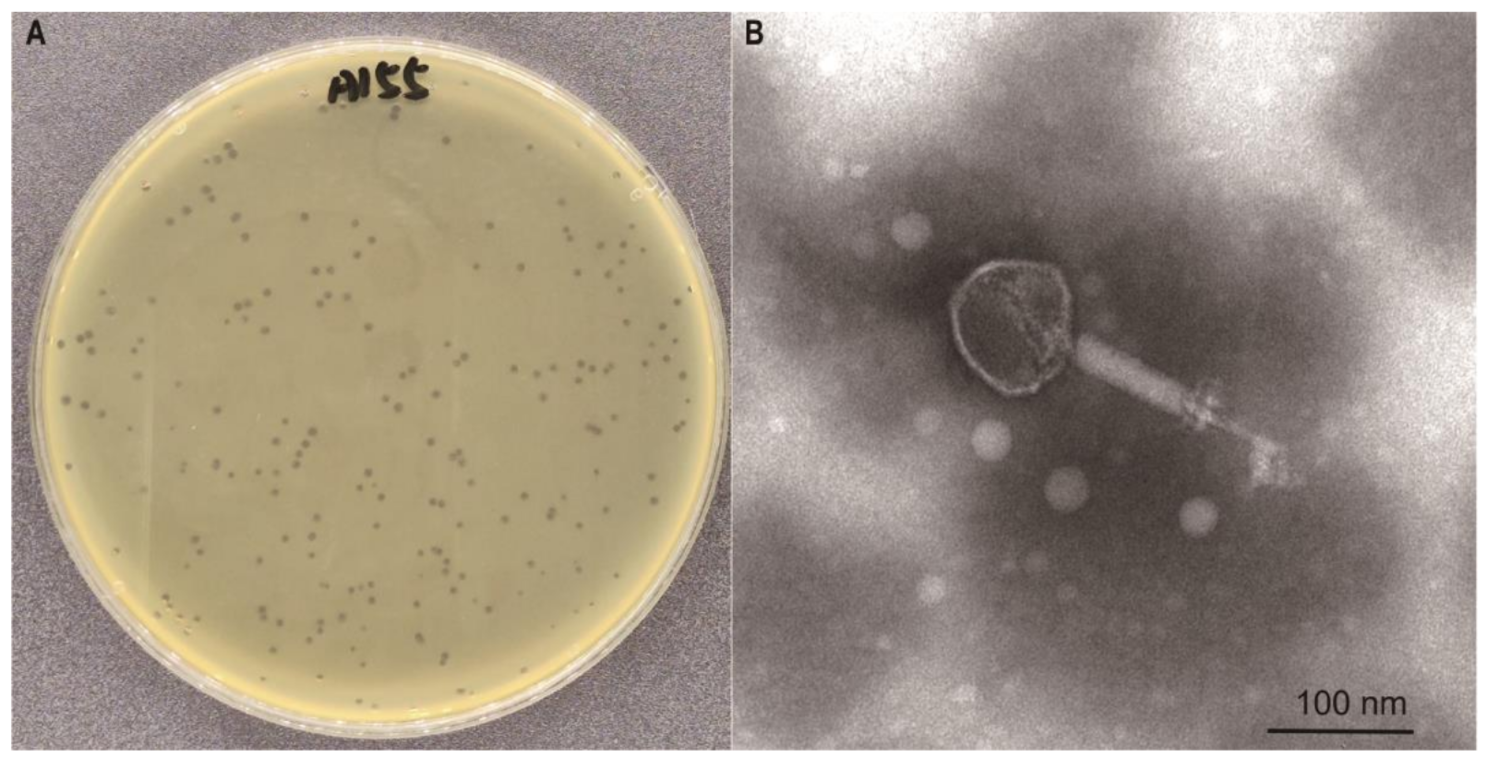
Phage A155 was isolated from a sewage sample from a farm (Minggang Farm, Linyi) using VR-Efs V583 through the modified enrichment technique [14]. In brief, 15 mL of pre-settled sewage supernatant was centrifuged at 2876 ×g for 5 min (Pingke-165–6N). Subsequently, 2.5 mL of clarified supernatant was mixed with 2.5 mL of 2× Brain Heart Infusion (BHI) broth. The mixtures were incubated overnight at 37 °C with shaking(200 r/min). Then, 1.0 mL of the culture was centrifuged at 11,586 ×g for 5 min (ALLSheng-mini-15k), and the supernatant was filtered with a 0.22 μm membrane filter(Jinteng, China), using the double-layer plate method [15] to screen phage presence.
For purification, individual plaques were excised using sterile pipette tips, soaked in 200 µL SM buffer overnight, and subjected to serial dilution and repeated with the double-layer plate method. The purification cycle was iterated until homogeneous plaque morphology was achieved. The phage A155 was cultured and stored at 4℃ and − 80℃ in 25% glycerol.
Phage morphology
The purified phage was amplified using PEG-8000. After overnight treatment at 4 °C, the supernatant was discarded by centrifugation at 6236 ×g for 10 min (Eppendorf-5810R-SL142). The precipitate was resuspended in 2.0 mL of SM buffer (NaCl 5.8 g/L, MgSO4 1.5 g/L, Tris 6.06 g/L, 1 M HCl, gum Aladdin 0.1 g/L, pH 7.5), followed by extraction with an equal volume of chloroform to obtain the phage concentrate. The concentrate was mixed with 1.5 g CsCl in a 15-mL centrifuge tube and centrifuged at 6236 ×g for 20 min at 4℃ using a centrifuge machine (Eppendorf-5810R-SL142). The phage band was collected with a syringe and dialysed overnight in phosphate-buffered saline (PBS) to obtain purified phage particles. The samples were stained using the phosphotungstic acid negative staining method [16] and observed under a transmission electron microscope at 80 kV after 15 min.
Optimal MOI
The multiplicity of infection (MOI) is the ratio of phage to host bacteria used for phage amplification. VR-Efs V583 was cultured to the logarithmic growth phase (OD6₀₀≈0.7), and the bacterial concentration was adjusted to 1 × 10⁹CFU/mL. The phage was serially diluted and mixed with VR-Efs V583 and BHI broth at MOIs of 10, 1, 0.1, 0.01, and 0.001. The mixtures were incubated at 37 °C with shaking at 200 r/min for 6 h. Phage potency in each mixture was determined using the double-layer plate method, and the mixture with the highest potency was identified as the optimal MOI for the phage.
One-step growth curve
VR-Efs V583 was cultured to the log-phase growth (OD6₀₀≈0.7), and 1.0 mL of the culture was centrifuged at 2200 ×g for 5 min at 4 °C (Eppendorf-5418R). Following centrifugation, the collected precipitate was subjected to two rounds of PBS resuspension and centrifugation under the same conditions to remove residual impurities. The supernatant was discarded, and the pellet was resuspended in 1.0 mL of sterile BHI broth. Phage was added at the optimal MOI (MOI = 0.001) and incubated at 37 °C for 15 min. The mixture was then centrifuged at 4827 ×g for 5 min (AllSheng-mini-15k), the supernatant was discarded, and the pellet was resuspended in 10 mL of sterile BHI broth. The suspension was incubated at 37 °C with shaking at 200 r/min. Samples (50 µL) were collected every 5 min for the first 30 min and every 10 min for the next 90 min (total 2 h) for phage titer determination. Three replicates were performed at each time point, and the average values were used. The one-step growth curve was plotted with sampling time on the x-axis and the logarithm of phage titer on the y-axis.
Temperature and pH stability
Difference from previous assay [13], phage A155 (10⁹ PFU/mL) was incubated in a thermostatic water bath at 20 °C, 30 °C, 40 °C, 50 °C, 60 °C, 70 °C, and 80 °C for 30 min and 60 min. After incubation, 100 µL of the phage solution was serially diluted 10-fold, and the phage titer was determined using the double-layer plate method. Three replicates were performed at each temperature, and the average values were used to analyze the changes in phage titer.
Phage A155 (10⁹ PFU/mL) was incubated at pH levels ranging from 2.0 to 14.0 (in increments of 1.0) for 60 min at 37 °C. After incubation, 100 µL of the phage solution was serially diluted 10-fold, and the phage titer was determined using the double-layer plate method. Three replicates were performed, and the average values were used to analyze the changes in phage titer under different pH conditions.
Sequencing and bioinformatics analysis of phage A155 genome
Following the instructions of the TIANamp Virus DNA/RNA Kit (Tiangen Bio-Tek Inc., Beijing, China), phage A155 was amplified, and concentrated, and its nucleic acid was extracted. Whole genome sequencing was conducted by Shanghai Personal Biotechnology Co., Ltd., following the method described by Han [17]. Briefly, using the Illumina TruSeq Nano DNA LT protocol (Illumina TruSeq DNA Sample Preparation Guide) to custom 2 × 250 bp paired-end DNA library, the average fragment length was 400 bp. Raw sequencing data quality was assessed by FastQC v0.11.7, followed by adapter trimming. The genome sequence was assembled using A5-MiSeq [18] and SPAdes [19]. Viral genome identification was performed by extracting high-depth sequences and conducting BLASTn alignment against the NCBI NT database [20]. Synteny analysis and gap closure were conducted by MUMmer [21], with subsequent error correction performed via Pilon v1.24 [22]. Protein-coding genes were predicted via GeneMarkS [23]. The genome data were uploaded to the National Center for Biotechnology Information (NCBI) database, GenBank accession number: PQ093903, and a comparative gene circle map was made by BRIG.
Phylogenetic tree construction
Based on the whole sequences, phylogenetic tree analysis was performed comparing phage A155 with multiple Enterococcus faecalis phages. Sequence alignment and phylogenetic tree construction were conducted using VICTOR [24].
Efficiency of plating (EOP)
Following a previously described method with certain modifications [25], the phage host range was quantitatively assessed through the efficiency of plating (EOP). Briefly, phage A155 solution was serially diluted 10-fold. Phage titers were determined in triplicate for each bacterial strain using the double-layer agar method. EOP values were calculated as (mean PFU on target bacteria / mean PFU on host bacteria). An EOP value of 0.5 or higher was classified as “high production”, indicating that at least 50% of PFUs were produced in target bacteria compared to host bacteria. An EOP value between 0.1 and 0.5 was classified as “Medium production.” An EOP value between 0.001 and 0.1 was considered “low production,” and an EOP less than 0.001 was referred to as inefficient.
Inhibitory effect of phage A155 on VR-Efs V583 in vitro
VR-Efs V583 was cultured to the stationary phase, harvested, and resuspended in fresh BHI broth. The suspension was distributed into 12-well plates, adjusted to a final bacterial concentration of 10⁷ CFU/mL(1/100 of the original bacterial liquid volume), and supplemented with BHI broth. Phage A155 was added at MOI of 0.001, 0.01, 0.1, 1, or 10, with a final volume of 2.5 mL per well. Bacterial growth without phage served as the control. All experiments were performed in triplicate. The plates were incubated in a Bacterial Growth Curve Instrument (Scientz MGC-200, Ningbo, China), and OD6₀₀ was measured every 30 min for 16 h to assess the lytic efficiency of phage A155 in vitro.
Phage therapy in the murine bacteremia model
Female BALB/c mice aged 6–8 weeks were purchased from a commercial supplier (Pengyue, Shandong, China). They were provided with water and standard mouse chow ad libitum and monitored daily.
An intestinal model of E. faecalis infection in mice was established as previously described [26] (Fig. 7a). Sixteen SPF BALB/c mice (6–8 weeks old) were randomly divided into two groups (n = 8). After one week of acclimatisation, antibiotics were administered orally to deplete the intestinal flora and create more ecological niches for E. faecalis colonization [27]. Mice received a mixture of antibiotics (vancomycin 10 mg, neomycin 10 mg, ampicillin 10 mg, metronidazole 10 mg) by gavage for 3 days, followed by the same antibiotics in drinking water (vancomycin 500 mg/L, neomycin 500 mg/L, ampicillin 500 mg/L, metronidazole 500 mg/L) for 7 days. Faecal bacterial counts, particularly Enterococci, were monitored using the plate-counting method during this period. After 2 days, 100 µL of VR-Efs V583 suspension (1 × 10⁹ CFU/mL) was administered to both groups to simulate enterococcal proliferation. Faecal Enterococci levels were monitored using PSE agar.
To assess the effect of phage treatment, a single dose of phage A155 (2.4 × 10⁸ PFU/mouse) was administered orally 4 days post-bacterial challenge. The control group received an equivalent volume of BHI broth. Faecal samples were collected daily, and Enterococci counts on selective media were used to evaluate the efficacy of phage treatment in reducing E. faecalis colonization.
Data analysis
GraphPad Prism 8.3.0 was used to analyse the experimental data using statistics. Data were analyzed using one-way ANOVA. Results are expressed as standard deviation (SD). Error bars indicate the standard deviation of the mean, and the p-value was used to indicate the statistical significance of the data.