Landscape of single cell nuclei of bladder cancers
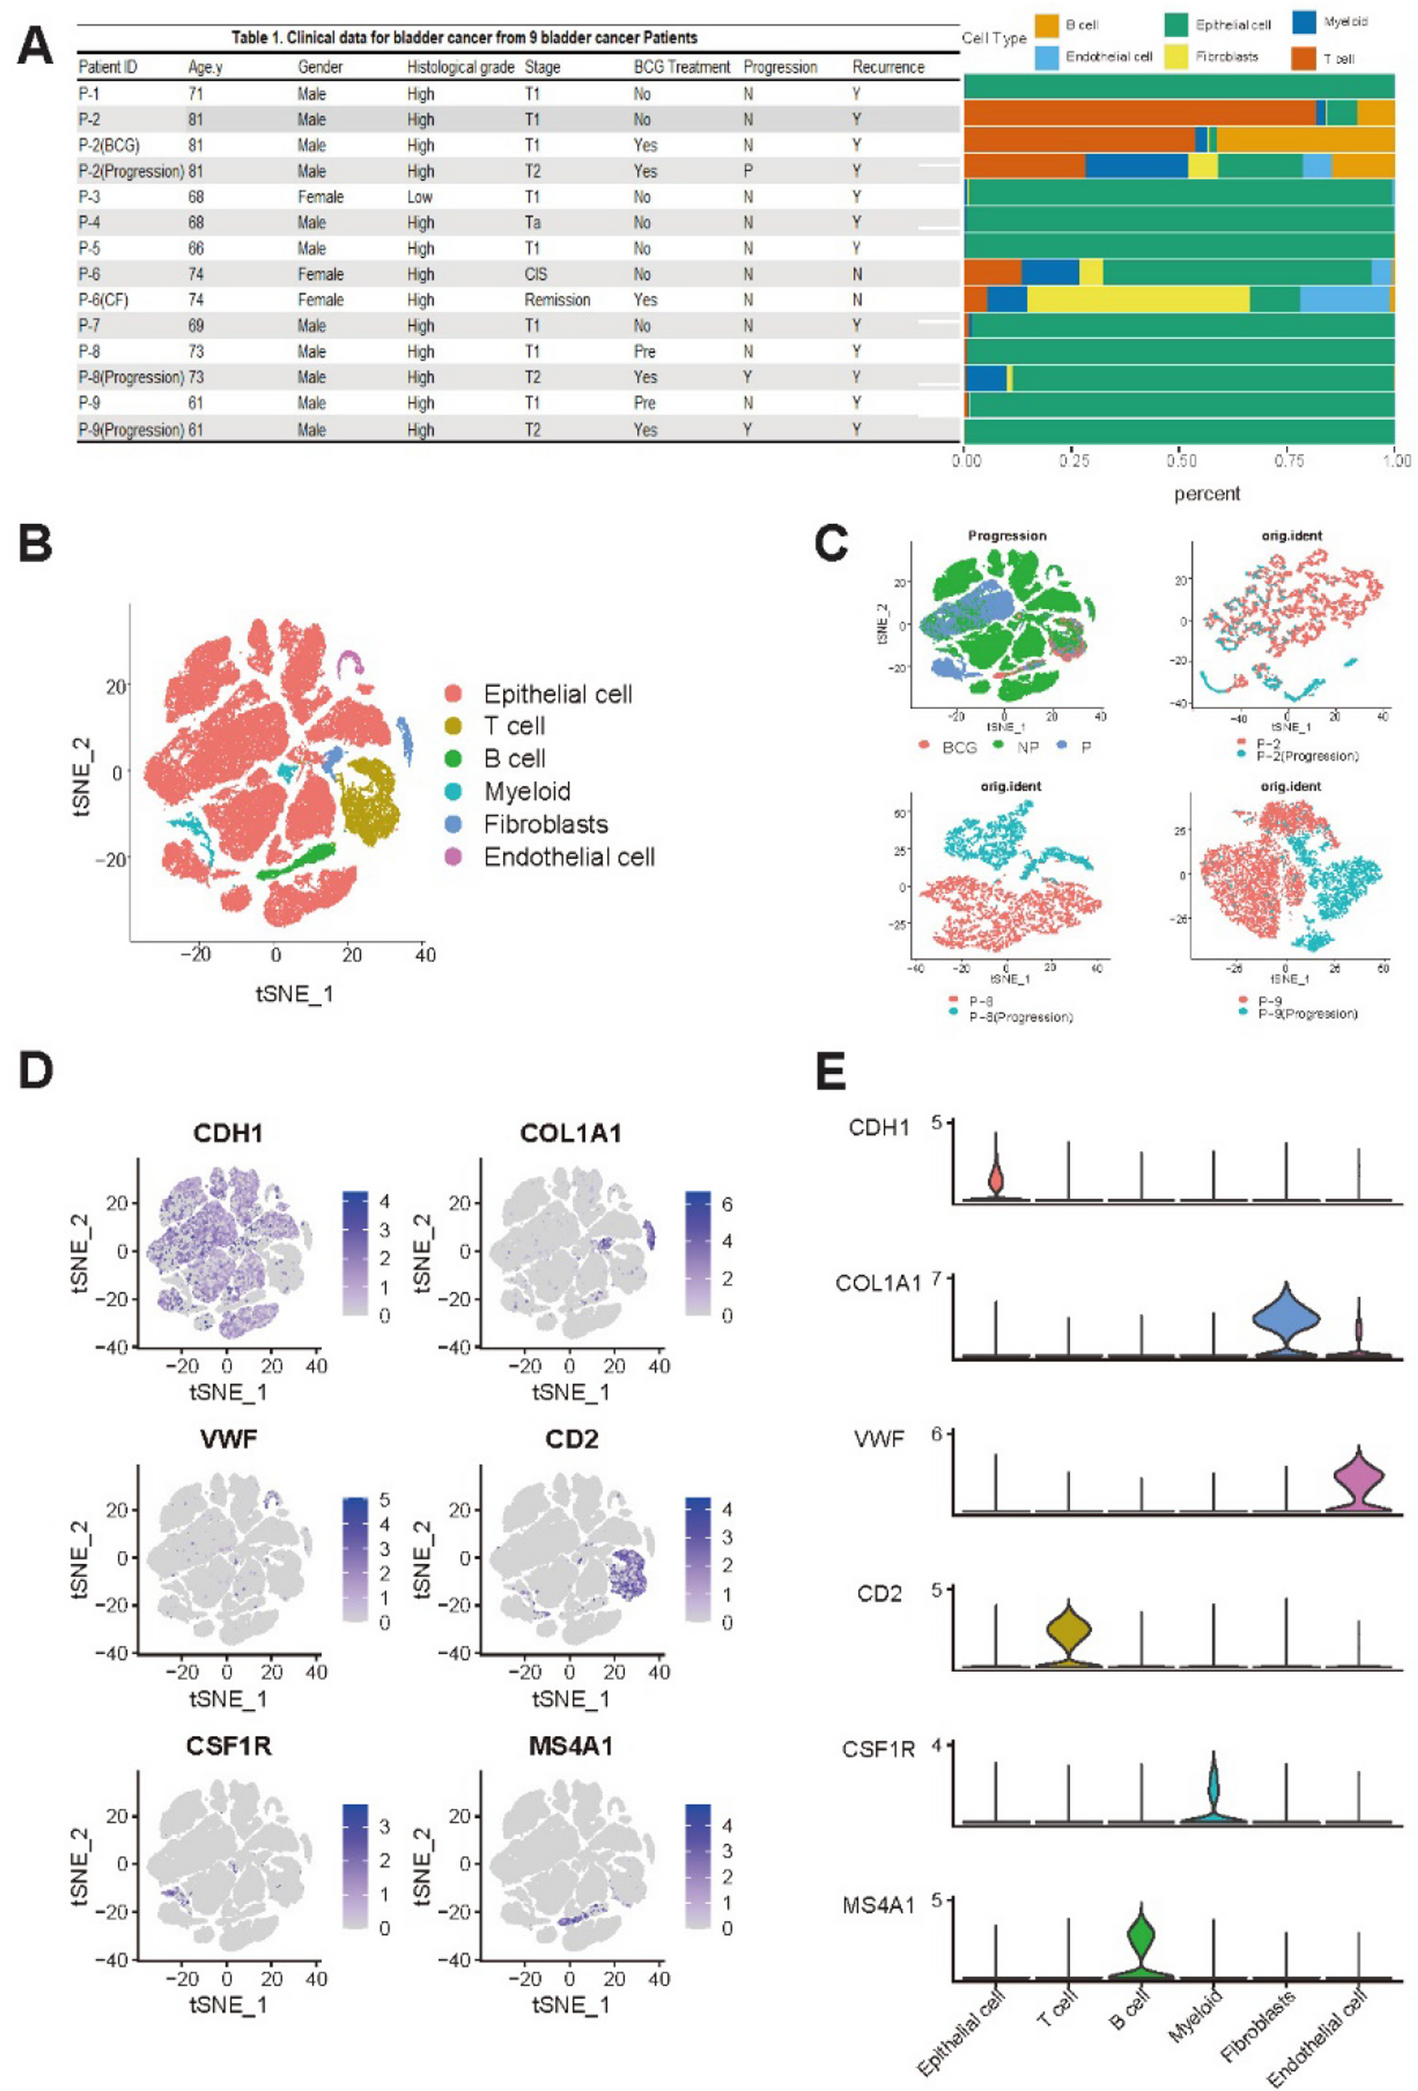
Nine patients diagnosed with NMIBC were enrolled in this study. All patients were treated with adjuvant BCG after endoscopic resection. Three patients experienced disease progression. They were classified as “progressors”. The remaining six patients who did not experience disease progression were classified as “non-progressors.” Detailed clinicopathological information of these patients is provided in Fig. 1A.
To characterize cell types in the tumor microenvironment (TME) of NMIBC, a total of 14 specimens (P-2, P-8 and P-9 specimens per patients including three post-progression specimens, 1 cell-free specimen) were subjected to snRNA-seq using resection specimens before BCG treatment. A total of 73,979 nuclei were obtained after removing cell doublets (median of 5,804 nuclei, 1,000–8,720 nuclei per patient) and profiled for mRNA quantification. Detailed information on snRNA-seq is available in Supplementary Table S1. Clustering of snRNA-seq revealed six major cell types: 61,837 epithelial cells, 898 endothelial cells, 5,973 T cells, 1,907 B cells, 1,712 myeloid cells, and 1,652 fibroblasts.
A t-distributed stochastic neighbor embedding (tSNE) plot was used to illustrate cell distribution as shown in Fig. 1B. Notably, epithelial cells constituted a significant fraction of cells, indicative of high tumor purity across samples. Moreover, heterogeneity between Progression and NP samples was observed as shown in pairwise tSNE plots (P-2, P-8, and P-9), Primary and progression samples formed well-separated clusters, indicating distinct transcriptional differences (Fig. 1C). The expression of marker genes for each major cell type is depicted in Fig. 1D, including CDH1 [18] for epithelial cells, VWF [19] for endothelial cells, COL1A1 [20] for fibroblasts, CSF1R [21] for myeloid cells, CD2 [22] for T cells, and MS4A1 [18] for B cells. Additionally, cluster-specific gene expression of selected markers is presented in Fig. 1E.
The TGF-β signaling pathway is activated in malignant cells with disease progression
Epithelial cells were further subject to fine-clustering. tSNE plots of epithelial cells revealed that the clustering of epithelial cells was largely determined with respect to individual patients, indicative of a substantial level of inter-patient heterogeneity of malignant cells (Fig. 2A). We then performed inferCNV to determine copy number alterations (CNA) based on gene expression. Using inferCNV analysis, we identified significant interpatient heterogeneity in inferred CNA profiles across nine bladder cancer malignant cells (Fig. 2B). Notable arm-level gains were observed in chromosomes 1q, 5p, and 20p, while frequent losses were detected in 9p, 11p, 17p, and 19p. Hurst et al. [23] have reported that gains of 1q and 5q and losses of 9p, 11p, 17p, and 19p are associated with disease progression of bladder cancers. In addition, Bellmunt et al. [24] have found that gains in 20p are linked to disease recurrence, while López et al. [25] have identified a connection between gains in 5q and bladder cancer recurrence.
Identification of malignant and defined malignant functions using ssGSEA (A) tSNE plot of 61,837 epithelial cells. (B) Chromosomal gains and losses in malignant epithelial cells were predicted using inferCNV. (C) A heatmap displaying enrichment scores from the ssGSEA analysis and correlation values between the ssGSEA score and monocle pseudotime results of the progression samples by Cell ID. (D)-(F) Monocle analysis of the development of malignant cells between P-2/P-8/P-9 Progression (Before BCG) and P-2/P-8/P-9 (Progression) with pseudotime, as well as the pseudotime trajectory of TGF-β signaling for P-2/P-8/P-9 Progression (Before BCG) and P-2/P-8/P-9 (Progression)
We analyzed malignant cells using longitudinal specimens obtained before treatment and after disease progression. Functional gene sets were identified using ssGSEA with representing sample-specific disease progression using Hallmark pathway. This analysis identified molecular functions enriched in the difference of NES values between Progression and Primary specimens. It highlighted tumor progression-related functions, such as WNT–β-catenin signaling and TGF-β signaling, which are consistently enriched across malignant cells during disease progression (Fig. 2C). This result suggests that TGF-β might play a key progression-related molecular function in disease progression after BCG (Figs. 2D–2F). Pseudo-temporal analysis representing the transition from treatment-naïve to progression samples indicated that each paired sample of malignant cells passed through smooth one-dimensional curves. Specifically, cells from treatment-naïve samples were ordered at early pseudotime points, followed by cells from progression samples at later pseudotime points. This indicates a clear separation in differentiation trajectories of treatment-naïve and progression cells. Results of the ssGSEA analysis of TGF-β signaling along the pseudotime trajectory showed that TGF-β signaling enrichment scores increased progressively from treatment-naïve to progression samples, consistent with the trajectory analysis.
TME cell subtypes associated with disease progression
Sub-clustering of macrophages (Fig. 3A; proliferating, M2 and SPP1 + macrophages) revealed three distinct subtypes. Pseudotime trajectory analysis showed bifurcation into two major branches, with proliferating and some subtypes located in earlier stages, M2 macrophages diverging into another branch, and SPP1 + macrophages appearing in the later phase (Fig. 3B). M2 macrophages were relatively more abundant in the Progression group than in the Progression-Before BCG group. Proliferating myeloid cells showed a gradual increase from NP to Progression-Before BCG and remained elevated in the Progression group, whereas SPP1 + macrophages exhibited a consistent decrease across groups, with the lowest proportion observed in the Progression group (Fig. 3C). The top 10 marker genes of macrophage subtypes are shown in Fig. 3D. The LYZ gene was identified as a marker gene for proliferating myeloid cells [26, 27]. In previous studies on bladder cancer, LYZ has been used as a myeloid cell marker. Moreover, Gu et al. have demonstrated a significant association between these cells and proliferation. Regarding the TTC7B gene, He et al. have found notable correlations between its expression and infiltration levels of various immune cells, including M2 macrophages [28].
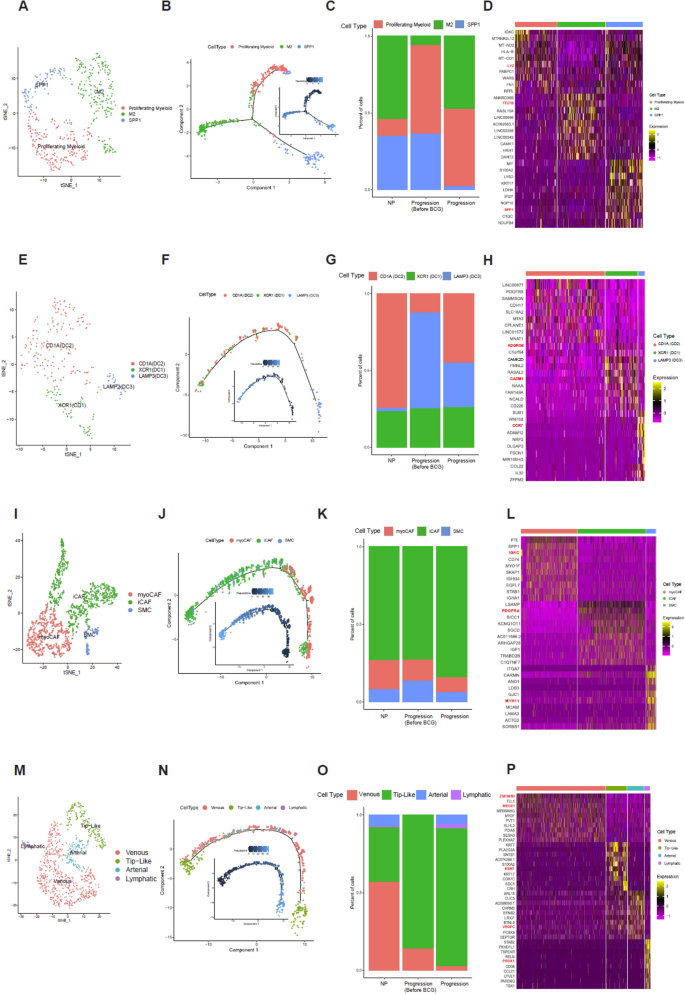
Characterization and profiling of four subtypes. A tSNE plot of 508 macrophage cells, showing the composition of three main subtypes. B Monocle analysis of the development between subtypes with pseudotime. C Cell proportion of subtypes by NP, Progression Before BCG, and Progression. D Heatmap of Top 10 marker genes of each subtype. E tSNE plot of 245 dendritic cells, showing the composition of 3 main subtypes. F Monocle analysis of the development between subtypes with pseudotime. G Cell proportion of subtypes by NP, Progression Before BCG, and Progression. H Heatmap of Top 10 marker genes of each subtype. I tSNE plot of 1,652 fibroblasts, showing the composition of the 3 main subtypes. (J) Monocle analysis of the development between subtypes with pseudotime. K Cell proportion of subtypes by NP, Progression Before BCG, and Progression. L Heatmap of Top 10 marker genes of each subtype. M tSNE plot of 898 endothelial cells, showing compositions of 4 main subtypes. N Monocle analysis of development between subtypes with pseudotime. O Cell proportion of subtypes by NP, Progression Before BCG, and Progression. P Heatmap of Top 10 marker genes of each subtype
Sub-clustering of dendritic cells (Fig. 3E; DC1, DC2, and DC3) demonstrated sequential differentiation. The pseudotime trajectory (Fig. 3F) followed an order from DC3 (LAMP3 +) at the earliest stage, through DC2 (CD1A +), and finally to DC1 (XCR1 +) at the latest stage, highlighting dynamic changes in cell states. For dendritic subtypes, CD1A (DC2) cells showed only a modest and variable increase in the Progression group compared with NP and Progression-Before BCG, without a consistent trend across patients (Fig. 3G). Dendritic cells are known for their roles in antigen presentation and immune response orchestration. They exhibited CADM1 expression, particularly in XCR1 (DC1), as highlighted by our DEG results where CADM1 emerged as a marker (Fig. 3H). To understand CADM1’s function [29], future research needs to be conducted on tumor progression where CADM1’s role has been extensively studied. Kang et al. have found that the ADGRG5 gene in CD1A (DC2) is associated with dendritic cells, showing a stronger correlation with ADGRG5 expression than in other types of immune cells tested [30]. In our study, ADGRG5 was identified as a marker in DC2. In DCs, CCR7-dependent migration from peripheral tissues to lymphoid tissues plays a critical role in host defense against pathogens and immune tolerance maintenance [31]. This migratory process is governed by complex intracellular signaling pathways that can regulate both DC movement and inflammatory responses. Our analysis identified CCR7 as a marker gene specifically in LAMP3-expressing DCs (DC3), as shown in our differential gene expression data (Fig. 3H).
Fibroblast subtypes (Fig. 3I; myoCAF, iCAF, and SMC) also showed distinct developmental patterns. Pseudotime analysis (Fig. 3J) indicated that myoCAF and iCAF dominated the early phase, while SMC and iCAF became predominant later, with the trajectory culminating in iCAF and SMC states. Results revealed a higher proportion of myoCAF cells in the Progression Before BCG group compared with the Progression group. Additionally, SMC cells showed a consistent proportion across all groups. Notably, iCAF cells maintained the highest proportion in all groups, although they were slightly reduced in the Progression group compared with NP and Progression Before BCG groups (Fig. 3K). Both iCAF and myoCAF showed similar cell proportions, although iCAF demonstrated a stronger correlation with reduced survival rates. The top 10 marker genes of fibroblast subtypes are displayed in Fig. 3L.
Sub-clustering of endothelial cells (Fig. 3M; venous, tip-like, arterial, and lymphatic) revealed further heterogeneity. Pseudotime trajectory analysis (Fig. 3N) indicated that venous and tip-like cells appeared in early stages, arterial and lymphatic cells arose but later disappeared, leaving tip-like cells predominant at the end. The distribution of endothelial cell subtypes within each group is illustrated in Fig. 3O. In the NP group, venous cells constituted the highest proportion, followed by tip-like cells. Arterial and lymphatic cells were present in relatively smaller proportions. In the Progression Before BCG group, tip-like cells dominated almost entirely, with a small presence of venous cells. Arterial and lymphatic cells were nearly absent. In the Progression group, tip-like cells also constituted the highest proportion, although the proportion of venous cells was significantly reduced compared with levels in NP and Progression-Before BCG groups. Additionally, proportions of arterial and lymphatic cells slightly increased. The top 10 marker genes of endothelial subtypes are shown in Fig. 3P. In humans, loss-of-function mutations in VEGFC or VEGFR3 can lead to lymphedema, while the application of recombinant VEGFC can stimulate robust lymphangiogenesis in adults, suggesting its therapeutic potential for lymphedema and tissue repair.
To distinguish the function of each subtype, we performed hallmark pathway analysis using ssGSEA and selected the top 10 hallmark pathways. As shown in Supplementary Fig. 1A, Proliferating Macrophage subtype was enriched in the EMT and MYC-TARGETS-V2 pathways, while the M2 subtype was enriched in the PI3K-AKT-mTOR-SIGNALING and TGF-BETA-SIGNALING pathways. Additionally, the SPP1 subtype was enriched in the MYC-TARGETS-V1, HYPOXIA, and DNA-REPAIR pathways. The population of dendritic cells was clustered into three subtypes (DC1, DC2, and DC3), although they were not clearly separated in ssGSEA Hallmark pathway. However, DC2 tended to be enriched in the DNA-REPAIR pathway, while DC showed a tendency to be enriched in the EMT pathway (Supplementary Fig. 1B). Additionally, fibroblasts were divided into three sub-clusters (myoCAF, iCAF, and SMC). The myoCAF subtype was enriched in immune-related pathways and the INFLAMMATORY-RESPONSE pathway, whereas iCAF and SMC subtypes were not clearly distinguished as shown in Supplemantary Fig. 1C. The venous subtype, a subset of endothelial cells, was enriched in immune-related pathways and the INFLAMMATORY-RESPONSE pathway, while the Tip-like sub-cluster was enriched in the MYC-TARGETS-V1 pathway. Additionally, the arterial subtype was enriched in the COMPLEMENT and ANGIOGENESIS pathways, whereas the Lymphatic sub-cluster was enriched in the NOTCH-SIGNALING pathway, as shown in Supplementary Fig. 1D.
Cell–cell interactions across malignant cells and TME cells
To investigate differences in cell–cell communication among various cell subpopulations, we analyzed interaction numbers and interaction strength using CellChat [16]. Our study included three conditions: No Progression (NP), Primary Before BCG, and Progression. Results in Fig. 4A illustrate variations in interaction patterns across these conditions. In the NP condition, interactions were relatively sparse, with notable communication occurring primarily between epithelial cells and other cell types. In the Primary condition (Before BCG), the interaction network became more complex, indicating increased communication among T cells, B cells, myeloid cells, and other subpopulations. The Progression condition showed the most extensive and robust interactions, suggesting a heightened level of cell–cell communication. We conducted a pathway-based ligand-receptor interaction analysis between TME cells. Results (Fig. 4A) demonstrated dynamic changes in cell–cell communication networks across different conditions, emphasizing the importance of epithelial cell interactions in NP, Progression Before BCG, and Progression. Notably, the interaction strength between epithelial cells and myeloid cells, as well as fibroblasts, increased from Progression Before BCG to Progression.
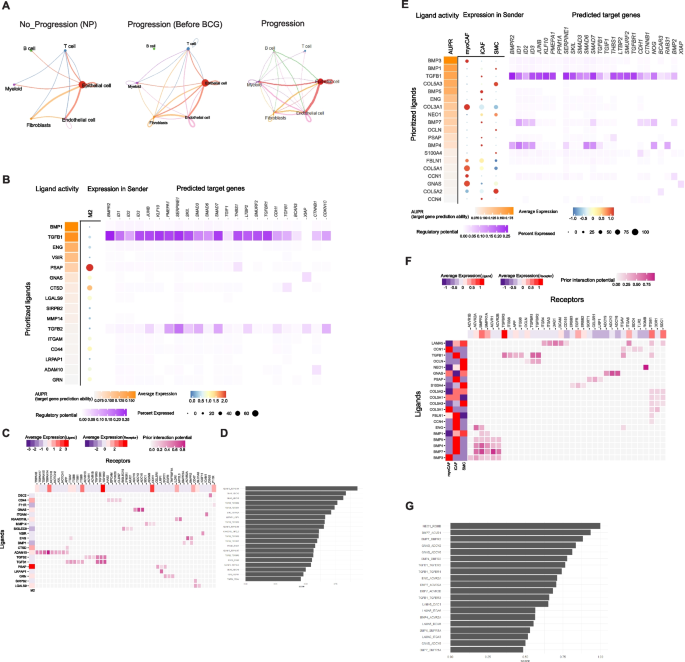
Estimation of cell–cell communication and interactions between malignant and macrophage/fibroblasts using TGF- β signaling pathway geneset. A Interaction plot for major cell types. The strength of communication was assessed via CellChat across NP, Progression Before BCG, and Progression. B Using the TGF- β signaling pathway geneset in Nichenet, interactions between malignant cells and Macrophages were examined. C A heatmap displays active ligand-receptor pairs, highlighting interaction potential between receptors on malignant receiver cells and ligands on Macrophage sender cells. D Top 30 ligand-receptor (L-R) pairs ordered by interaction potential score. E Interactions between malignant cells and fibroblast using the TGF- β signaling pathway geneset in Nichenet. F A heatmap displays active ligand-receptor pairs, highlighting interaction potential between receptors on malignant receiver cells and ligands on fibroblast sender cells. G Top 30 ligand-receptor (L–R) pairs ordered by interaction potential score
According to Browaeys et al. [17], a validation study can substantiate the proposed methodology, illustrating that the final prior model of ligand–target interactions can be broadly applied to various biological systems, thereby supporting the applicability of Nichenet to a wide range of biological contexts. Consequently, we employed the TGF-β signaling pathway identified in Fig. 2 to analyze Nichenet. We defined the gene set of interest as those genes within the receiver cell type that are likely to be influenced by the cell–cell communication event.
Results shown in Fig. 4A revealed that the interaction strength between epithelial cells and myeloid cells, as well as fibroblasts, increased from the Progression Before BCG stage to the Progression stage. Consequently, we analyzed ligand-receptor interactions during muscle regeneration in Progression samples using NicheNet. By applying stringent cutoffs, we identified differentially expressed ligands predicted to interact with receptors on malignant cell (top 20 by differential expression). We compiled a list of ligand-receptor pairs expressed in relevant cell types and predicted them to act upstream of TGF-b signaling specific genes. To narrow down the extensive list of candidates, we focused on ligands with high activation scores for TGF-b signaling genes and complementary targets in macrophages (Figs. 4B–4C) and fibroblasts (Figs. 4E–4F). In addition, we identified the top 30 ligand-receptor pairs in macrophages (Fig. 4D) and fibroblasts (Fig. 4G).
Establishment and validation of prognostic significance marker genes
Using TCGA data, we employed CIBERSORTx to estimate proportions of M2 macrophages and fibroblasts. As shown in Figs. 4D and 4G, top 30 ligand-receptor pairs were identified the. Based on these results, we examined the expression of the DSC2(L)-DSG2(R) pair in epithelial and myeloid cells and the expression of the ENG(L)-BMPR2(R) pair in epithelial and fibroblast cells from our snRNA-Seq data. We then analyzed their survival associations in TCGA BLCA data. Results are shown in Fig. 5. Patients with a higher average proportion of M2 macrophages and elevated expression of the DSC2(L)-DSG2(R) pair demonstrated a significant difference in survival with a p-value of 0.016 (Fig. 5A). Similarly, patients with a higher average proportion of fibroblasts and increased expression of the ENG(L)-BMPR2(R) pair also showed a significant survival difference, with a p-value of 0.017 (Fig. 5B). According to Nakauma-González et al. [32], DSC2 and DSG2 in bladder cancer are markers of intratumoral genomic and immunologic heterogeneity, particularly evident through squamous differentiation. This morphological heterogeneity can serve as a biomarker for intrinsic immunotherapy resistance in bladder cancer patients.
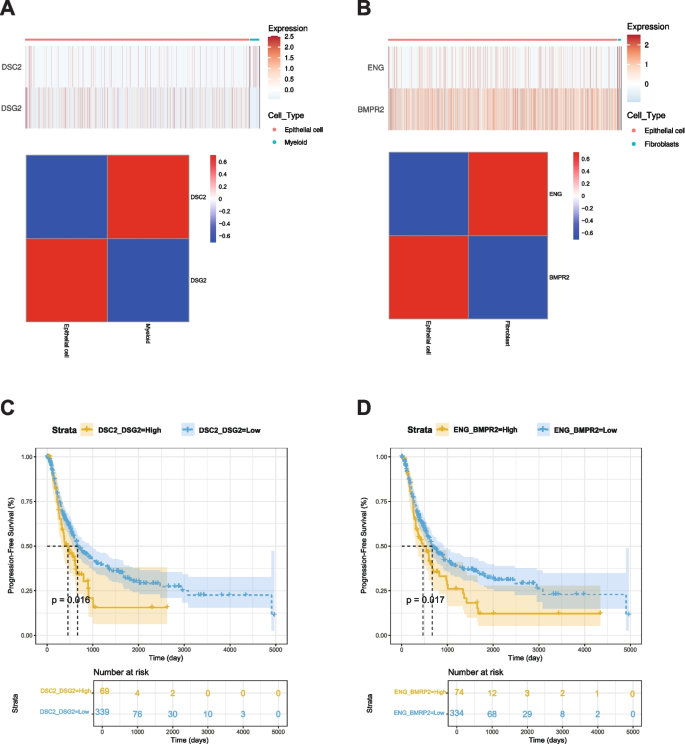
Kaplan–Meier analysis of BLCA progression-free survival (PFS) associated with ligand–receptor pairs. A Expression heatmap and correlation matrix of DSC2 (myeloid cells) and DSG2 (epithelial cells). B Expression heatmap and correlation matrix of ENG (fibroblasts) and BMPR2 (epithelial cells). C Kaplan–Meier PFS curve comparing high vs. low expression of the DSC2–DSG2 pair (p = 0.016). D Kaplan–Meier PFS curve comparing high vs. low expression of the ENG–BMPR2 pair (p = 0.017)