Consumer survey data from S&P Global highlight a wide and
growing divergence between the financial wellbeing of the lowest
income and wealthiest households in the UK.
Measuring wellbeing
The Consumer Sentiment Index survey tracks key metrics among UK
households on a monthly basis, with the data series dating back to
early-2009. The most recent monthly datasets have shown some
encouraging signs of recovery, with the headline index reaching one
of its highest levels recorded in the survey. However, a closer
examination of the underlying data reveals markedly divergent
trends by income group, particularly since the pandemic and
throughout the ongoing cost of living crisis.
One of the questions included in the CSI questionnaire asks
respondents to compare their household’s financial situation to
that of the previous month. While the tracker has generally been
relatively elevated in recent months compared to the survey’s
long-run average, further analysis reveals significant divergences
in financial wellbeing based on household income levels.
The data breaks downs households into five different income
tiers:
• less than £15,000 per year
• £15,001 to £23,000 per year
• £23,001 to £34,500 per year
• £34,501 to £57,750 per year
• £57,751 or more per year.
Individuals in the higher income tiers generally report more
positive responses than their counterparts in all other income
brackets, but the disparity between the highest income tier and the
other brackets has widened in recent years.
This note will specifically examine the increasing gap between
the highest and lowest income brackets.

Growing divergence between higher and lower income
households since the pandemic
The COVID-19 pandemic introduced substantial shocks to
households’ financial wellbeing in the early months. All income
brackets reported a marked deterioration in their financial
situations in 2020, a trend that not only persisted but deepened
over the following years amid the cost-of-living crisis with the
notable exception of the highest income bracket, where the
experience has been more mixed.
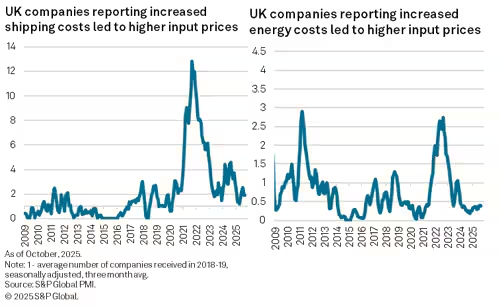
Since the pandemic, households have faced mounting pressure from
rising costs of essentials such as food, energy, and housing.
Energy prices, in particular, have undergone extreme fluctuations,
largely driven by the Ukraine-Russia conflict. Furthermore, supply
chain disruptions, including shipping challenges in the Red Sea,
have compounded shortages and elevated costs for essential
goods.
The repercussions of soaring energy costs and supply-side
challenges on input prices are captured in S&P Global Panel
Comments Trackers data, which provide qualitative insights from PMI
survey contributors around the globe.
The peak of this inflation crisis in the UK was experienced in
late 2022, when inflation soared to a 41-year high of 11.1%,
significantly surpassing the Bank of England’s target of 2%. This
period coincided with households reporting the most severe decline
in monthly financial wellbeing on record in October 2022, with the
seasonally adjusted headline index plunging to 26.9.
Notably, the gap between the highest and lowest earners at this
time was relatively narrow compared to historical averages.

The central bank reacted by tightening its monetary policy with
a series of interest rate hikes. However, as inflation began to
subside, this shift coincided with an expanding divide between the
highest and lowest earning households. Indeed, high-earning
households have consistently outperformed all other income brackets
during this period.
Wealthy households bounce back, but lower income
households struggle
As a result, differences in financial wellbeing among households
based on income have become more pronounced in recent years. The
chasm between the highest and lowest earners reached its zenith in
June 2024, just before the General Election. At that juncture, the
Bank of England’s policy rate had risen to a high of 5.25%,
occurring just one month prior to the central bank’s first rate
cut, which was followed by a series of further reductions.
Higher income households have demonstrated a more robust
recovery from the economic repercussions of the pandemic and the
ongoing cost of living crisis, as illustrated by the chart below,
which plots the shifts in financial wellbeing among the highest and
lowest income tiers since 2009, based on yearly averages. For the
years 2024 and 2025 (data available up to October), the highest
earning households have reported noteworthy improvements in their
financial circumstances. This trend underscores the resilience of
affluent households as they navigate the economic landscape,
achieving performance levels not previously seen in the series’
history.

Meanwhile, lower income households displayed some signs of
recovery in 2023 and 2024; however, they are experiencing greater
financial pressures again in 2025.
Outlook
The CSI data suggest that the disparity between higher and lower
earning households is set to endure, with affluent households
displaying relatively higher optimism regarding their financial
wellbeing outlook. In contrast, lower income households are bracing
for further declines in their financial health.

The upcoming Autumn Budget will be pivotal in shaping the
financial landscape for households in the year ahead. Adjustments
to the National Minimum Wage and National Insurance contributions,
alongside evolving tax implications, are fostering an environment
of uncertainty for both consumers and businesses.
Moreover, it will be crucial to assess the measures the
Chancellor may implement to support households, particularly as the
winter months loom.
Access the October CSI press release
here.
The next CSI release is scheduled for 17th
November.
Maryam Baluch, Economist, S&P Global Market
Intelligence
Tel: +44 1344 327 213
maryam.baluch@spglobal.com
© 2025, S&P Global. All rights reserved. Reproduction in whole
or in part without permission is prohibited.
Purchasing Managers’ Index™ (PMI®) data are compiled by S&P Global for more than 40 economies worldwide. The monthly data are derived from surveys of senior executives at private sector companies, and are available only via subscription. The PMI dataset features a headline number, which indicates the overall health of an economy, and sub-indices, which provide insights into other key economic drivers such as GDP, inflation, exports, capacity utilization, employment and inventories. The PMI data are used by financial and corporate professionals to better understand where economies and markets are headed, and to uncover opportunities.
Learn more about PMI data
Request a demo
This article was published by S&P Global Market Intelligence and not by S&P Global Ratings, which is a separately managed division of S&P Global.