Generation of TRMT61A and NSUN2 knockout cell lines
Based on the identified putative homologs encoding genes of TRMT61A and NSUN2 in Leishmania species [23], we attempted to generate knockout L. mexicana strains using the well-established CRISPR-Cas9 protocol [24]. After three independent attempts to delete both TRMT61A alleles, we observed the recovery of cells with only one allele deleted by replacement with donor DNA (-/+ , single knockout—SKO), suggesting that the presence of the two alleles might be essential for the viability of L. mexicana. On the other hand, we were able to obtain independent null mutants with both alleles replaced with donor DNA (-/-, double knockout, DKO) for NSUN2 genes. The TRMT61A and NSUN2 knockout cell lines were confirmed using conventional PCR reactions with locus-specific primers (Fig. 1).
Cell differentiation of Leishmania mexicana is affected by TRMT61A and NSUN2 gene knockouts
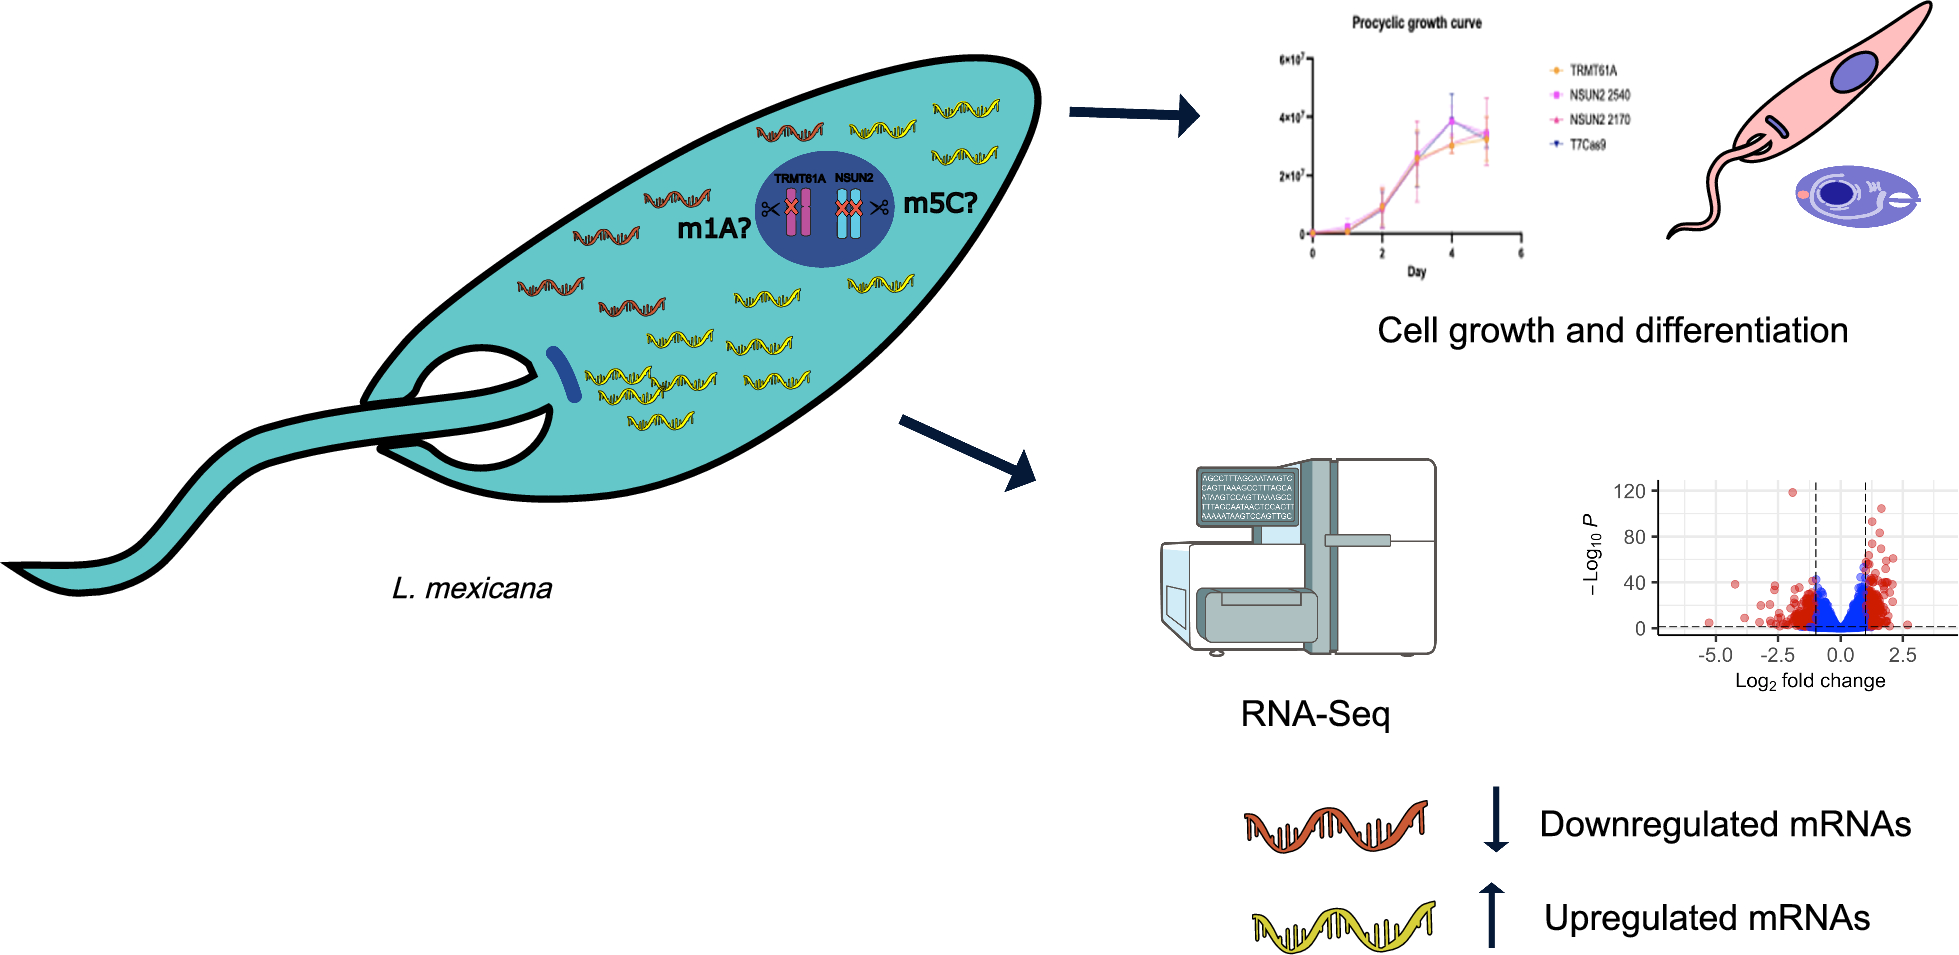
To investigate any deleterious effect from the deletion of the target genes, we evaluated the TRMT61A and NSUN2 mutants during growth curves of the promastigote parasite stage compared to T7/Cas9 parental cell line. No apparent changes in morphology or decreases in growth rates were observed in any of the mutant cell lines (Additional file 2: Supplementary Fig. S1). Based on the results of PCR confirmation and growth curves, one clone of each mutant cell line was selected for further evaluation (clone 1, C1). The effect of deletions was then investigated on the differentiation process of L. mexicana (Fig. 2).
Cell growth and differentiation of TRMT61A and NSUN2 knockout cell lines. a Response of the three cell lines to in vitro metacyclogenesis, when the parasites were counted each 24 h, before and after Percoll gradient purification, to determine the percentage of metacyclic promastigotes relative to the control T7/Cas9. The number of replicates is represented within each bar. Statistical comparisons were made by one-way ANOVA followed by Dunnett’s multiple comparisons test. b Representative images of each cell stage during amastigogenesis. Hoescht 33342 was used to stain the nucleus and kinetoplast. c–f Axenic amastigote differentiation and multiplication of control T7/Cas9 (c), TRMT61A SKO (d), NSUN2 2540 DKO (e) and NSUN2 2170 DKO (f). Logarithmic promastigotes were submitted to the axenic amastigote differentiation protocol, and the multiplication rate was monitored daily. Statistical comparisons were made by two-way ANOVA, followed by Tukey multiple comparisons test
Initially, the metacyclic transformation capacity of mutant cell lines was observed and quantified compared to parental T7/Cas9. Using a differentiation rate of 100% for T7/Cas9 as a reference, the mutants exhibited average values < 35%. While the TRMT61A mutant showed a rate of 33.6%, NSUN2 2170 and 2540 cell lines presented only 26.5 and 34.6%, respectively. These findings indicate that, although the absence of TRMT61A and NSUN2 genes does not affect the normal growth of the procyclics, it can reduce the differentiation rate into metacyclic forms.
The differentiation from promastigote to axenic amastigote was also evaluated, using the following criteria of morphological changes: procyclic promastigote—elongated cell body with a long flagellum on the anterior portion and a clear distinction between the kinetoplast and nuclei; amastigote-like—oval cell body with nuclei and kinetoplast close together at the center and a small flagellum noticeable; amastigote—small oval cell body with no visible flagellum and no distinction between nuclei and kinetoplast.
Based on this, T7/Cas9 exhibited a promastigote proportion of 57.7% by day 2, whereas the highest proportion among the mutant lineages was only 18%. In the following days, the proportion of amastigotes was higher in all three mutants, which, by day 5, had approximately 90% of axenic amastigotes, while the control had a differentiation of 72.4%. These results suggest that the mutants may undergo earlier and faster differentiation into amastigotes.
Bulk RNA sequencing of TRMT61A and NSUN2 mutant cell lines
In the sequencing experiments, three replicates of each modified cell line, TRMT61A SKO, NSUN2 2170 DKO and NSUN2 2540 DKO, and four of the controls, which were WT and T7/Cas9, were used, and a total of 453,937,475 reads were generated. They were subsequently mapped against the L. mexicana reference genome. We observed that on average the bases presented phred scores ≥ 30 (Table 1). Therefore, the removal of low-quality reads was not necessary. The number of reads between replicates uniquely mapped to the genome was generally uniform and around 70%. Then, the data were used for differential gene expression analysis using the DESeq2 package in the R programming environment. First, a gene expression analysis was performed between the T7/Cas9 and WT strain, and no significant difference was observed between the two strains (Additional file 3: Supplementary Table S2). Therefore, T7/Cas9 was chosen to continue as a control for comparison with the mutant strains. A principal component analysis (PCA) was also performed. In this step, transcriptomic sequencing data from the mutant strains were compared with data from the T7/Cas9 strain (control). Overall, two distinct groups of samples were observed for each mutant strain compared to the control (Additional file 4: Supplementary Fig. S2).
Global impact on gene expression due to the deletion of TRMT61A and NSUN2 genes
Differential expression analysis of TRMT61A mutant compared to T7/Cas9 confirmed the generation of single-knockout parasites as a significant downregulation of TRMT61A transcripts, with a log2 fold change of 1.06, corresponding to a twofold reduction. Moreover, we found that from the 8217 genes evaluated, 417 exhibited significant differences in expression, characterized by absolute log2 fold change values ≥ 1 and corrected p-values ≤ 0.05 (Fig. 3a and Additional file 5: Supplementary Table S3). Among these differentially expressed genes (DEGs), 239 were upregulated, while 178 were downregulated and assigned to different cellular processes, including genes related to the biological context of RNA metabolism.
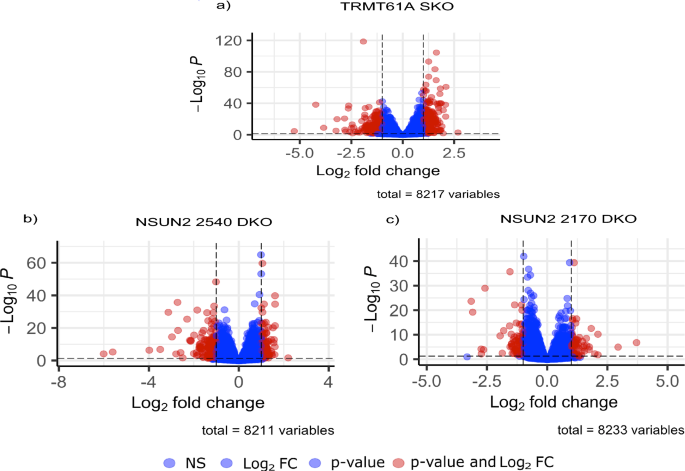
Volcano plots of differentially expressed genes in the TRMT61A and NSUN2 mutants compared to parental cell line. The graphs show the fold change (x-axis) versus corrected p-value (y-axis) of the analyzed genes. The significance (adjusted p-value) and fold change are converted to − Log10 (p-value) and Log2 (fold change), respectively. The vertical and horizontal dotted lines show the cutoff of log2 fold change = ± 1 and – log10 correct p = 0.05, respectively. a For TRMT61A SKO, there were 239 upregulated genes and 178 downregulated. b For NSUN2 2540 DKO, 91 were upregulated and 130 downregulated. c For NSUN2 2170 DKO, 54 were upregulated and 55 downregulated
The comprehensive transcriptomic sequencing analysis of NSUN2 null mutants revealed a striking 64-fold reduction (log2 fold change = −6) for NSUN2 2540 DKO transcripts and eightfold difference (log2 fold change = −3) for NSUN2 2170 DKO compared to T7/Cas9 parental cell line. This result, combined with the analysis of the RNA-seq read coverage at the TRMT61A and NSUN2 loci in T7/Cas9 and mutant lines (Additional file 6: Supplementary Fig. S3), confirms the successful deletion of each gene in their specific cell line. The differential gene expression analysis for lineages with the deleted genes for NSUN2 2540 and NSUN2 2170 involved 8211 and 8233 genes, respectively. The cell line with the NSUN2 2540 deletion displayed 221 DEGs, comprising 130 downregulated and 91 upregulated (Fig. 3b and Additional file 7: Supplementary Table S4). Conversely, the lineage lacking the NSUN2 2170 gene showed 109 DEGs, with 55 downregulated and 54 upregulated (Fig. 3c and Additional file 8: Supplementary Table S5).
To analyze the functional impacts of the differentially expressed genes, we performed gene enrichment analysis based on Gene Ontology (GO) terms for Biological Process (BP), Cellular Component (CC) and Molecular Function (MF) (Fig. 4). Looking at the functional enrichment results for the TRMT61A mutant, among the BP terms with the highest scores, we found protein folding and refolding as well as terms that suggest a possible disturbance in pathways involved in metabolism of nucleotides (Fig. 4a). Furthermore, important structures involved in the metabolism of mRNAs were affected, such as the eIF3 translation initiation complex, the eukaryotic 43S translation pre-initiation complex and chaperone complexes, as observed in the CC group. Finally, several MF terms related to translation were also detected.
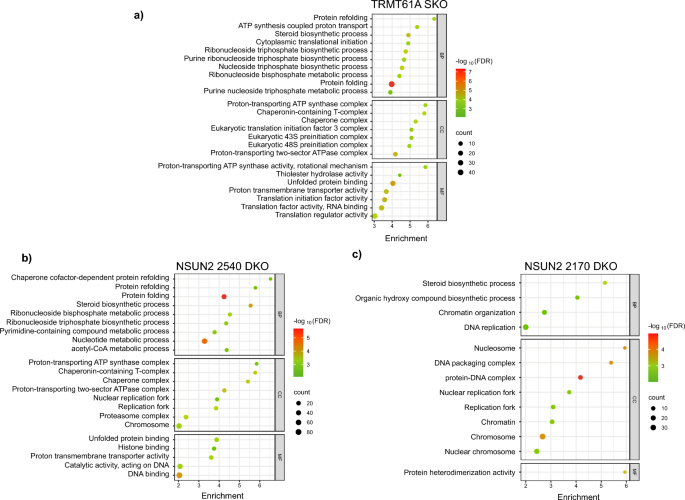
Gene enrichment analyses of differentially expressed genes (DEGs) found in TRMT61A and in both NSUN2 mutants compared to parental cells. The analyses were done based on the Gene Ontology Consortium for Biological Process (BP), Cellular Component (CC) and Molecular Function (MF) for a TRMT61A SKO, b NSUN2 2540 DKO and c NSUN2 2170 DKO. The size of each circle in the graphs represents the number of differentially expressed genes associated with a given functional term. The color scale represents the p-value converted to a base 10 negative logarithmic scale, thus illustrating the statistical significance of the enrichment of a given functional term. The plots were generated using SRplot (bioinformatics.com.cn/srplot)
Comparing the two mutant lineages of the NSUN2 genes, there were more pronounced changes in the mutant for NSUN2 2540, particularly with terms of BP related to protein folding and refolding and nucleotide metabolism (Fig. 4b). Energetic metabolism and chaperone complexes were identified in cellular components as well as terms related to DNA replication. These last two functions were also identified in the terms of MF. For the other NSUN2 mutant (2170), the profile for GO enrichment was different, and a small number of identified terms reflected the reduced number of DEGs observed in this cell line (Fig. 4c). Regarding BP, the changes occurred in biosynthetic components, while for CC, there were genes related to the terms involving DNA and DNA-protein complexes as well as nucleosomes. For MF, the enriched genes were related to only one term, which was protein heterodimerization activity.
Overview of differentially expressed transcripts in TRMT61A single-knockout cell line
Following the analysis of the general transcriptomic profile after deletion of the genes of interest, we subsequently conducted a more detailed analysis of the transcripts that were most affected within each cell line. The top 30 most differentially expressed genes in the TRMT61A SKO mutant are shown in Table 2. For negatively regulated genes, the TOP1 mRNA is from a hypothetical protein (LmxM.01.0830), with a 27.8-fold decrease in expression. Other highly impacted downregulated genes were LmxM.24.1840, a lysophospholipase; LmxM.32.1760, an OTT_1508-like deaminase, with a 10.5-fold difference in expression; LmxM.24.1850, a hypothetical predicted multi-pass transmembrane protein, and LmxM.05.1215, a surface antigen-like protein, both with an eightfold difference in expression. Many mRNAs encoding hypothetical proteins were noticed, and LmxM.08_29.1090, encoding ribosomal protein L1a, showed a fourfold difference in expression.
Analysis of the most upregulated mRNAs revealed some genes associated with the heat shock response, including three with a high fold change (≥ 3.8-fold), classified as heat shock proteins (LmxM.26.0640, LmxM.32.2390 and LmxM.32.0316). Other genes annotated as coding for HSP60 chaperonins and mitochondrial heat shock 70-related protein 1 were also found. Among the top-most positively regulated DEGs, we identified genes related to mRNA metabolism and the translation process, such as the RNA binding protein 42 (RBP42) (LmxM.24.0630) and the subunit H of the eukaryotic eIF3 translation initiation complex (LmxM.07.0640) with a 2.5-fold increase, while other subunits of eIF3 complex (A, B, C, D and I) were also upregulated, all showing a twofold difference in expression (Supplementary Table S3).
The results show that the deletion of TRMT61A gene, although partial, affected many transcripts of diverse categories, some including components of the translation initiation machinery and nucleotide metabolism. This evidence suggests a possible effect of TRMT61A enzyme in processes involved in gene expression regulation in L. mexicana.
Overview of transcripts differentially expressed in NSUN2 mutants
Within the NSUN2 2540 DKO mutant, the TOP1 downregulated mRNA was its respective transcript. The profile for most downregulated genes included the hypothetical protein (LmxM.01.0830), with a 31.4-fold decrease in expression, a ribosomal protein L1a (LmxM.08_29.1090) and the OTT_1508-like deaminase (LmxM.32.1760). The list also includes genes for autophagy-related proteins (ATG8/AUT7/APG8/PAZ2) and many hypothetical and surface antigen-like proteins (Table 3).
For NSUN2 2170 DKO, the list of the top downregulated genes includes many of those coding for hypothetical proteins, surface antigen-like protein and tuzin-like proteins (LmxM.33.1590, LmxM.33.1570, LmxM.33.1610, LmxM.33.1810, LmxM.34.1830 and LmxM.34.1830a), which seemed to be part of a cluster (Table 4). Within the list of top positively enriched hits, two genes for the glycoprotein GP63 (LmxM.10.0390 and LmxM.10.0470) were present. Different histone-coding mRNAs were also found and many transcripts of metabolic enzymes, some related to lipid metabolism (Supplementary Table S5).
Comparison of the differentially expressed genes in TRMT61A and NSUN2 mutants
Many transcripts with a significant impact on expression levels were identical or similar between the different mutant strains. When the results from the three mutant cell lines were compared, a greater impact was observed on the negatively regulated genes which exhibited higher fold changes (27.8-, 31.5- and 10-fold for TRMT61A, 2540 and 2170, respectively) compared to positively regulated genes (4.4-, 2.6- and 3.4-fold, respectively). A Venn diagram illustrates the intersection among the different mutants, identifying 43 common transcripts in the list of downregulated DEGs, whereas 24 upregulated DEGs are common to all three strains (Fig. 5). Notably, in the lists of the top 30 most downregulated, 12 genes were present in all 3 cell lines. Fewer transcripts were common when the lists of the TOP30 upregulated ones were compared, with only six being present in all three cell lines.
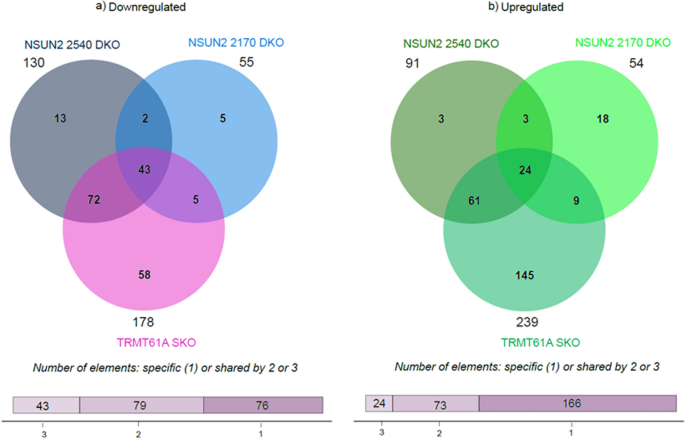
Comparative analysis of differentially expressed genes among the three different mutant cell lines. Venn diagram showing the intersection among the transcripts present at TRMT61A SKO and DKO of the orthologs NSUN2 2450 and NSUN2 2170, where a is for downregulated mRNAs and b for upregulated. The plots were generated using SRplot (bioinformatics.com.cn/srplot)
The comparison also highlights that most of the DEGs identified in the NSUN2 2540 DKO strain are also subject to some form of regulation in the remaining cell lines, with many corresponding to the TRMT61A mutant. Of the 130 downregulated genes, 115 were also present in the TRMT61A SKO, whereas only 45 were identified in the NSUN2 2170 DKO. Similarly, for the upregulated genes, 85 of the 91 are common between NSUN2 2540 DKO and TRMT61A SKO, while the NSUN2 orthologs share 27 common transcripts. There is also an intersection between TRMT61A SKO and NSUN2 2170 DKO, with 48 downregulated genes and 33 upregulated genes in common. This set of results suggests a potential interplay among the three methyltransferases orthologs.
Motif discovery analysis
The observation that several of the genes with high impact on expression levels were identical or similar among the different mutant strains led us to seek potential common RNA motifs in the regulated transcripts. For this, each set of 5′ UTR and 3′ UTR sequences from positively or negatively differentially expressed genes in each strain were analyzed using tools from the MEME Suite.
Although motifs associated with classical readers of chemical modifications, such as YTH domain-containing proteins, YBX1 and ALYREF, were not clearly identified in the sequences of the RNA sets, the results revealed sequences recognized by multiple RBPs, including hnRNPs, PABP, PCBPs and RBMs, among others (Additional file 9: Supplementary Table S6). The highest enrichment values were observed for the hnRNPs (K and L) in motifs mostly present on 5’ UTRs of upregulated transcripts. Notably, no significant motifs were detected in the 5’ UTRs of downregulated mRNAs. A motif rich in cytosines and adenines (ACACACACAC) related to recognition by IGF2BPs (Insulin-like growth factor 2 mRNA-binding proteins) was found in the 3’UTR set of sequences from upregulated genes in the DKO cell line for the NSUN2 2540 gene. IGF2BPs have been reported as non-canonical methylation readers, with IGF2BP2 being a protein that preferentially binds to N6-methyladenosine (m6A)-containing mRNAs and increases their stability [29, 30].