Identification and in silico characterization of LuTPS gene family
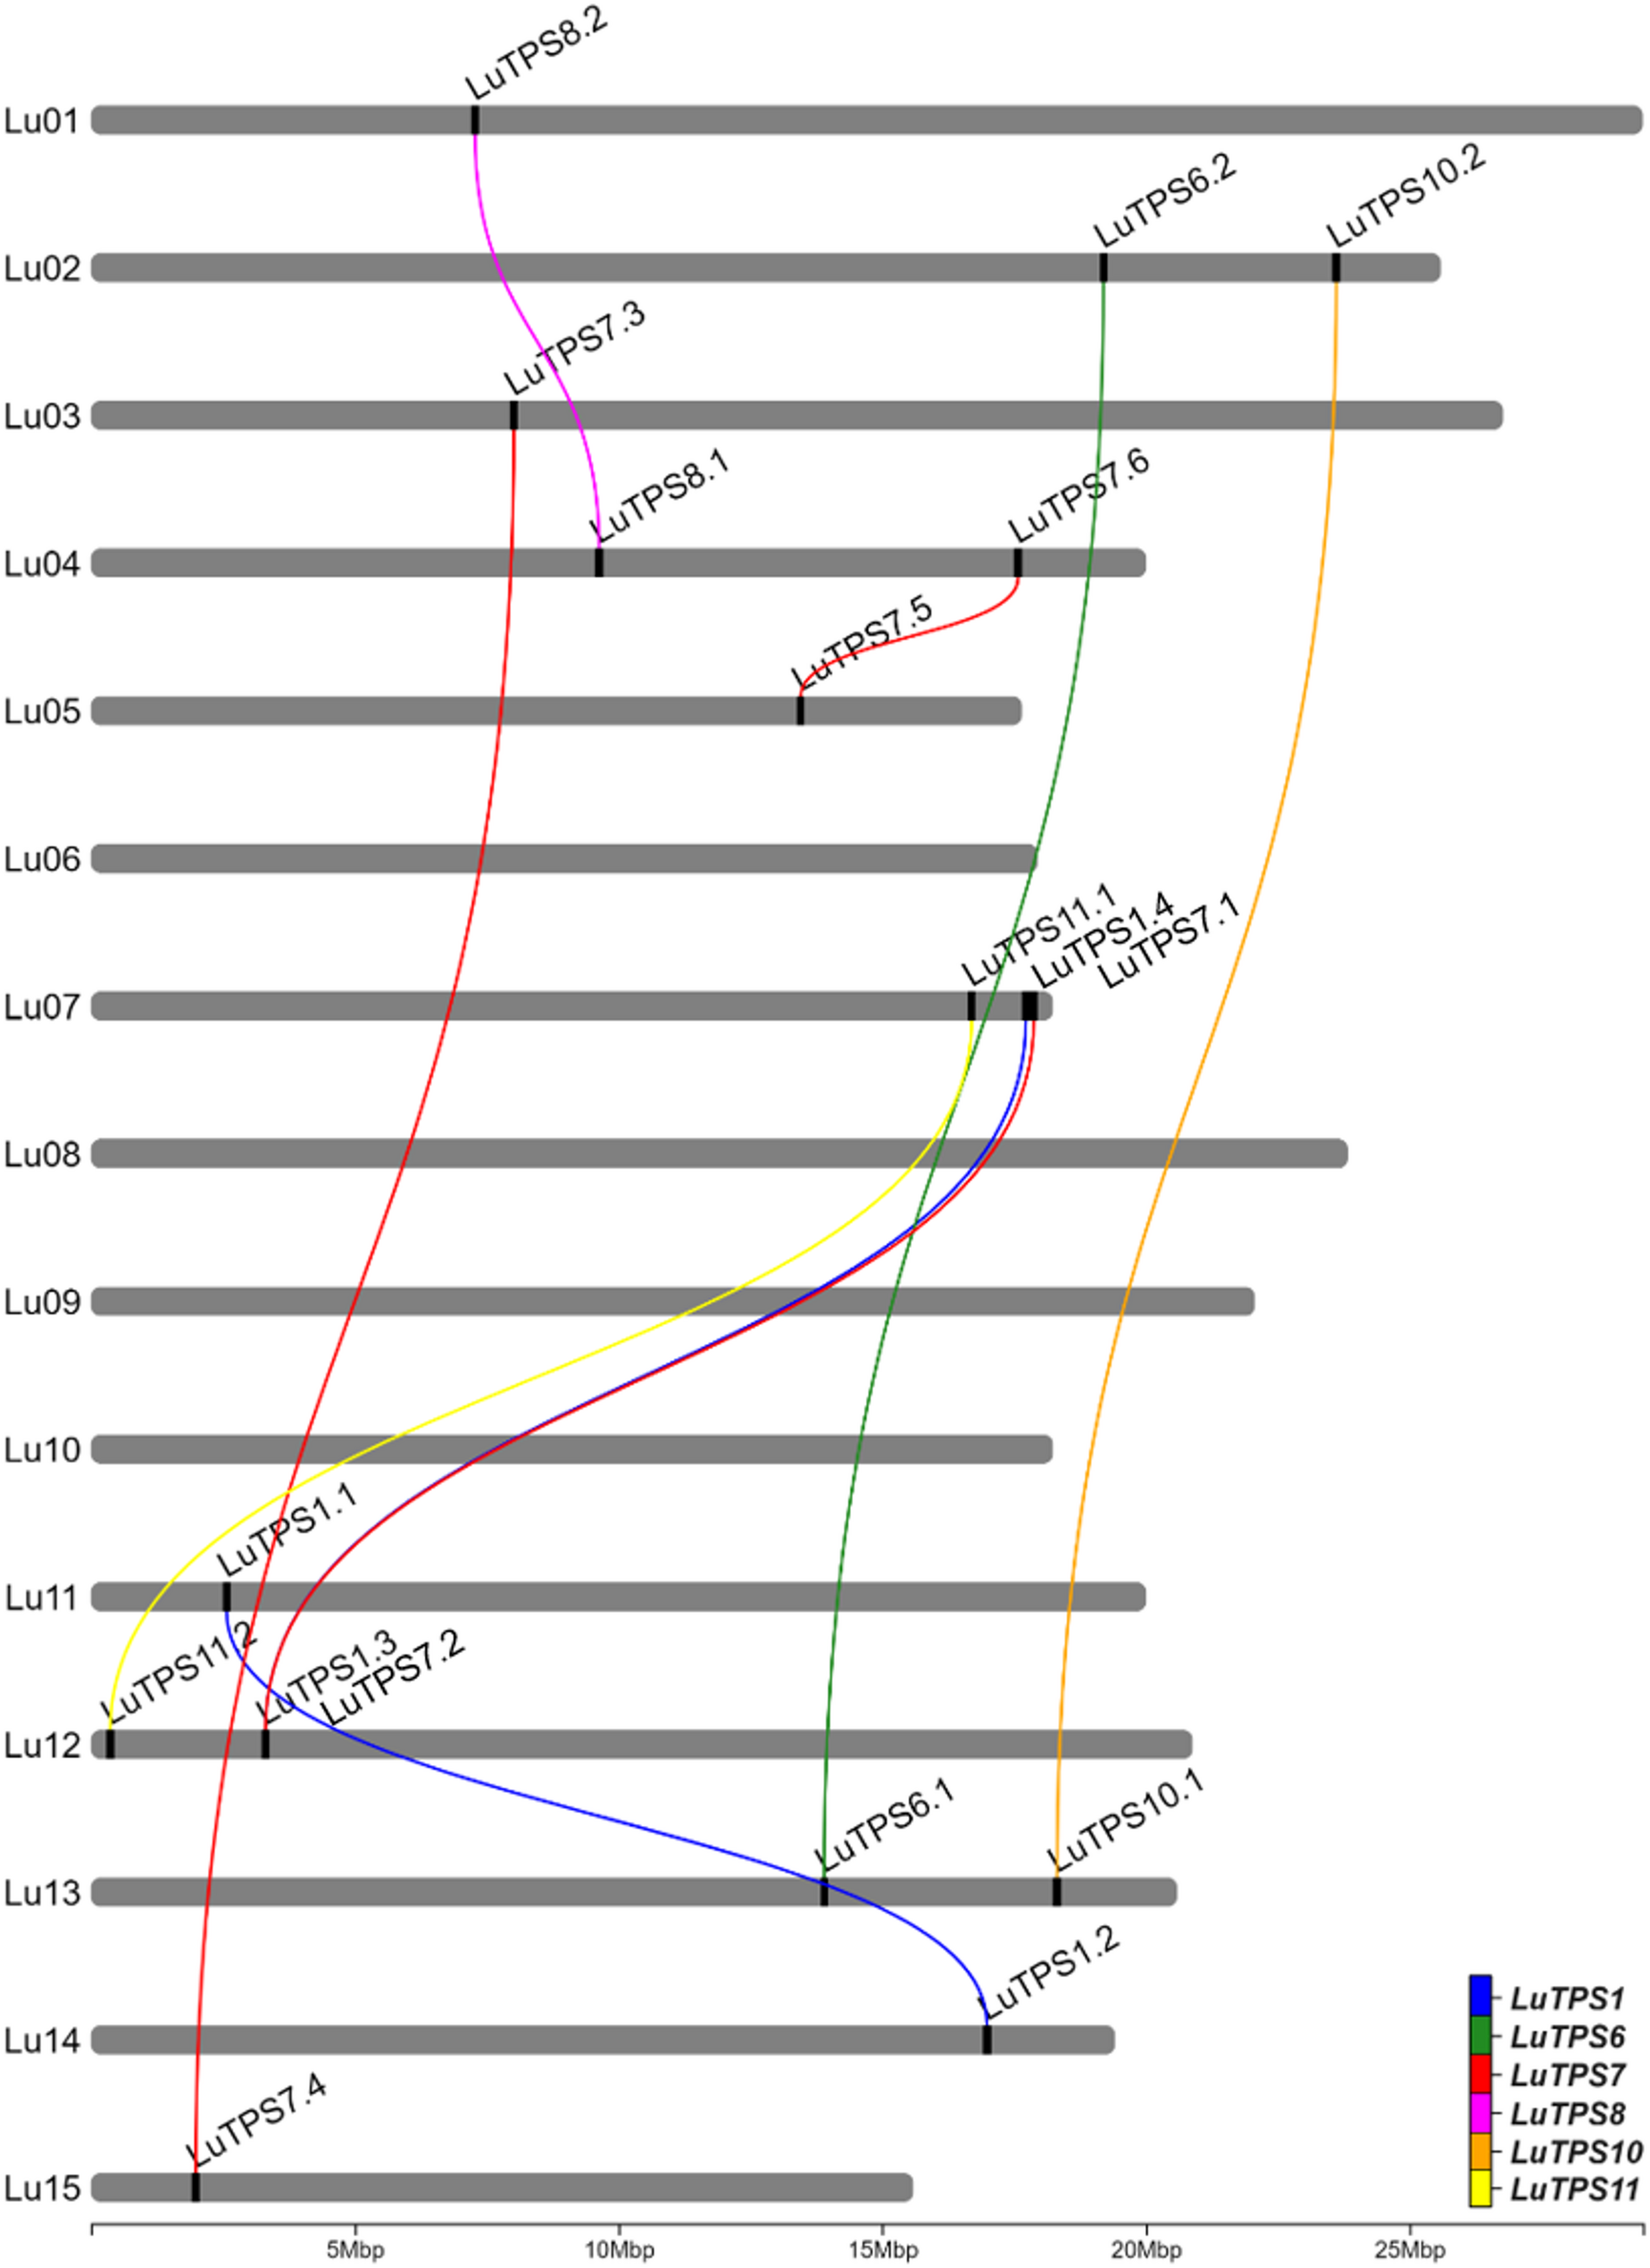
A total of 18 LuTPS genes were identified in silico, distributed across 11 of the 15 linseed chromosomes, excluding Lu06, Lu08, Lu09, and Lu10 (Fig. 1, Table 1). The LuTPS proteins ranged from 800 (LuTPS11.2) to 971 (LuTPS1.1) amino acids long. The predicted isoelectric point (pI) values varied from 5.50 (LuTPS7.6) to 7.05 (LuTPS1.1), with an average pI of 6.08. The predicted localization of the LuTPS proteins varied across different cellular compartments, with the majority localized in the chloroplast (7 proteins), followed by cytoplasm (5 proteins), nucleus (5 proteins), and one in vacuole. The highest number of phosphorylation sites was predicted for LuTPS1.3 and LuTPS1.4 (47 each), followed by LuTPS6.1 and LuTPS6.2 (38 each), and LuTPS1.1 and LuTPS1.2 (34 each), whereas the lowest number of phosphorylation sites was found in LuTPS7.1 and LuTPS7.2 (23 each) (Table 1). The LuTPS1 paralogs exhibited the most complex gene structures, with LuTPS1.1 containing 16 exons and LuTPS1.2, LuTPS1.3, and LuTPS1.4 each containing 17 exons. In contrast, other LuTPS genes displayed simpler structures, with exon numbers ranging from 2 (LuTPS10.2) to 4 (LuTPS11.2) (Figure S1).
Chromosomal positions of trehalose-6-phosphate synthase genes in linseed and their paralogues. Lines connecting TPS genes indicate paralogous relation
Phylogenetic analysis and nomenclature of linseed TPS
The LuTPS genes were named according to their closest Arabidopsis orthologs as identified in the pairwise distance matrix. In cases where multiple linseed genes showed similarity to the same Arabidopsis TPS, they were designated with numerical suffixes indicating their relative similarity to the Arabidopsis ortholog (Table 1). For phylogenetic analysis of LuTPS, the protein sequences of 18 LuTPS along with 11 AtTPS were aligned using t-coffee, and a phylogenetic tree was constructed using the ML method implemented in MEGA 11. The linseed TPS, along with Arabidopsis TPS, clustered into two distinct groups, Cluster 1 and Cluster 2 (Fig. 2). The LuTPS1 paralogues (LuTPS1.1, LuTPS1.2, LuTPS1.3, LuTPS1.4) were found in Cluster 1, alongside the AtTPS1. Cluster 1 also included AtTPS2, AtTPS3, and AtTPS4. Cluster 2 was further divided into three subclusters, 2a, 2b, and 2c. Subcluster 2a contained LuTPS6.1 and LuTPS6.2, along with AtTPS6, as well as AtTPS5. Subcluster 2b was exclusively composed of LuTPS7 (LuTPS7.1, LuTPS7.2, LuTPS7.3, LuTPS7.4, LuTPS7.5, LuTPS7.6) together with AtTPS7. Subcluster 2c included paralogues of LuTPS8 (LuTPS8.1, LuTPS8.2), LuTPS10 (LuTPS10.1, LuTPS10.2), and LuTPS11 (LuTPS11.1, LuTPS11.2), which clustered alongside AtTPS8, AtTPS10, AtTPS11, and AtTPS9.
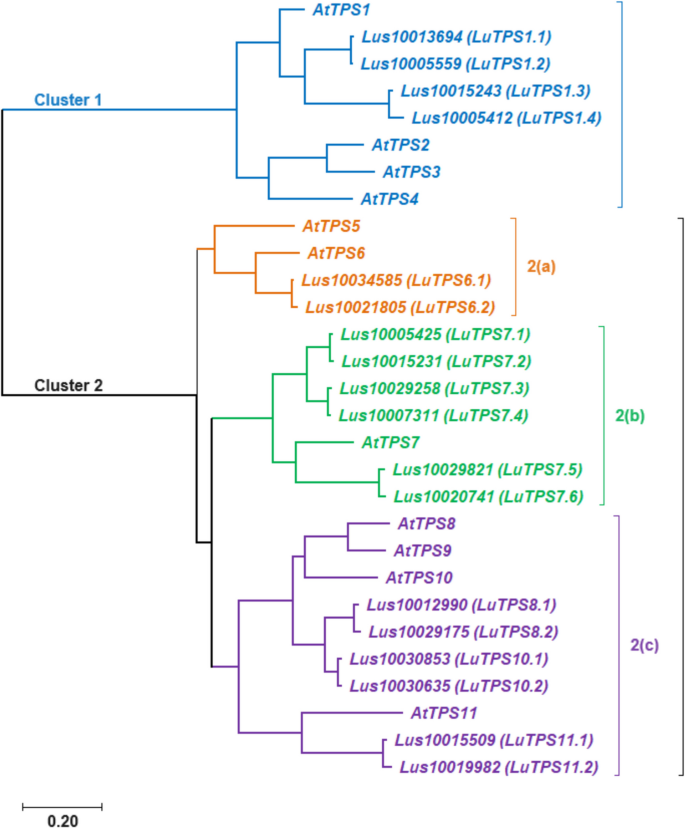
Phylogenetic analysis of trehalose-6-phosphate synthase (TPS) genes from linseed and Arabidopsis thaliana. The TPS genes are grouped into two major clusters, reflecting their evolutionary relationships
Expression analysis of LuTPS genes in vegetative and reproductive tissues
Gene expression profiles of the LuTPS genes in linseed were analyzed from the available transcriptome sequence data across four different tissues, bud at two developmental stages (bud1, bud2), flower, leaf, and stem, using RNA sequencing data from two early flowering-maturing accessions, IC0523807 and IC0525939. LuTPS6.1, LuTPS6.2, and LuTPS10.1 showed relatively higher expression in all the studied tissues including floral buds, flowers, leaf and stem in both the accessions. LuTPS10.1 showed conspicuously high expression in leaf in both the accessions (Fig. 3a, b). Most of the LuTPS genes except LuTPS1.3, LuTPS1.4, LuTPS7.5, and LuTPS7.6 were found expressed in one or more studied tissue types in both the accessions. A few genes showed high expression across all tissues in both the early flowering accessions which included LuTPS7.1, LuTPS7.2, LuTPS7.3, LuTPS7.4, LuTPS8.1, LuTPS8.2, LuTPS10.1, and LuTPS10.2. In contrast, LuTPS1.1, LuTPS1.2, LuTPS11.1, and LuTPS11.2 exhibited relatively higher expression in flower compared to other reproductive and vegetative tissues. Overall, the top most expressing LuTPS genes were LuTPS6.1, LuTPS6.2, and LuTPS10.1.
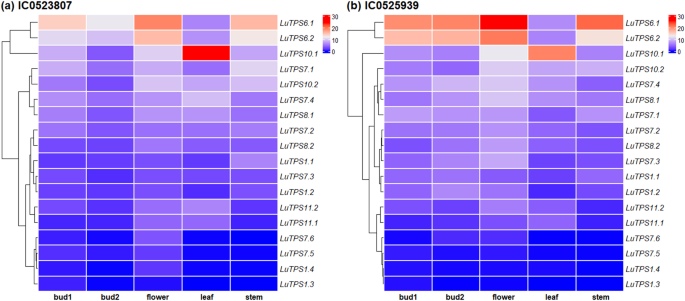
Gene expression profiles of TPS genes in reproductive and vegetative tissues of early-flowering linseed genotypes IC0523807 and IC0525939 based on transcriptome data. Gene names are displayed on the right, with expression-based hierarchical clustering shown on the left. The color gradient from red to blue represents transcript abundance in TPM (Transcripts Per Million), ranging from high to low expression levels
To further pinpoint the potential linseed TPS genes involved in flowering regulation linseed, TPS gene expressions was compared to that of gene expression of important flowering regulators including FLOWERING LOCUS T (FT) (Lus10013532), FRUITFULL (FUL) paralogs (Lus10011349, Lus10021140), SUPPRESSOR OF OVEREXPRESSION OF CONSTANS 1 (SOC1) (Lus10036543), Squamosa Promoter Binding Protein-Like 9 (SPL9) (Lus10007984) using the transcriptome of floral buds at two stages, flowers, leaves and stem of two early flowering linseed accessions IC0523807 and IC0525939 (Fig. 4). A positive correlation of FT was observed only with LuTPS1.1; while FUL (Lus10011349) showed positive correlation with LuTPS1.2, LuTPS6.1, LuTPS6.2, LuTPS7.2, LuTPS7.3, LuTPS7.4 and LuTPS8.2, indicating possible functional redundancy. Interestingly, LuTPS10.1 was the only gene which showed positive correlation with expression of the other FUL paralog (Lus10021140) and SOC1. There was no significant correlation of any TPS gene expression to that of SPL9, indicating no probable role of the latter in regulating TPS gene expression.
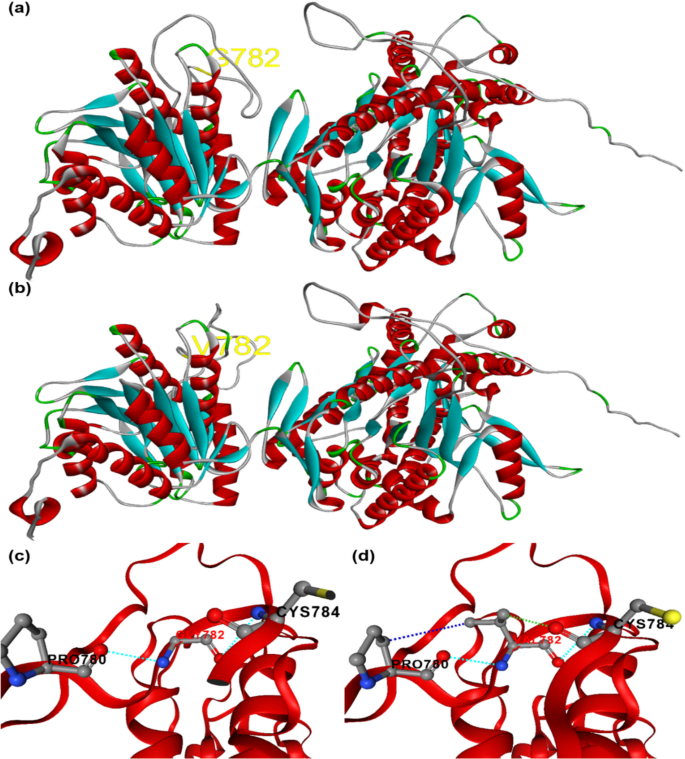
Homology-based 3D structures of the LuTPS10.2 protein variant in linseed, showing the amino acid substitution at position 782: (a) GLY-782 in late-flowering genotypes and (b) VAL-782 in early-flowering genotypes. Intramolecular interactions of the LuTPS10.2 variants are illustrated for (c) GLY-782 and (d) VAL-782
Allelic variation in LuTPS genes in early and late linseed accessions
To investigate the allelic variations in LuTPS gene family, available whole genome sequencing data of two early flowering-maturing (IC0523807, IC0525939) and two late flowering-maturing (EC0115148, EC0718827) linseed germplasm accessions (Bio-project ID-PRJNA1207411; Table S1) was used and the reference-based SNP calling was performed. Trait-specific SNPs (those capable of distinguishing between early and late flowering-maturing accessions) were identified in two genes, LuTPS6.1 (3 SNPs: 2 SNPs in exons, 1 SNP in intron) (Table 2), and LuTPS10.2 (3 SNPs, all in exons) (Table 3). Both the exonic SNPs in LuTPS6.1 gene were synonymous in nature and therefore had no alteration in the protein sequence. Additionally, in the promoter sequence of the LuTPS6.1 gene, a total of 16 SNPs/indels were identified (Table 2). However, these variations in the promoter region did not exhibit any clear pattern associated with early or late flowering phenotypes. In LuTPS10.2, from the 3 SNPs, one SNP was non-synonymous at nucleotide position 2439 (‘G’ in late flowering-maturing group changed to ‘T’ in early flowering-maturing group) which resulted in an amino acid substitution, Glycine (a non-polar amino acid) to Valine (an aliphatic and hydrophobic amino acid) at position 782 in the resulting protein (Table 3, Figure S2). The other two SNPs were synonymous, causing no change in the protein sequence. Further, in the promoter sequence of LuTPS10.2, a total of 9 SNPs, and 18 indels were identified (Table 3). Of these, 10 SNPs exhibited phenotype-specific patterns, differing between early and late flowering-maturing accessions. Further, two insertions of 2 and 11 nucleotides (at position −1117 to −1116 and −627 to −617, respectively) and a single nucleotide deletion (at position−685) were observed in both early flowering accessions.
Effect of amino acid substitution on 3D structure of TPS protein
To evaluate the impact of the amino acid substitution on the LuTPS10.2 protein’s 3D structure, homology-based modeling was performed and the 3D structures of both the original protein (prior to amino acid substitution) and the modified protein (after substitution) were predicted and compared to evaluate any structural changes (Fig. 5a-d). Notably, the proteins from the early flowering-maturing group demonstrated an increase in intramolecular interactions, which typically enhances protein stability (Fig. 5c, d). The substitution of ‘G’ with ‘V’ in the early flowering-maturing group led to a significant reduction in potential energy, contributing to a stabilizing effect on the proteins within these accessions (Table 4).
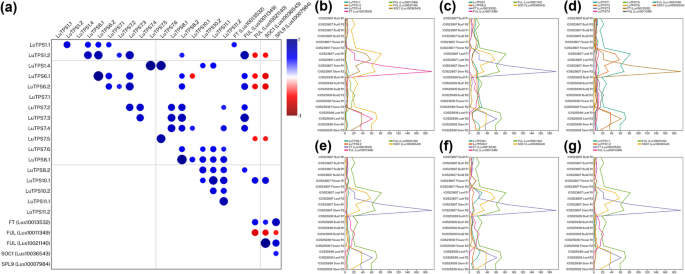
Correlation of expression of TPS genes and key flowering genes FT (Lus10013532), FUL paralogs (Lus10011349, Lus10021140), SOC1 (Lus10036543) and SPL9 (Lus10007984) in linseed. a Pairwise correlation between gene pairs. Color gradient of the circle from blue to red denotes positive to negative correlation. Size of the circle indicates the strength of p value. b, g Line plots depicting the normalized expression (Transcripts per Million) of TPS paralogs and flowering genes across tissues, floral bud 1, bud 2, flower, leaves, and stem in early-flowering linseed accessions IC0525939 and IC0523807. Expression data under NCBI, BioProject ID PRJNA773597 was used
Analysis of CREs in LuTPS genes and their enrichment
2 kb promoter sequences upstream of the start codon of 37,999 linseed genes were extracted from the linseed genome assembly. The position weight matrix data of 2,254 TF binding sites (TFBS) from the PlantPAN 3.0 database were used to predict the occurrence of CRE motifs within these promoter sequences. The CREs within the 2 kb promoter regions of 18 LuTPS genes were identified, and their enrichment was assessed by statistically comparing their frequency against the background frequency across the entire linseed genome (37,999 genes). A total of 32 CREs were identified as significantly enriched in the promoter sequences of LuTPS genes compared to the average genomic distribution at a threshold of q-value ≤ 0.1 (Table 5). Among the significantly enriched CREs, flowering and photoperiod related CREs included TF_motif_seq_0250, TF_motif_seq_0146, TF_motif_seq_0321, TFmatrixID_1221, TFmatrixID_0797, and TF_motif_seq_0481. It is intriguing to note that from the 32 enriched CREs, at least 15 were related to Dof-type domain-containing protein (Table 5). In addition, the promoter sequences of individual LuTPS genes were also analyzed for the presence of CREs using the PlantPAN4 database [62]. The analysis identified a total of 104 CREs, each present at least once in the promoter region of every LuTPS gene (Table S3). It is also important to highlight that six of the enriched CREs (TF_motif_seq_0250, TF_motif_seq_0315, TF_motif_seq_0344, TF_motif_seq_0238, TF_motif_seq_0321, and TF_motif_seq_0458) were consistently present in the promoter of all TPS genes in linseed (Table 5, Table S3).
Genome scale syntenic network analysis of linseed and nine other plant genomes
To understand synteny of TPS genes in different crop plants, The genome scale syntenic network analysis of linseed and nine other plants representing cereals, oilseeds, pulses, and a model plant species (Arabidopsis, rice, barley, wheat, sesame, sunflower, soybean, greengram, and cowpea) was performed. A total of 68,930 conserved syntenic blocks (CSBs) were identified in the studied 10 plant species (Table 6). Among the comparisons, the highest number of CSBs involving linseed was found with soybean, (3,673 CSBs), followed by sunflower (2,159), cowpea (2,092), and sesame (2,018) while barley exhibited the fewest CSBs with linseed (588) (Fig. 6, Figure S3, Table 6). Notably, 179 of the 68,930 CSBs contained at least one LuTPS gene (Table 7). The highest number of LuTPS-containing CSBs was observed between linseed and soybean (43), followed by cowpea (25), sunflower (24), and sesame (22). Linseed itself had 15 intraspecific CSBs with gene counts per CSB ranging from 9 to 399 (Fig. 6, Table 7).
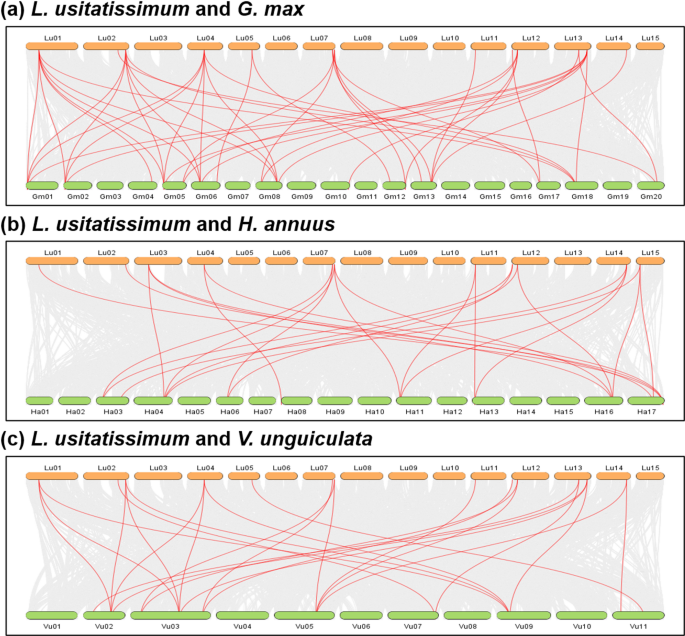
Genome-wide synteny analysis of linseed with soybean (Glycine max) (a), sunflower (Helianthus annuus) (b), and cowpea (Vigna unguiculata) (c). The genome wide conserved syntenic blocks (CSB) between the two species are depicted in grey shade, and the CSBs harbouring linseed TPS are shown with red lines
Syntenic gene collinearity networks (GCN) of linseed TPS
In order to identify LuTPS-specific syntenic block networks (SBN), the 179 CSBs (containing at least one LuTPS gene) were analyzed using Cytoscape software [48]. Accordingly, the 179 CSBs clustered into four distinct SBNs. The interaction of linseed TPS genes within these four SBNs was visualized as nodes (representing genes) and edges (representing syntenic relationships). Consequently, the linseed TPS genes formed four gene collinearity networks (GCN) (Fig. 7). Each node (gene) within the GCN represents the CSB in which this gene was located, while the edges highlight the syntenic relationships between them. The largest cluster, GCN Cluster-I (Fig. 7a), comprised of 35 genes, including 10 linseed TPS genes, LuTPS1.1, LuTPS1.2, LuTPS1.3, LuTPS1.4, LuTPS7.1, LuTPS7.2, LuTPS7.3, LuTPS7.4, LuTPS7.5, and LuTPS7.6. The remaining genes in this GCN were TPS genes from soybean, sunflower, cowpea, sesame, Arabidopsis, greengram, barley, and rice. The highest syntenic relationship for linseed TPS genes was observed with soybean and sunflower (6 genes each), followed by cowpea (4 genes), sesame (2 genes), Arabidopsis (2 genes), greengram (2 genes), rice (2 genes), and barley (1 gene). Within Cluster-I, subcluster-Ia consists of four linseed TPS genes (LuTPS1.1, LuTPS1.2, LuTPS1.3, and LuTPS1.4). Syntenic relationships were observed between LuTPS1.1 & LuTPS1.2, and between LuTPS1.3 & LuTPS1.4, though no direct connections were found between the two pairs. However, connections were observed with TPS genes from other plants, suggesting an ancient duplication event that led to the divergence of these gene pairs. Subcluster-Ia and subcluster-Ib were connected through a syntenic relationship between LuTPS1.2 and LuTPS7.5, facilitated by a TPS gene from greengram (XP_014493970.1). In subcluster-Ib, two linseed TPS genes, LuTPS7.5 and LuTPS7.6, displayed direct syntenic relationships. LuTPS7.5 also showed syntenic connections with TPS genes from cowpea and soybean. Subcluster-Ib was linked to Subcluster-Ic through syntenic relationships involving LuTPS7.5 and LuTPS7.6, both of which exhibited synteny with a TPS gene from sesame (XP_020550607.1). Subcluster-Ic comprised four linseed TPS genes (LuTPS7.1, LuTPS7.2, LuTPS7.3, and LuTPS7.4), all of which exhibited direct syntenic relationships with each other, indicating a high degree of conservation within this group. Cluster II was the smallest, with only 9 genes, including two linseed TPS genes, LuTPS6.1 and LuTPS6.2, which did not share direct syntenic interactions (Fig. 7b). Other genes in this cluster were from soybean, cowpea, greengram, sesame, and an Arabidopsis UDP-Glycosyltransferase/trehalose-phosphatase family protein (NP_001322467.1). LuTPS6.1 displayed direct syntenic connections with 7 genes, including the Arabidopsis gene, whereas LuTPS6.2 was connected with TPS genes from soybean, cowpea, greengram, and sesame. Interestingly, this cluster appears specific to dicot species, as no TPS genes from monocots (rice, barley, and wheat) were represented. Cluster III, containing 23 genes, featured four linseed TPS genes, LuTPS8.1, LuTPS8.2, LuTPS10.1, and LuTPS10.2 displaying direct syntenic relationships with one another (Fig. 7c). Other genes in the cluster are from soybean, cowpea, Arabidopsis, sunflower, sesame, greengram, and rice. Notably, wheat and barley TPS genes are absent from this cluster. LuTPS8.1 and LuTPS8.2 both interacted with 18 other TPS genes. The syntenic relationship with the sunflower TPS gene (XP_021976108.1) was specific to LuTPS8.1, while LuTPS8.2 uniquely showed interaction with the soybean TPS gene (XP_006578621.1). Additionally, both LuTPS10.1 and LuTPS10.2 demonstrate syntenic connections with 17 other TPS genes. Cluster IV consists of 17 genes, including two linseed TPS genes, LuTPS11.1 and LuTPS11.2, alongside TPS genes from other species (Fig. 7d). Notably, LuTPS11.1 and LuTPS11.2 exhibited a direct syntenic relationship with each other. Additionally, LuTPS11.1 displayed syntenic connections with all 16 other genes in the cluster, whereas LuTPS11.2 was syntenically linked to 14 genes, with the exceptions being the TPS genes from rice (XP_015610911.1) and soybean (XP_006593555.1). Notably, this cluster included TPS genes from all the ten plant species under study.
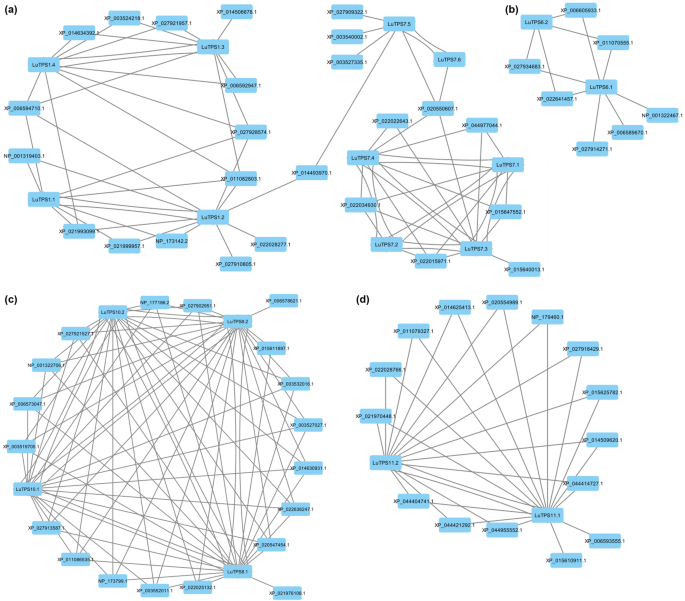
Gene collinearity networks (GCNs) derived from conserved syntenic blocks (CSBs) containing TPS genes. Four GCN clusters (I–IV) are shown in panels (a–d). Each node represents a gene, annotated with the corresponding CSB, and edges indicate syntenic relationships between genes
To study if any of the genes in the linseed TPS specific CSBs also show any molecular interactions with TPS, we studied protein–protein interaction (PPI) network of TPS using the STRING database. The potentially interacting partners of each linseed TPS have been given in Table S4. There were a total of 27 unique interacting proteins identified for all 18 linseed TPS. Most linseed TPS paralogues shared the same interacting partners. Three of the interacting proteins, Lus10017984 (Uncharacterized protein), Lus10038739 (Hexosyltransferase), and Lus10041979 (Sucrose synthase) were part of the linseed TPS specific CSBs. Of which, Lus10017984 (Uncharacterized protein) showed PPI with LuTPS1.1, LuTPS1.2, LuTPS11.2. The other proteins, Lus10041979 (Sucrose synthase) showed PPI with 6 linseed TPS (LuTPS1.1, LuTPS1.2, LuTPS1.3, LuTPS1.4, LuTPS6.1, LuTPS6.2), whereas Lus10038739 (Hexosyltransferase) showed PPI specifically with LuTPS6.1, LuTPS6.2 (Table S4, Fig. 8a). From the 18 LuTPS, for the top ten expressing TPS genes (LuTPS6.1, LuTPS6.2, LuTPS10.1, LuTPS10.2, LuTPS7.1, LuTPS7.2, LuTPS7.3, LuTPS7.4, LuTPS8.1, LuTPS8.2) (Fig. 3), PPI network was drawn (Fig. 8a). For these 10 TPS, there were 20 unique interacting proteins, consisting mainly, trehalose 6-phosphate phosphatases, glucose-1-phosphate adenylyltransferase, sucrose-phosphate synthase, hexosyltransferase etc. (Table S5). The co-expression analysis of these TPS genes with the interacting partners was done using the transcriptome data of two early flowering linseed accessions in floral buds at two stages, flowers, leaves and stem (Fig. 8b). Correlation analysis of LuTPS and their respective interacting partners showed significant positive correlation of Lus10038739 (Hexosyltransferase) with six TPS genes, LuTPS6.1, LuTPS6.2, LuTPS10.2, LuTPS7.1, LuTPS7.2, and LuTPS8.2 (Fig. 8c). Interestingly, Lus10041979 (Sucrose synthase) showed significant positive and negative correlation with LuTPS7.1 and LuTPS10.1, respectively. Five of the ten potential interacting partners of LuTPS6.1 and LuTPS6.2 showed positive correlation with them, which included hexosyltransferases (Lus10038739, Lus10003045), starch synthases (Lus1003324, Lus10008279), and glucose-1-phosphate adenylyltransferase (Lus10023553). It is interesting to note that all linseed TPS, except LuTPS6.1 and LuTPS6.2 showed at least one of the interacting partners as trehalose 6-phosphate phosphatase.
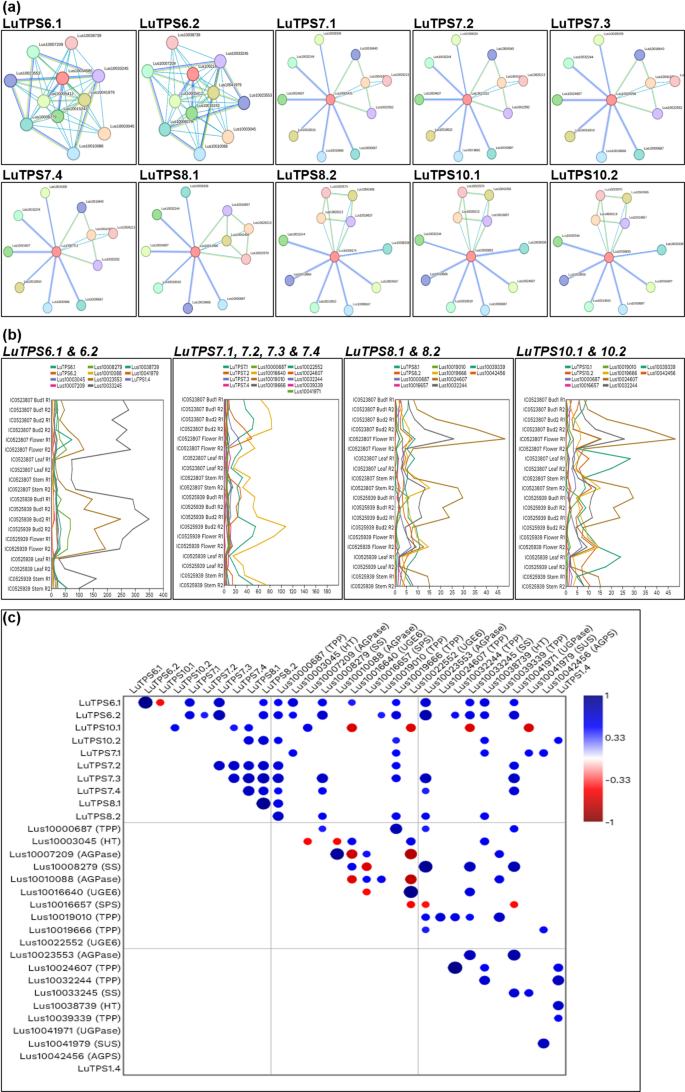
LuTPS protein–protein interactions and co-expression with the potential interacting genes. a Protein–protein interaction network of linseed TPS as identified using string database. The central node with red color is TPS protein, other nodes with different colors indicate the interacting protein and edges indicate their interactions. b Co-expression of TPS genes and respective potential interacting partners in floral buds at two developmental stages, flower, leaf and stem in two biological replicates of early flowering linseed genotypes IC0523807 and IC0525939 based on transcriptome data. The gene expression value is in TPM. c Correlation of gene expression of linseed TPS genes and their potential interacting partners. Size of the circle indicates the strength of p value and color gradient of the circle from blue to red denotes positive to negative correlation