Comparative untargeted metabolomic profiling of three tea cultivars
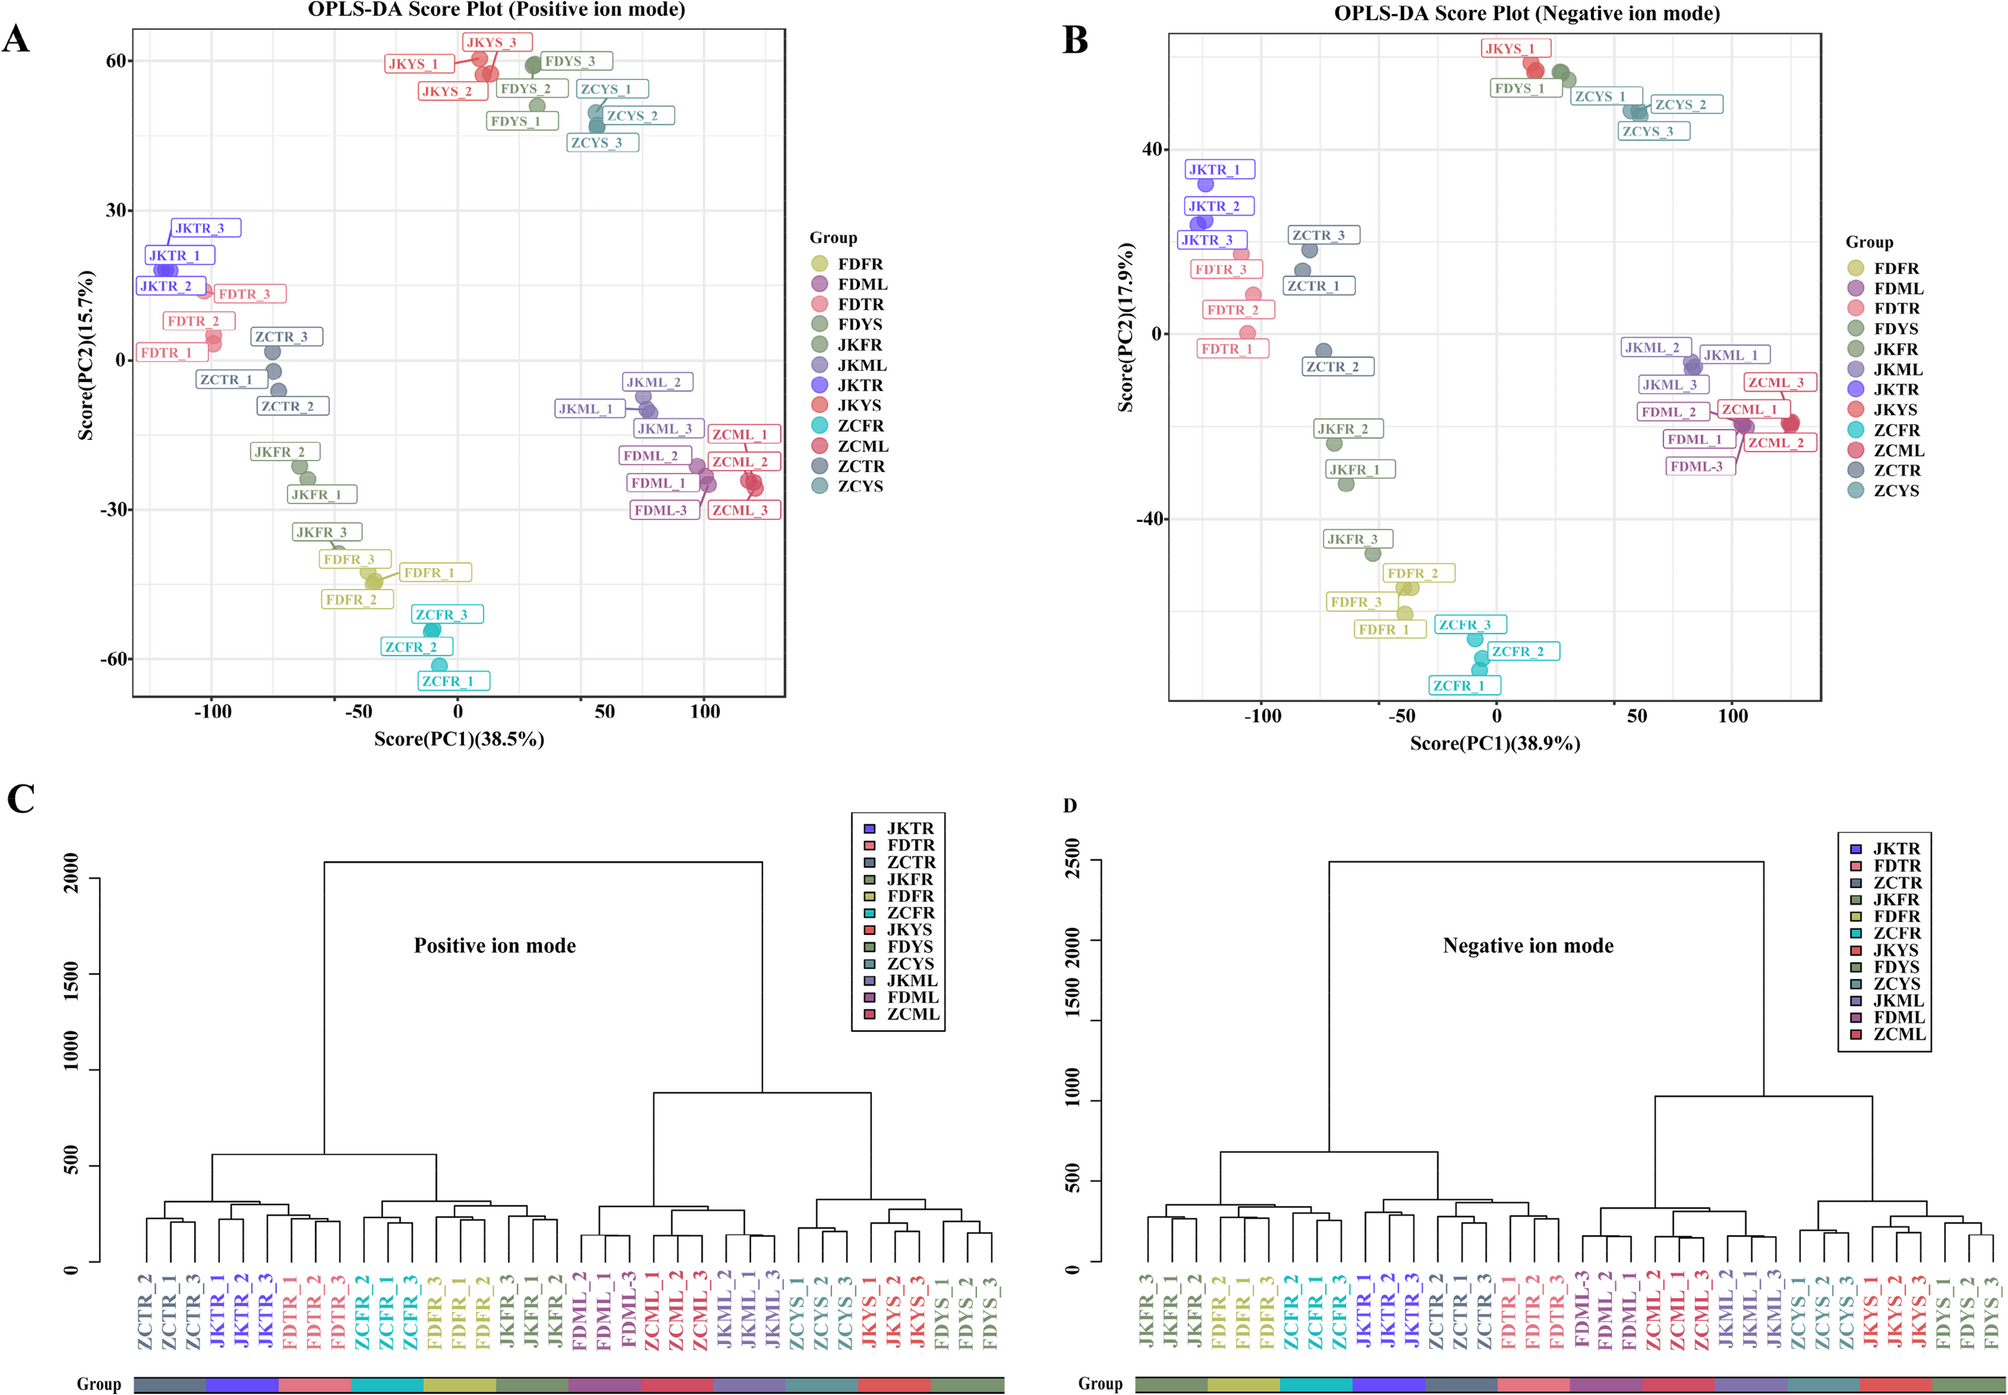
To evaluate the metabolic adaptability of the tea cultivars ‘Zhongcha108’ (ZC), ‘Fuding Dabaicha’ (FD), and ‘Jiukeng’ (JK) under the environmental conditions of Ju’nan, a comprehensive untargeted metabolomics analysis was performed using UHPLC-MS. A total of 15,343 clean retention time-exact mass pairs in positive mode (accounting for 84.01%) and 168,869 in negative mode (83.83%) were detected in the samples. Those high-quality mass pairs were retained for downstream statistical analysis. Principal component analysis (PCA) revealed tight clustering of the QC samples (Fig. S2), indicating consistent instrument performance and reliable data acquisition. The orthogonal partial least squares-discriminant analysis (OPLS-DA) plots displayed clear metabolic differentiation among the four tissue types across the three tea cultivars under both ionization modes (Fig. 1A, B). This was further supported by hierarchical clustering (HCA) analysis, which demonstrated that each cultivar possessed a unique metabolite profile (Fig. 1C, D). In total, 854 metabolites were putatively identified across the three tea cultivars shown in Table S2. The detail information such as retention time (RT), mass-to-charge ratio (m/z) values, exact mass, formula and precursor type were included. These compounds encompassed a broad range of chemical categories, including 100 carboxylic acids and derivatives, 54 benzene-related compounds, 54 organooxygen compounds, 52 fatty acyls, 42 flavonoids, 42 prenol lipids, 23 steroids and their analogs, 19 organonitrogen compounds, as well as 15 azacyclics, 15 imidazopyrimidines, 15 phenolic compounds, 10 indole derivatives, among others. These findings highlighted the extensive biochemical diversity and cultivar-specific metabolic profiles of tea plants grown in this region.
OPLS-DA score plots and hierarchical cluster for metabolic profiling analysis in positive (A) (C) and negative (B) (D) ion modes. The score of variation explained by each principal component is indicated on the axes. Each point corresponded to a plant sample, and different colors indicated the different cultivar tissues. ZC, ‘Zhongcha108’; FD, ‘Fuding Dabaicha’; JK, ‘Jiukeng’; YS, young shoots (one bud with two leaves); ML, mature leaves; TR, taproots, and FR, fibrous roots. Similarity assessment for clustering was based on the Euclidean distance coefficient and the average linkage method
Tissue-specific metabolic variations among three tea cultivars
To explore the metabolic differences contributed to cultivar variation, a pairwise comparative analysis was conducted among the ZC, FD, and JK tea cultivars across different tissue types. Significantly differential metabolites (SDMs) were identified based on the following criteria: VIP value ≥ 1 from the OPLS-DA model, p < 0.05, and a fold change (FC) ≥ 1.5 or ≤ 0.67. Metabolites with significant increase or decrease abundance in one cultivar compared to the other two were defined as cultivar-specific differential metabolites (CSDMs).
In ZC, a total of 94 CSDMs were identified in young shoots, 121 in mature leaves, 34 in taproots, and 36 in fibrous roots (Fig. 2). For FD, the corresponding numbers were 48, 142, 28, and 19 (Fig. 2). In the case of JK, 43 CSDMs were identified in young shoots, 110 in mature leaves, 33 in taproots, and 24 in fibrous roots (Fig. 2). These findings underscored the metabolic diversity among tea cultivars and revealed that mature leaves tended to harbor the highest number of cultivar-specific metabolites across all genotypes examined.
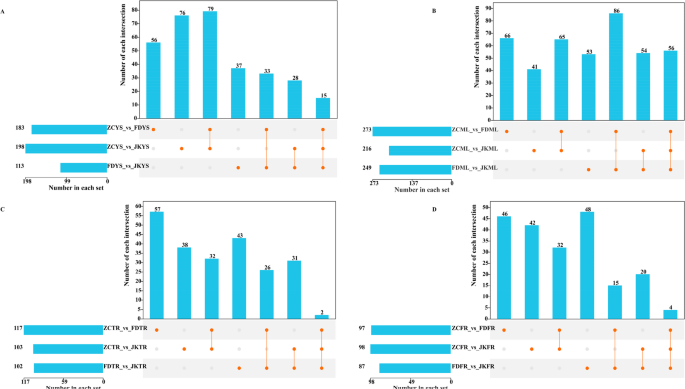
Upset Venn diagram of CSDMs in young shoots (YS) (A), mature leaves (ML) (B), tap roots (TR) (C) and fibrous roots (FR) (D) of ‘Zhongcha108’, ‘Fuding Dabaicha’, and ‘Jiukeng’ tea cultivars
To gain insights into the biological roles of the CSDMs, all identified CSDMs were matched against the KEGG database for pathway enrichment analysis. In the aerial tissues of the three tea cultivars, a substantial number of CSDMs were associated with the “flavonoid biosynthesis (ko00941)” and “phenylpropanoid biosynthesis (ko00940)” pathways. However, distinct pathway enrichments were also observed among cultivars. In ZC, the CSDMs from young shoots showed additional enrichment in “galactose metabolism (ko00052)” and “flavone and flavonol biosynthesis (ko00944)”. In contrast, young shoots of FD were particularly enriched in “arachidonic acid metabolism (ko00590)”, while its mature leaves exhibited specific enrichment in amino acid-related pathways (Fig. 3).
For belowground tissues, the metabolic patterns were more cultivar-dependent. In ZC, taproot-specific metabolites were significantly associated with pathways such as “limonene and pinene degradation (ko00903)”, “flavonoid biosynthesis (ko00941)”, and “phenylalanine, tyrosine and tryptophan biosynthesis (ko00400)”. In its fibrous roots, metabolites were enriched in “citrate cycle (ko00020)”, “pyruvate metabolism (ko00620)”, and “ABC transporters (ko02010)” (Fig. 3A). In FD, CSDMs from tap roots were predominantly enriched in lipid-associated pathways, such as “linoleic acid metabolism (ko00591)”, “fatty acid biosynthesis (ko00061)”, “biosynthesis of unsaturated fatty acids (ko01040)”, and “alpha-linolenic acid metabolism (ko00592)”. However, no significant pathway enrichment was observed for CSDMs in its fibrous roots (Fig. 3B). As for JK, the CSDMs in tap roots were only significantly enriched in “flavonoid biosynthesis (ko00941)”, whereas fibrous roots displayed enrichment in “arginine and proline metabolism (ko00330)” and “synthesis and degradation of ketone bodies (ko00072)” (Fig. 3C). Based on the enrichment analysis, flavonoids, sugars and sugar alcohols, as well as fatty acids were preliminarily identified as key metabolite classes for further analysis. These compounds were well known for their roles in antioxidant defense, osmotic regulation, and membrane remodeling, respectively. Thereby they might contribute to the cultivar-specific metabolic strategies that enable ZC, FD, and JK to cope with the environmental conditions of Ju’nan.
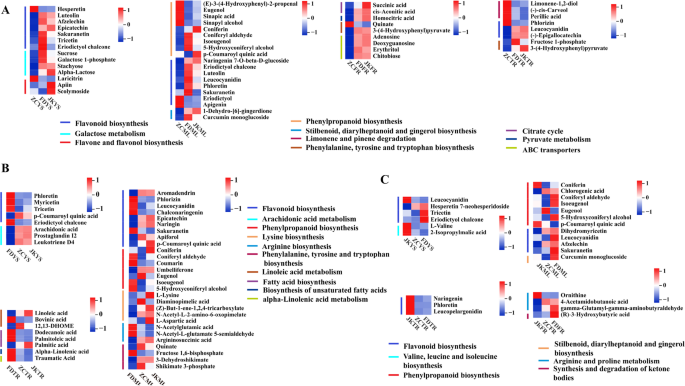
The levels of CSDMs that significantly (p value ≤ 0.05) enriched in the KEGG pathways were visualized using heatmap in (A) ‘Zhongcha108’, (B) ‘Fuding Dabaicha’, and (C) ‘Jiukeng’ tea cultivars. Z-score normalization was applied to the data, and the red color indicated the higher level, the blue color indicated lower level. Vertical lines represented the metabolites involved in the certain pathway indicating in the legends
Transcriptomic profiling across different tissues of three tea cultivars
To investigate whether the observed metabolite variations among the three tea cultivars were in accordance with transcriptional changes, RNA sequencing was conducted on the samples. A total of 36 cDNA libraries were constructed. High-throughput sequencing yielded a total of approximately 234.40 Gb of high-quality clean data. All sequence data had been submitted to the NCBI Sequence Read Archive (SRA accession: PRJNA1213152, https://www.ncbi.nlm.nih.gov/bioproject/PRJNA1213152). Each library generated over 40 million clean reads on average, with base quality scores (Q30) exceeding 89.24%. Alignment to the reference genome showed that 72.15% to 89.26% of the reads were successfully mapped, with 58.41% to 74.80% being uniquely aligned (Table S3). Pearson correlation analysis (Fig. 4) demonstrated strong consistency among the biological replicates, particularly in the root tissues (TR and FR), which exhibited higher correlation coefficients than the in aboveground tissues (YS and ML). This trend was consistent with the hierarchical clustering results obtained from the untargeted metabolomic data, indicating coordinated variation at both transcriptomic and metabolic levels across different cultivars and tissues.
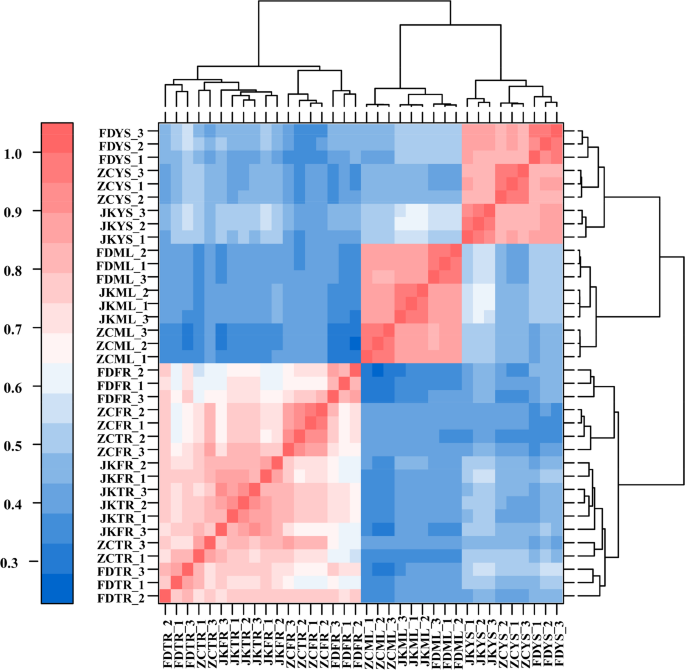
Correlation analysis of the average expression of 36 samples. The block on the heat map represents the correlation between two samples on the horizontal and vertical axes. The red and blue color indicated the positive and negative correlation, respectively
Differential expression profiling among three tea cultivars
To investigate transcriptomic variation among the tea cultivars under the environmental condition of Ju’nan, pairwise comparisons of gene expression were conducted across four tissue types, resulting in a total of 31,283 significantly differentially expressed genes (SDEGs). These comparisons included all possible combinations among ZC, FD, and JK in YS, ML, TR, and FR, including ZCYS_ vs. _FDYS, ZCYS_ vs. _JKYS, FDYS_ vs. _JKYS, and so on for the other tissues. To extract cultivar-specific transcriptional features, SDEGs were further filtered using stringent criteria: adjusted p value ≤ 0.01 and fold change (FC) ≥ 1.5 or ≤ 0.67. Genes meeting these thresholds and showing consistent up- or down-regulation in one cultivar compared to the other two were defined as cultivar-specific differentially expressed genes (CSDEGs). Based on this refined selection, ZC cultivar exhibited 5,591 CSDEGs in young shoots, 5,929 in mature leaves, 1,443 in taproots, and 3,036 in fibrous roots (Fig. 5). For FD, 3,607, 4,577, 1,384, and 4,185 CSDEGs were detected in the respective tissues (Fig. 5). In the case of JK, the numbers were 4,558 in young shoots, 5,291 in mature leaves, 1,448 in taproots, and 3,576 in fibrous roots (Fig. 5). These results highlighted distinct tissue- and cultivar-dependent transcriptional regulation patterns.
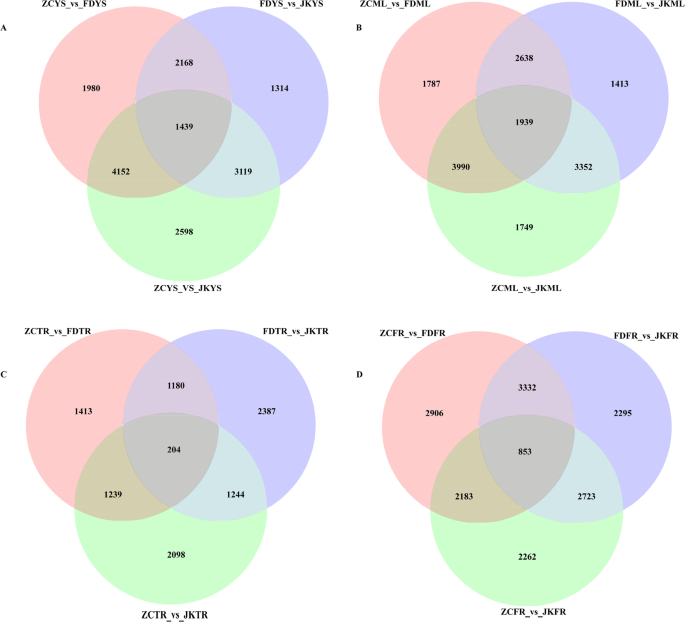
Venn diagram of CSDEGs in young shoots (YS) (A), mature leaves (ML) (B), tap roots (TR) (C) and fibrous roots (FR) (D) of ‘Zhongcha108’, ‘Fuding Dabaicha’, and ‘Jiukeng’ tea cultivars
Transcriptomic dissection of phenylpropanoid biosynthesis among three tea cultivars
Based on the KEGG annotation of cultivar-specific differential metabolites (CSDMs), variations in phenylpropanoid metabolism were observed in young shoots and mature leaves of the three tea cultivars. To further investigate the molecular basis underlying these metabolic differences, we performed a detailed analysis of gene expression involved in the phenylpropanoid biosynthetic pathway.
A total of 133 genes encoding key enzymes in this pathway were differentially expressed in at least one tissue comparison (Fig. 6, Table S4). These included 5 phenylalanine ammonia-lyases (PAL), 1 cinnamate 4-hydroxylase (C4H), 5 4-coumarate-CoA ligases (4CL), 2 caffeoylshikimate esterases (CSE), 21 cinnamoyl-CoA reductases (CCR), 42 shikimate O-hydroxycinnamoyltransferases (HCT), 1 C3′H monooxygenase, 2 caffeic acid 3-O-methyltransferases (COMT), 2 ferulate 5-hydroxylases (F5H), 4 caffeoyl-CoA O-methyltransferases (CCoAOMT), 5 coniferyl aldehyde dehydrogenases (REF1), 7 cinnamyl-alcohol dehydrogenases (CAD), and 35 peroxidases.
As presented in the Fig. 6, expression of these genes varied greatly between tissues and cultivars. All five PAL genes (CSS0041448, CSS0010367, CSS0021474, CSS0001442, CSS0048281) exhibited higher expression in young shoots compared to mature leaves, with FD exhibiting the lowest expression levels in shoots. The sole C4H gene (CSS0011139) showed a consistent shoot-enriched pattern across all cultivars, with peak expression in FD. 4-Coumarate-CoA ligase catalyzes the third reaction in the general phenylpropanoid pathway, generating p-coumaroyl-CoA in an ATP-dependent process [32]. Among the 4CL genes, CSS0003013 and Camellia_sinensis_newGene_35622 displayed notably higher expression in ZC shoots, while FD leaves contained distinct 4CL with elevated expression level. The HCT family, which plays a key role in lignin synthesis, exhibited clear tissue-specific patterns. Most HCT genes were high expressed in shoots than in mature leaves, with 7, 12, and 12 members preferentially expressed in ZC, FD, and JK, respectively. Expression of the cytochrome P450-dependent monooxygenase gene C3′H was notably higher in shoots of FD and JK. For CCoAOMT, expression levels peaked in either the young shoots or mature leaves of JK, while the two COMT genes showed highest expression levels in ZC mature leaves and JK young shoots respectively. Of the two F5H genes, one was highly expressed in FD shoots, while the other showed relatively uniform expression in mature leaves across cultivars. CCR genes were predominantly expressed in mature leaves across cultivars, although six members in ZC were strongly expressed in young shoots, and other six expressed peaked in JK leaves. CAD genes, involved in the terminal step of monolignol biosynthesis, were generally expressed higher in mature leaves than young shoots, and most of these genes expressed highest in the mature leaves of ZC. In contrast, peroxidase genes, which mediate lignin polymerization [33], were more highly expressed in young shoots of all three cultivars. The FD young shoots had the least genes with highest expression levels. CSE genes showed elevated expression in both young shoots and mature leaves of FD and JK. REF1 was found to possess dehydrogenase activity toward both sinapaldehyde and coniferaldehyde, facilitating their oxidation into the corresponding carboxylic acids [34]. REF1 genes were most highly expressed in ZC, potentially contributing to its distinct lignin composition.
Altogether, the cultivar- and tissue-specific transcriptional regulation of phenylpropanoid pathway genes likely underpinned the observed variations in secondary metabolite accumulation, particularly those associated with lignin biosynthesis production.
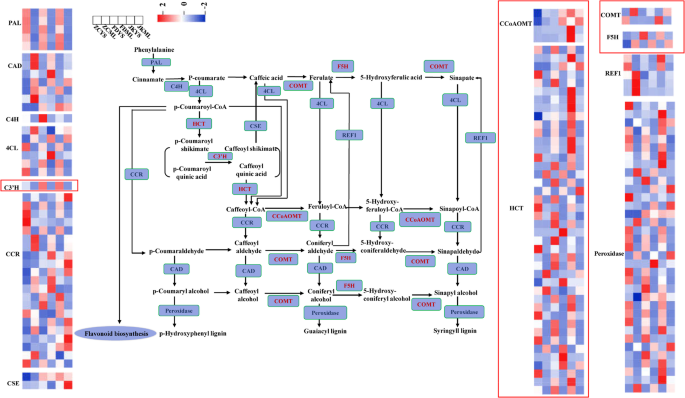
The pathways of phenylpropanoid biosynthesis enriched by KEGG analysis. The color of the rectangles indicated the expression of genes in the young shoots and mature leaves of ‘Zhongcha108’, ‘Fuding Dabaicha’, and ‘Jiukeng’ tea cultivars. Z-score normalization was applied to the data. Key genes were labeled in red color and the expression levels of these genes were highlighted by the red boxes
Expression profiles of flavonoid biosynthesis genes in three tea cultivars
To determine whether the expression patterns of flavonoid biosynthesis-related genes aligned with flavonoid accumulation in the aerial tissues of the three tea cultivars, genes involved in this metabolic pathway were examined. A total of 44 genes encoding key enzymes in flavonoid biosynthesis were identified from the transcriptomic dataset (Fig. 7). These included 4 chalcone synthase (CHS), 8 chalcone isomerase (CHI), 7 flavonol synthase (FLS), 1 flavone synthase II (FNS II), 4 phlorizin synthase (PGT1), 3 flavanone 7-O-glucoside 2’’-O-beta-L-rhamnosyltransferase (C12RT1), 1 naringenin 3-dioxygenase (F3H), 1 flavonoid 3′,5′-hydroxylase (F3′5′H), 9 dihydroflavonol 4-reductase (DFR), 2 anthocyanidin reductase (ANR), 2 anthocyanidin synthase (ANS), and 2 leucoanthocyanidin reductase (LAR) genes (Table S5).
A divergent expression landscape of these genes was observed across the three cultivars. As shown in Fig. 7, the expression levels of these genes varied significantly between young shoots and mature leaves in each cultivar. The following genes exhibited higher expression in either young shoots or mature leaves in ZC cultivar, including two CHS genes (CSS0004474, CSS0030597), four CHI genes (CSS0034202, CSS0028549, CSS0010290, CSS0035109), three PGT1 genes (CSS0004506, CSS0044620, CSS0011112), two C12RT1 genes (CSS0029726, CSS0019095), three FLS genes (Camellia_sinensis_newGene_18377, CSS0046529, CSS0033075), one ANS gene (CSS0010687), two LAR genes (CSS0027461, CSS0013982), and one F3′5′H gene (CSS0022212). For FD, three CHS genes (CSS0019002, CSS0007714, CSS0017197), two CHI genes (CSS0029305, CSS0050436), two FLS genes (CSS0007481, CSS0045924), one FNS II gene (CSS0007273), one F3H gene (CSS0019002), and three DFR genes (CSS0011557, CSS0016543, CSS0030876) showed higher expression in either young shoots or mature leaves. In JK, higher expression levels were observed for two CHI genes (CSS0025506, CSS0046350), two FLS genes (CSS0028720, CSS0007745), one C12RT1 gene (CSS0011196), six DFR genes (CSS0033346, CSS0024095, CSS0033342, CSS0009596, CSS0042695, CSS0003473), and one ANS gene (CSS0046216) in either young shoots or mature leaves. Certain gene subsets showed cultivar-specific high expression, suggesting differential regulation of flavonoid biosynthesis across cultivars and tissues.
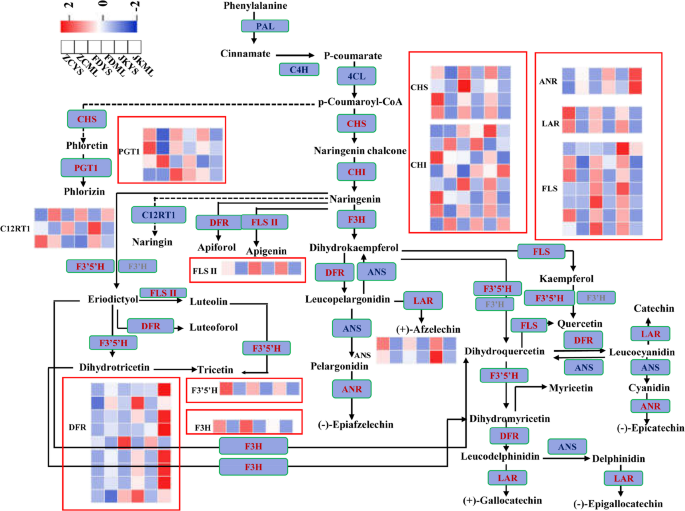
The pathways of flavonoid biosynthesis enriched by KEGG analysis. The color of the rectangles indicated the expression of genes in the young shoots and mature leaves of ‘Zhongcha108’, ‘Fuding Dabaicha’, and ‘Jiukeng’ tea cultivars. Z-score normalization was applied to the data. Key genes were labeled in red color and the expression levels of these genes were highlighted by the red boxes
Gene expression related to fatty acid biosynthesis and metabolism in three tea cultivars
Given that the CSDMs in FD roots were mainly enriched in pathways associated with fatty acid accumulation, which differed from those of ZC and JK, the expression of genes involved in fatty acid biosynthesis and metabolism was examined to further explore the potential molecular mechanisms (Fig. 8, Table S6). In the alpha-linolenic acid metabolic pathway, 31 genes encoding related enzymes were identified, including 1 TAG lipase (TGL4), 13 phospholipase A1 (DAD1), 2 alpha-dioxygenase (DOX), 5 linoleate 9 S-lipoxygenase 6 isoform X2 (LOX2S), 3 alcohol dehydrogenase class-P (ADH1), 2 hydroperoxide dehydratase (AOS), 2 allene oxide cyclase (AOC), 2 chloroplastic oxoene reductase (CEQORH), 4 12-oxophytodienoic acid reductase (OPR), 1 OPC-8:0 CoA ligase 1(OPLC1), 6 acyl-CoA oxidase (ACX), 2 acetyl-CoA acyltransferase 1 (ACCA1) and 2 jasmonate O-methyltransferase (JAMTF) genes. These genes were predominantly expressed at higher levels in the fibrous or tap roots of FD than that of JK and ZC (Fig. 8A). In the linoleic acid metabolism pathway, one PLA2G gene (secretory phospholipase A2) and two LOX1_5 genes (linoleate 9 S-lipoxygenase) showed higher expression levels in FD fibrous roots (Fig. 8B). Additionally, most genes associated with the general fatty acid biosynthesis pathway (Fig. 8C) and unsaturated fatty acid biosynthesis pathway (Fig. 8D) exhibited relatively higher expression in FD root tissues compared to that of JK and ZC. The comparative analysis of fatty acid biosynthesis and metabolism-related gene expression among the three tea cultivars revealed that FD exhibited distinct gene expression features in its root tissues. These findings highlighted fatty acid metabolism as a potential cultivar-specific adaptive trait in FD roots.
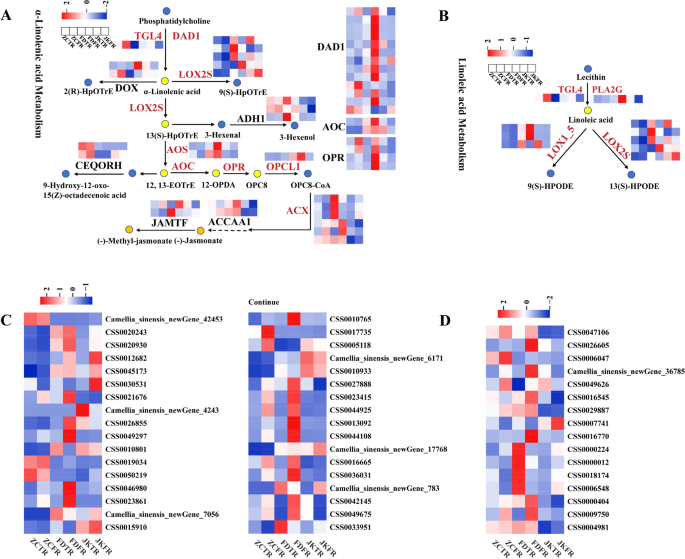
The pathways of fatty acid biosynthesis and metabolism enriched by KEGG analysisin the fibrous roots and taps roots of ‘Zhongcha108’, ‘Fuding Dabaicha’, and ‘Jiukeng’ tea cultivars. A Genes involved in the α-linolenic acid metabolic pathway; B Genes involved in the linoleic acid metabolism pathway; C Genes involved in the fatty acid biosynthesis pathway; D Genes involved in the unsaturated fatty acid biosynthesis pathway. The color of the rectangles indicated the expression of genes in the fibrous roots and taps roots of ‘Zhongcha108’, ‘Fuding Dabaicha’, and ‘Jiukeng’ tea cultivars. Z-score normalization was applied to the data. Key genes were labeled in red color
Analysis of differentially expressed transcription factors
Transcription factors (TFs) play crucial roles in regulating tea plant growth and development [35]. In this study, a total of 3,141 TFs were identified (Table S7) and categorized into 95 distinct families. The predominant TF families included MYB, bHLH, ERF, FAR1, C2H2, NAC and MYB-related, each containing over 100 members. To investigate the regulatory network behind the observed differences in phenylpropanoid and flavonoid biosynthesis in the aerial parts of the three cultivars, Pearson correlation analyses were performed between the identified TFs and genes involved in these two pathways. A total of 6,952 TF–gene pairs exhibited a correlation coefficient greater than 0.8 with a significance level of p < 0.05, of which 3,850 were positively correlated (Table S8). The 20 most highly expressed TFs in each cultivar were selected for detailed correlation analysis (Fig. 9A). Heatmap analysis of expression patterns revealed that many of these TFs exhibited cultivar-specific patterns and were mainly upregulated in the shoots or leaves of FD (Fig. 9B). Specifically, TFs such as CSS0033564, CSS0041210, CSS0049449, CSS0029513, Camellia_sinensis_newGene_29682, CSS0048202 and CSS0048097 showed strong positive associations with structural genes including CSS0007745, CSS0039867, CSS0034202, CSS0007714, CSS0004474, CSS0021668, CSS0003013, CSS0041448, CSS0009063, CSS0025824, CSS0033075, CSS0026112, CSS0022212, CSS0046529, CSS0021474, CSS0030597 and CSS0028431. In contrast, the remaining 13 TFs were only positively associated with a smaller subset of structural genes, such as CSS0028496, CSS0007933 and CSS0002404. These TFs might function as key regulators orchestrating the differential expression of biosynthetic genes, thereby contributing to the observed variation in secondary metabolite profiles.
Further Pearson correlation analysis was also conducted between the TFs and genes implicated in fatty acid biosynthesis and metabolism. A total of 188 TF–gene pairs showed correlation coefficients above 0.8 with p < 0.05, of which 148 pairs were positively correlated (Table S9). The 20 most abundantly expressed TFs per cultivar were again selected for this analysis (Fig. 9C). The heatmap results showed that these TFs displayed distinct expression profiles, with most presenting relatively low expression levels in the fibrous roots of FD (Fig. 9D). Only seven TF–gene combinations showed significant positive correlations. They were CSS0029616 vs. CSS0037941, CSS0031905 vs. CSS0037941, CSS0029851 vs. CSS0043714, CSS0031905 vs. CSS0046980, CSS0049449 vs. CSS0010933, CSS0045349 vs. Camellia_sinensis_newGene_6171, and CSS0049449 vs. Camellia_sinensis_newGene_17768. Together, these findings underscored the complexity and specificity of transcriptional regulation across different tissues and cultivars, and highlighted the importance of TFs in driving cultivar-dependent metabolic adaptations in tea plants.
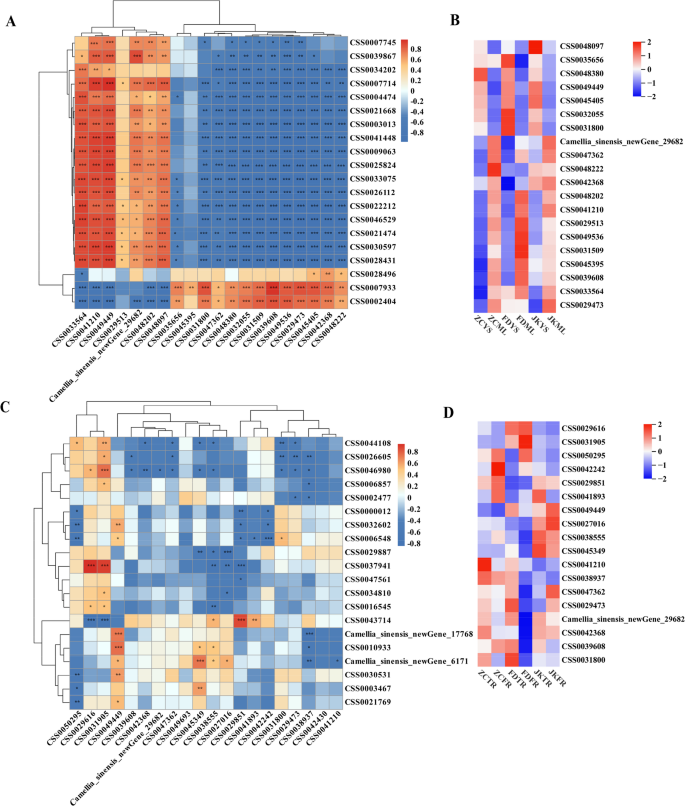
The regulation roles of the 20 TFs that top expressed in each cultivar. The Pearson correlation analysis of the TFs and genes involved in the phenylpropanoid and flavonoid biosynthesis (A) and fatty acids biosynthesis and metabolism pathways (C). The expression levels of the TFs that top expressed in each cultivar of young shoots (YS) and mature leaves (ML) (B) and tap roots (TR) and fibrous roots (FR) (D)
qRT-PCR analysis
To validate the gene expression trends of the CSDEGs identified through RNA-seq, qRT-PCR was performed on 15 selected genes involved in phenylpropanoid biosynthesis, flavonoid biosynthesis, and fatty acid metabolism pathways (Fig. S3). These genes were analyzed in young shoots and mature leaves or in tap roots and fibrous roots across the three tea cultivars. The qRT-PCR results demonstrated that the majority of the expression patterns were consistent with those observed in the RNA-seq data, confirming that the transcriptome results were reliable and suitable for subsequent analyses.