Study sample
Data for this study were obtained from a cohort of couples preparing for pregnancy at Guangzhou Baiyun District Maternal and Child Health Hospital. The objective was to assess the impact of pre-pregnancy BMI on TTP. The study was registered with the China Clinical Trials Registry (ChiCTR) under registration number ChiCTR2300068809, with the initial registration on January 3, 2023. Further methodological details are available in previous publications [17].
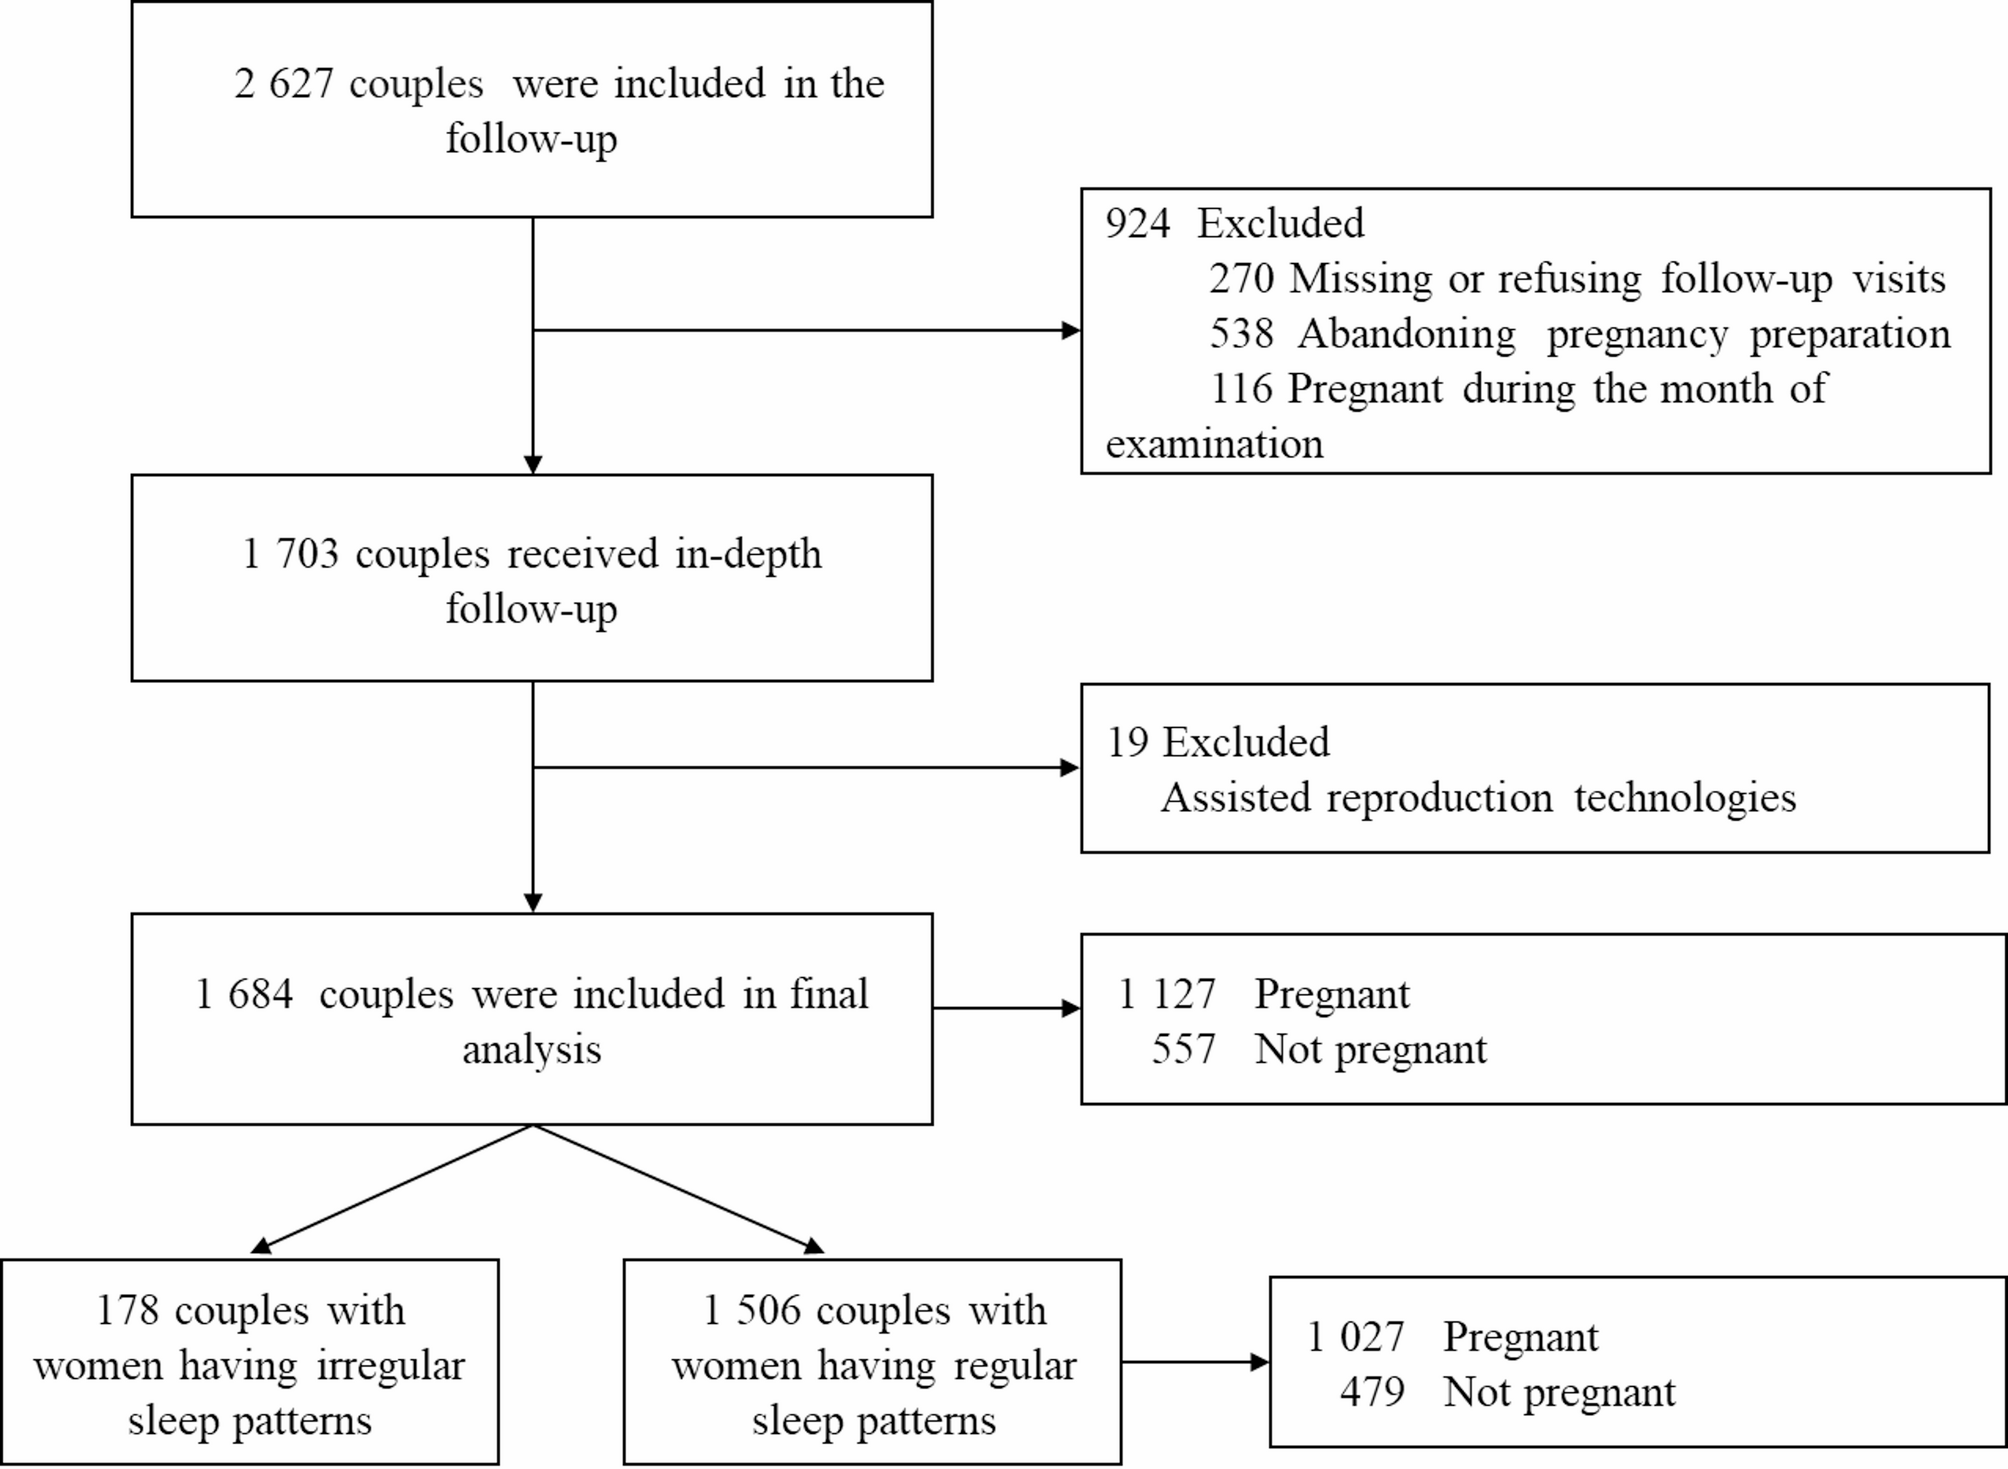
Couples who participated in the National Free Pre-pregnancy Checkup Program (NFPCP) between January and June 2022 were included. Telephone follow-ups were conducted 13 to 15 months post-examination to inquire about their pregnancy preparation status and subsequent pregnancies.
The inclusion criteria were as follows: (1) Female partner aged between 20 and 49 years, and male partner aged 22 years or older; (2) Couples who were not pregnant at the time of the initial assessment; (3) Both partners self-reported an intention to conceive and were not using contraception during the examination.
The exclusion criteria included: (1) Female partners who tested positive for cytomegalovirus or Toxoplasma gondii IgM antibodies, or if either partner had syphilis, HIV, or any other medical condition requiring treatment that would delay conception; (2) Couples who declined participation or were unwilling to cooperate with the follow-up survey; (3) Couples who were already pregnant during the examination month; (4) Couples who were planning to undergo or had previously used assisted reproductive technology (ART).
After applying the exclusion criteria, a total of 1,684 couples were included in the study. A more detailed analysis was conducted on a subsample of 1,506 couples in which the female partner reported a regular sleep pattern (Fig. 1).
Study population creation
Ethical approval
The study was approved by the Medical Ethics Committee at Guangzhou Baiyun District Maternal and Child Health Hospital. Every participant provided written informed consent before enrolling in the study, and verbal consent was obtained again during follow-up for participation in the telephone interview.
Exposures and outcome
In this study, the exposure factors refer to various sleep behaviors, including irregular sleep patterns, sleep onset time, sleep duration, insomnia, and perceived insufficient sleep. Sleep behaviors during the preconception period were obtained through telephone follow-up by trained medical professionals. Definitions and measurements were as follows:
Irregular sleep patterns were defined as inconsistent or highly variable sleep and wake times in daily life during the preconception period. Specifically, participants were asked: “During your preconception period, did you have irregular sleep patterns (inconsistent bedtimes and wake times varying by >1 hour on ≥3 days per week)?” (Yes/No).
Sleep onset time was defined as the time women subjectively reported falling asleep during the preconception period, and was recorded in a decimal format in which 60 minutes equaled one unit (e.g., 23:30 was recorded as 23.5). If sleep occurs past midnight, each additional hour is incremented by 1 (e.g., a bedtime of 1:00 AM is recorded as 25). Participants were asked: “During your preconception period, what time did you usually fall asleep?”
Sleep duration refers to the average total sleep time per day during the preconception period. Participants were asked: “During your preconception period, how many hours of sleep did you get in a typical 24-hour period?”
Insomnia was defined as persistent difficulty initiating or maintaining sleep, or experiencing early morning awakenings, among women attempting to conceive. Participants were asked: “Did you experience persistent difficulty falling asleep, staying asleep, or waking too early ≥3 times/week?” (Yes/No). Perceived insufficient sleep was defined as a frequent self-reported experience of unrefreshing sleep or persistent fatigue upon awakening during the preconception period, irrespective of sleep duration. Participants were asked: “During your preconception period, did you wake up feeling unrefreshed or experience persistent fatigue despite adequate time in bed on ≥3 days per week?” (Yes/No).
The primary outcome was TTP.
-
(1)
TTP for pregnant couples = (date of last menstrual before pregnancy – date of last menstrual at examination)/30 + 1;
-
(2)
TTP for unpregnant couples = (date of last menstrual at follow-up – date of last menstrual at examination)/30.
In accordance with previous studies on TTP calculation methods [18, 19], if conception is confirmed and occurs within the following cycle, one cycle is added to the TTP to account for the actual time of conception. Periods during which couples paused pregnancy attempts were subtracted from the total. All reported pregnancies were confirmed via clinical tests at the hospital.
Covariates
Covariate selection was based on the Health Behavior Theory (HBT) [20], which focuses on the influence of individual behaviors on health outcomes. HBT is grounded in the understanding that lifestyle factors, such as diet, physical activity, sleep patterns and smoking, play a crucial role in health outcomes, including reproductive health. Guided by previous research [8, 21], we identified potential variables that may influence the study outcome. We then applied the Least Absolute Shrinkage and Selection Operator (LASSO) regression method for variable selection to reduce multicollinearity, thereby enhancing the robustness and predictive performance of the model. The final variables included in the model were BMI, age, occupation, education, tobacco exposure (no, yes), frequent consumption of takeaway food (no, yes), duration of electronic device use, regular menstruation (no, yes), and exercise frequency. The ages of the couples were recorded either at the time of examination or when they began preparing for pregnancy following the examination, and were categorized into four groups:”≤25 years,””26-29 years,””30-34 years,”and”≥35 years.”This classification was based on both research regarding fertility and age, and actual reproductive policies and trends. BMI was calculated as weight (kg) divided by the square of height (m). Height and weight measurements were taken by trained medical professionals using a smart, interconnected height and weight measurement device. Participants were required to stand barefoot in a neutral posture, without shoes or outerwear, and weight data was recorded once it stabilized. According to the guidelines of the Chinese Obesity Working Group (WGOC), the BMI thresholds were defined as follows: underweight < 18.5 kg/m², normal weight 18.5–23.9 kg/m², overweight 24–27.9 kg/m², and obesity ≥28 kg/m². For analysis, BMI was categorized into three groups: underweight, normal weight, and overweight/obese. Occupation was classified into three categories:”Manual”,”Office”, or”Others”. Education referred to the highest level of education attained, including high school or vocational school and below, college, bachelor’s degree, and postgraduate education. Tobacco exposure was defined as active smoking or passive exposure for an average of five minutes or more per day. Frequent takeaway consumption was defined as eating takeaway at least once a day. The duration of electronic device use was treated as a continuous variable, representing the average daily hours spent using mobile phones, tablets, computers, or watching television during the pre-pregnancy period. Regular menstruation status was determined based on the doctor’s inquiry and judgment during the examination. Exercise frequency was categorized by the number of moderate-intensity physical activity sessions (lasting over 30 minutes) per week, with categories: “<1 time per week,” “1–3 times per week,” and “>3 times per week.
Statistical analysis
All statistical analyses were performed using R software (version 4.0.0). Group differences were assessed using the χ² test for categorical variables, the Wilcoxon rank-sum test for continuous variables with a non-normal distribution, and one-way analysis of variance (ANOVA) for continuous variables with a normal distribution. Normally distributed continuous variables were presented as mean ± standard deviation (SD), non-normally distributed continuous variables were described using the median and interquartile range (IQR), while categorical variables were described as frequencies and percentages.
The Cox proportional hazards regression model was employed to examine the association between various sleep behaviors and TTP, estimating fecundability ratios (FRs) and corresponding 95% confidence intervals (95% CIs). An FR > 1 indicated a shorter TTP and higher fertility, whereas an FR < 1 suggested prolonged TTP and reduced fertility.
During covariate selection, we first identified potential factors influencing TTP based on previous studies and theoretical frameworks. These variables included age, BMI, occupation, education level, tobacco exposure, and alcohol consumption for both partners. For women specifically, these included primiparity, frequent consumption of takeaway food, duration of electronic device use, coffee consumption, menstrual regularity, and exercise frequency. LASSO-Cox regression was then applied, incorporating an L1 penalty into the Cox proportional hazards model to shrink certain regression coefficients to zero, thereby automatically selecting the most important variables.
For each sleep behavior subgroup, the LASSO model was fitted using the following steps: First, a survival object was constructed, with TTP as the survival time and pregnancy success as the survival outcome. Categorical variables were then processed, and a predictor matrix for the Cox regression model was built. We used the glmnet() function to fit the LASSO-Cox regression model across a range of regularization parameters (λ), and the coefficient path was visualized. The optimal λ value was determined using 10-fold cross-validation, and the error curve was plotted. The final set of covariates included in the Cox regression model was composed of those with nonzero coefficients at the optimal λ value (lambda.min). The final covariates retained across most sleep behavior subgroups included BMI, age, occupation, and education level for both partners, as well as tobacco exposure, frequent consumption of takeaway food, duration of electronic device use, regular menstruation, and exercise frequency for women. Collinearity diagnostics showed that all VIF values for sleep variables and covariates were less than 5.
Regarding the missing data, the regular sleep group had 0.27% missing data for sleep onset time. These missing values were handled using multiple imputation by chained equations (MICE), with 50 imputations. The imputation model included the following covariates: BMI, age, occupation, and education level for both partners, as well as sleep onset time, sleep duration, insomnia, perceived insufficient sleep, tobacco exposure, frequent consumption of takeaway food, duration of electronic device use, regular menstruation, exercise frequency, and TTP for women.
The proportional hazards assumption of the Cox regression model was tested using Schoenfeld residuals. In the analysis, the variable”irregular sleep patterns”violated the proportional hazards assumption in the Cox regression model. Therefore, we applied an extended Cox proportional hazards model incorporating a time-dependent covariate to explore the time-varying effect of irregular sleep patterns on TTP. In this study, irregular sleep patterns were initially assessed as a binary categorical variable, with participants classified as having either a regular (coded as 0) or irregular (coded as 1) sleep-wake pattern based on self-reported data. To examine the potential time-varying effect of irregular routines on TTP, this variable was converted into numeric form and included as a time-dependent covariate in the Cox proportional hazards model. Specifically, to account for violation of the proportional hazards assumption, irregular sleep patterns were modeled using both a baseline main effect and a time-interaction term constructed via the tt() function in R, defined as a product of the variable and the natural logarithm of follow-up time (i.e., log(TTP + 1)). This allowed us to assess potential deviations from the proportional hazards assumption by capturing time-varying effects of irregular sleep patterns on time-to-pregnancy. After model fitting, the coefficients for both the main and interaction terms were extracted along with their variance-covariance matrix. These values were used to compute time-specific log hazard ratios and their standard errors across a 12-month interval. The log HRs were exponentiated to obtain corresponding hazard ratios and 95% confidence intervals, and the trend was visualized using the ggplot2 package in R.
In the regular sleep patterns group, we investigated the effects of sleep onset time, sleep duration, insomnia, and perceived insufficient sleep on TTP, while in the irregular sleep patterns group, we did not further analyze specific sleep behaviors due to the limited sample size (n = 178). In the regular sleep patterns group, three models were established: Model 1 without any adjustments, Model 2 adjusting for demographic characteristics of both partners, and Model 3 adjusting for all covariates. In the Cox regression model for the regular sleep group, Holm-Bonferroni correction was applied to adjust the p-values for sleep onset time, sleep duration, insomnia, and perceived insufficient sleep.
Restricted cubic spline (RCS) analysis was conducted to evaluate the nonlinear effects of different ranges of sleep duration and sleep onset time on TTP. The number of knots in the RCS model was selected based on Akaike Information Criterion (AIC). In our study, we compared the age and occupational characteristics between couples lost to follow-up and those included in the analysis, and found no statistically significant differences. Finally, sensitivity analyses were conducted to explore whether live birth impacted the findings. Statistical significance was defined as p < 0.05.