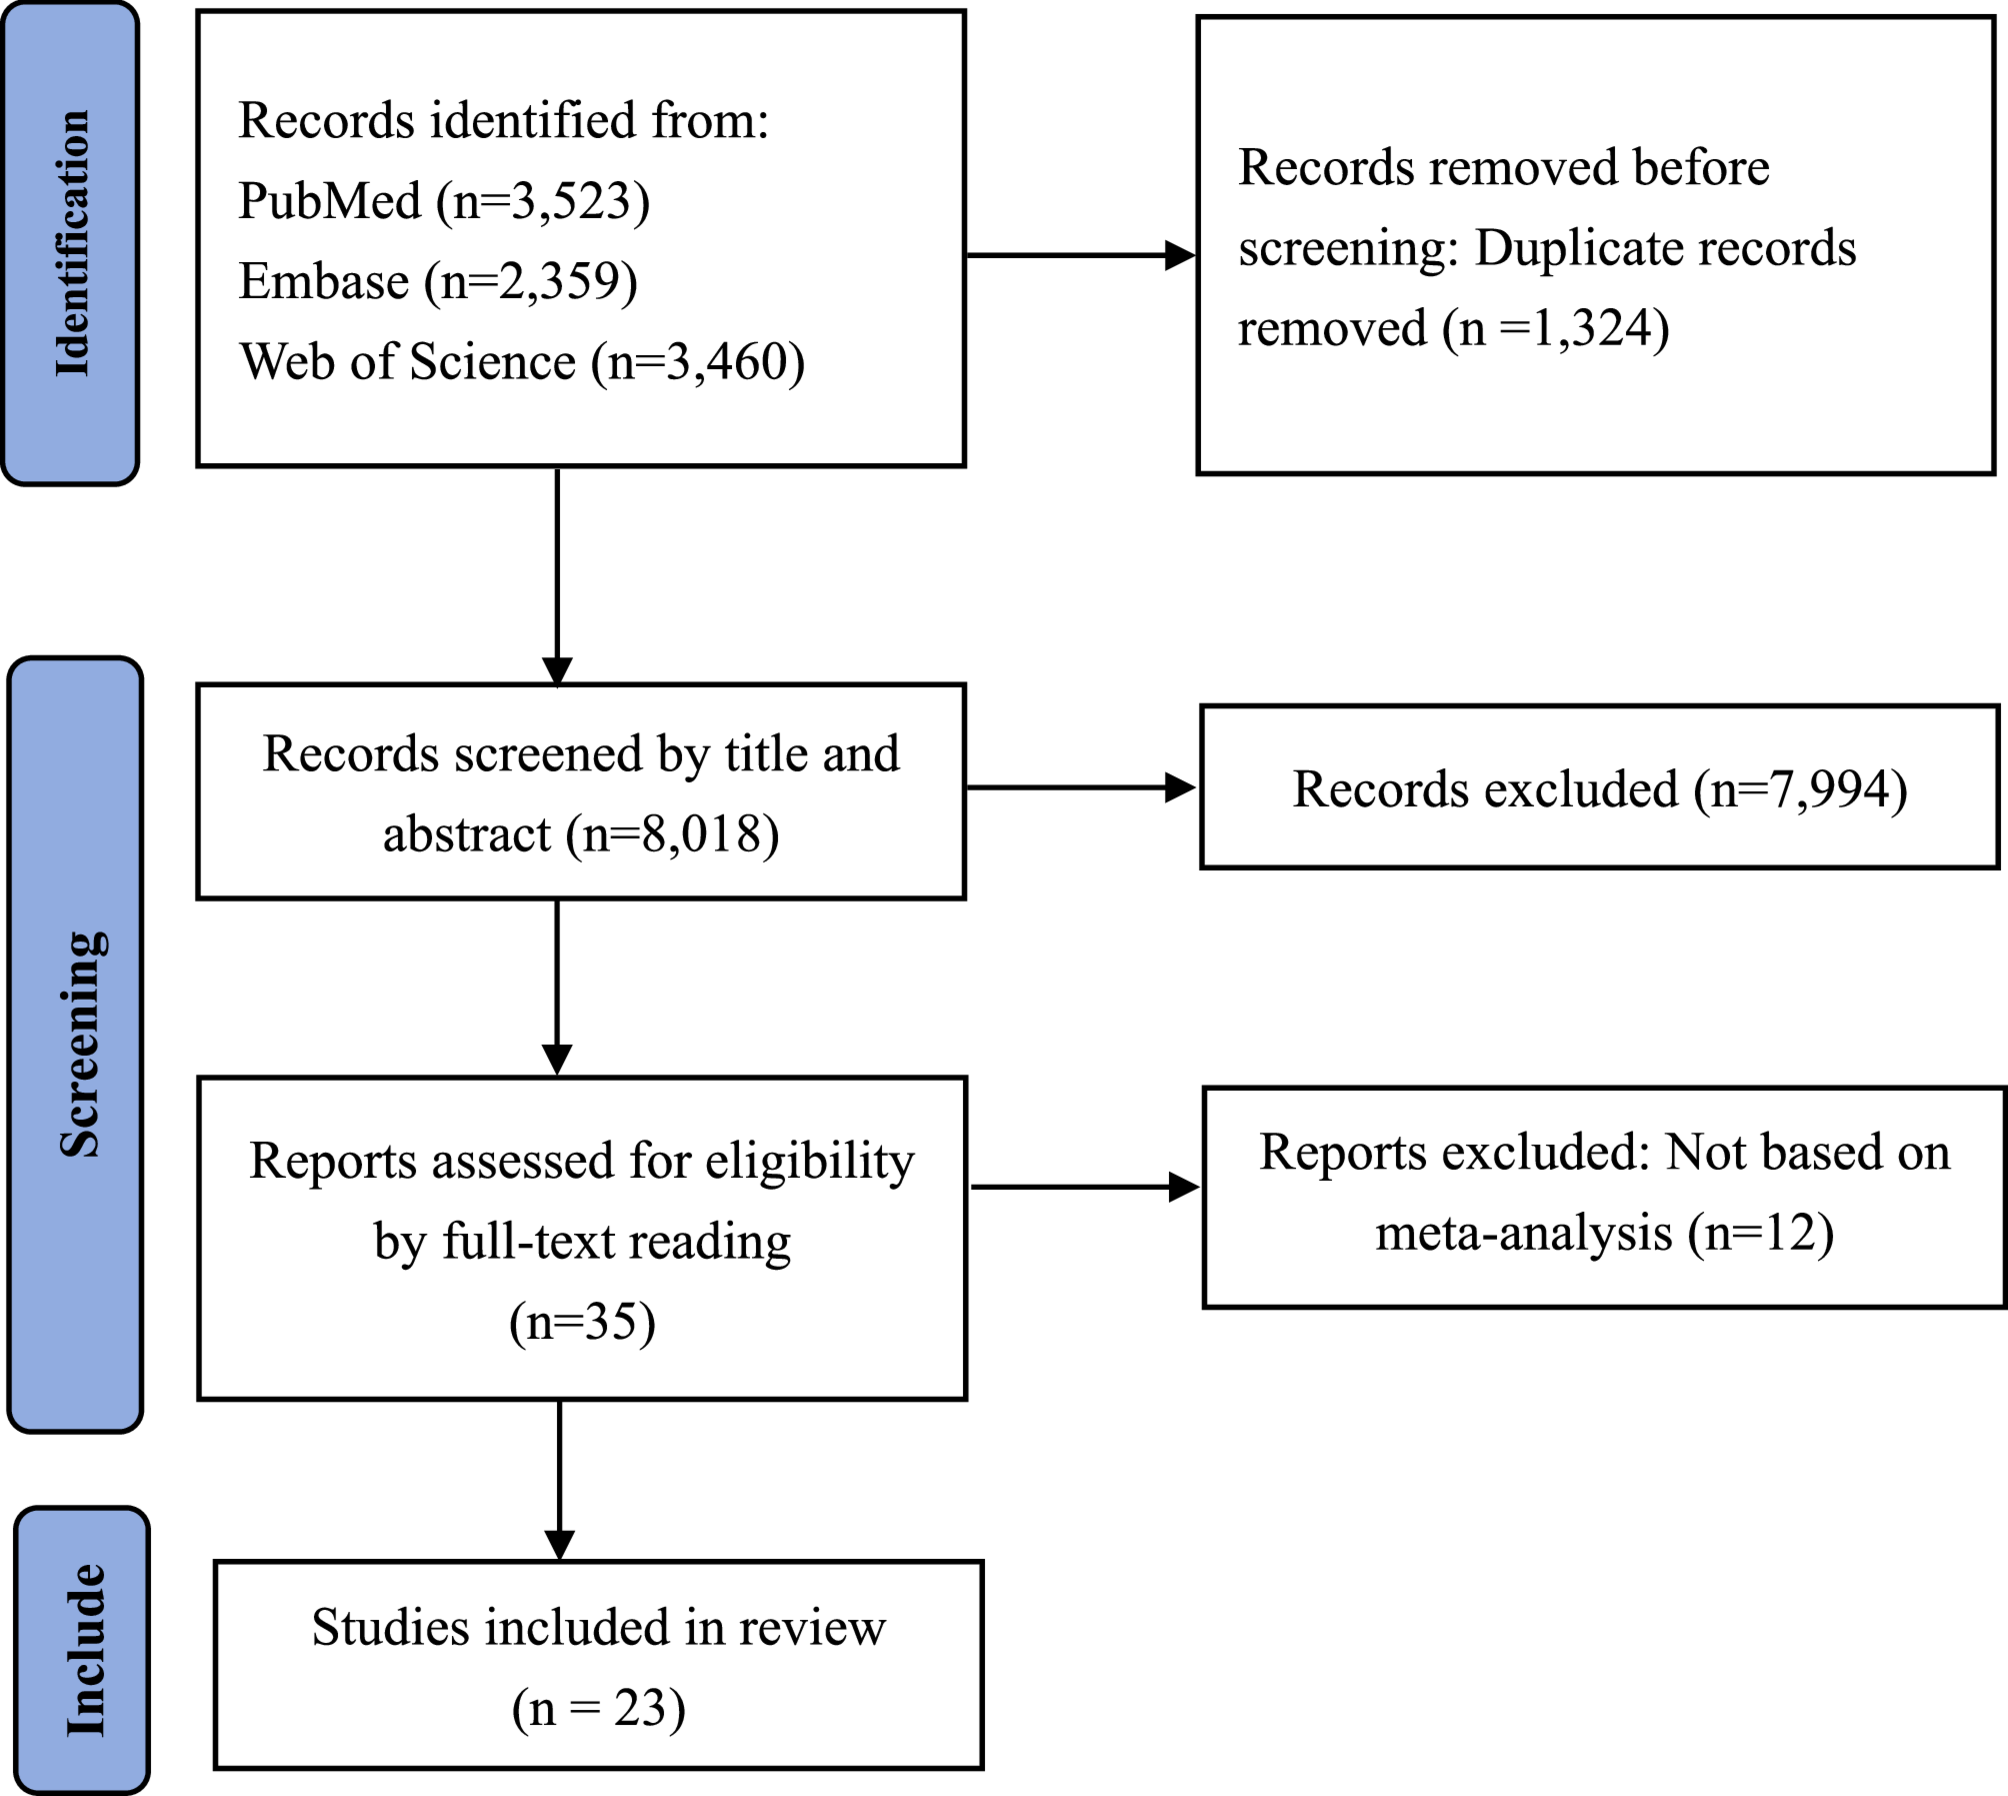
Results of literature screening
We retrieved a total of 9342 studies. After removing duplicates, we identified 8018 studies for title and abstract screening. Of these, 35 studies were potentially eligible. Ultimately, we included 23 studies according to the inclusion criteria (Fig. 1) [12,13,14,15,16,17,18,19,20,21,22,23,24,25,26,27,28,29,30,31,32,33,34].
Characteristics of the included studies
Twenty-three eligible studies with 25 prediction models were included. Ten prediction models were developed on the basis of traditional meta-analysis, whereas the remaining 15 were developed on the basis of individual participant meta-analysis. The characteristics of the included studies are presented in Tables 1 and 2. These studies were published between 2013 and 2023. The predicted outcomes focused on complications of diabetes mellitus (e.g., early or recurrent foot ulceration, early diabetic kidney disease, early diabetic peripheral neuropathy, diabetic retinopathy, and end-stage renal disease), respiratory disease (e.g., bronchopulmonary dysplasia, bacterial rhinosinusitis, radiation pneumonitis, and severe COVID-19), gestational diabetes mellitus, preterm birth, early-onset colorectal cancer, anastomotic leakage, coronary artery disease, 10-year mortality, survival with good neurologic outcome, mild cognitive impairment, seizure, psychosis and the response to placebo in antidepressant trials. Nearly half of the prediction models were developed with data sourced from cohort studies (n = 10), and the remaining models had a mixed study design. A greater proportion of studies focused on multiple ethnicities (n = 13) and assessed the risk of bias for primary studies (n = 14). Three prediction models were developed with sample sizes exceeding one million, and seven prediction models were developed with sample sizes exceeding ten thousand. Twelve prediction models used data from cohort studies to externally validate their predictive performance (Appendix Table 1).
Summary of prediction models
Appendix Table 2 presents the main findings of the included prediction models. Five studies developed risk scoring models according to Sullivan’s method. Two studies developed a Rothman-Keller model. The remaining studies constructed logistic regression models (n = 13), Cox proportional hazards models (n = 2) and parametric survival models (n = 1). The number of risk factors included in the prediction model ranged from 3 to 16. Twenty-three prediction models reported AUCs, with a median value of 0.77 (ranging from 0.59 to 0.91), eleven prediction models were calibrated and two models conducted decision curve analysis. The criteria for the exclusion of risk factors from the prediction models included high heterogeneity between studies, no statistically significant pooled results for risk factors, different definitions of risk factors, the exclusion of some risk factors (e.g., p > 0.0001) to develop a parsimonious model, and the use of the Akaike information criterion to remove the least contributing predictors.
Key steps in developing risk prediction models on the basis of meta-analysis
According to the included studies, we summarized several key steps in developing prediction models on the basis of meta-analysis (Fig. 2).
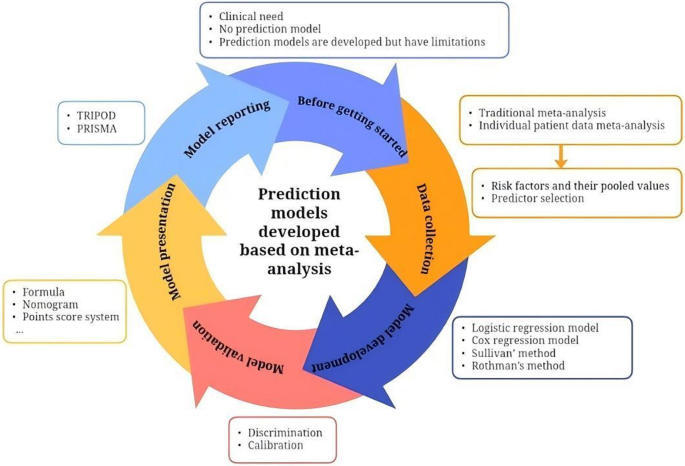
Key steps in developing prediction models on the basis of meta-analysis
Step I: confirm that the risk prediction model meets clinical needs before being started
The clinical purpose of the risk model, as well as the target population and clinical setting, was defined. If the risk model meets the clinical need, we need to check the research status of prediction models in the field, including data sources for model development, the clinical setting, predictors, external validation, and ease of use. If the existing prediction models do not meet clinical needs, a new prediction model is needed. Before initiating model development, a detailed study protocol should be formulated and prospectively registered. Additionally, assembling a multidisciplinary expert team is essential. This team plays a vital role in iteratively refining the study protocol and provides ongoing methodological and domain-specific expertise throughout the entire research process.
Step II: data collection via traditional meta-analysis or individual patient data meta-analysis
The two main methods of data collection for the development of prediction models are traditional meta-analysis and individual patient data (IPD) meta-analysis. The two methods include the following steps: defining the review question, drafting the protocol, developing a search strategy, selecting studies, extracting data, assessing the risk of bias, synthesizing evidence and performing a meta-analysis, presenting findings and interpreting the results. Step II is pivotal for the development of prediction models on the basis of meta-analysis. The aim is to systematically search for existing predictors and identify those that should be included in the prediction model and obtained their pooled values and 95% CIs. The included studies used various methods to identify predictors including P-values of pooled values based on meta-analysis, stepwise regression, clinical experience and expert consensus. In addition to these methods, for prediction models based on traditional meta-analysis, we recommend using directed acyclic graphs (DAGs) to identify candidate predictors, as DAGs provide a causal framework that guides variable selection and mitigates issues arising from overreliance on mere statistical associations [35]. For prediction model based on IPD meta-analysis, Lasso regression is suggested to select predictors because it selectively highlights important predictors and efficiently removes less critical ones by shrinking their coefficients to zero [36]. Finally, a Delphi questionnaire was used to consult with experienced experts to determine the predictors ultimately included in the prediction model. In this step, it is important to note that the predicted outcomes, predictors and focused population should be defined a priori to reduce heterogeneity between studies.
Step III: risk prediction model development
First, all the predictors included in the prediction model and their pooled values and 95% CIs are obtained from step II. Then, the corresponding β coefficients are calculated on the basis of the pooled data, and a logistic regression model or Cox regression model is constructed. Additionally, if a risk score prediction model is constructed, we can calculate the score for each predictor according to Sullivan’s method or Rothman’s method [37, 38]. Most of the included studies developed a simple risk score model, which is convenient for clinical practice.
Step IV: validation of the performance of the risk prediction model
Model performance can be evaluated using these indexes: discrimination (e.g., C statistics, sensitivity, and specificity), calibration (e.g., calibration-in-the-large, calibration slope, and calibration plot) and clinical utility (e.g., decision curve analysis). In addition, we can use a risk threshold to turn the risk model into a classification rule. For example, according to the optimal cumulative score based on the Youden index, patients were segmented into different risk groups, and Kaplan-Meier curves were used to calculate the cumulative risk of morbidity in different groups. The prediction model is usually evaluated first with internal validation and then with external validation. However, the models developed on the basis of meta-analysis are rarely validated internally, which may be related to the difficulty in obtaining complete individual data during model development. Approximately half of the studies conducted external validation using data from single-center prospective or retrospective cohort studies.
Step V: model presentation andinterpretation
Once the prediction model is developed, researchers need to consider how to present it. Prediction models based on meta-analysis often provide an exact formula for users to validate or use and are simplified in formats such as nomograms, point score systems and websites. To better explain the prediction model, researchers can use examples to demonstrate how to use the model.
Step VI: model reporting
The prediction models usually follow the Transparent Reporting of a multivariable prediction model for Individual Prognosis or Diagnosis (TRIPOD) reporting guidelines [39]. Of the included studies, only five prediction models were reported according to the TRIPOD guidelines [15, 26,27,28, 32]. However, since the models were developed on the basis of meta-analysis, we recommend that the PRISMA statement should also be followed [40].