Ethical approval
The main trial (PregnAnZI-2) was approved by the Gambia Government-MRCG Joint Ethics Committee, the Comité d’Ethique pour la Recherche en Santé, the Ministry of Health of Burkina Faso, and the London School of Hygiene and Tropical Medicine Ethics Committee. In addition, this post hoc study was approved by the Gambia Government-MRCG Joint Ethics Committee and the London School of Hygiene and Tropical Medicine Ethics Committee. Study women signed informed consent for the trial during their antenatal visits and samples collected during the 4-months follow-up. An additional consent was sought from mothers of the study children for the 3-year survey.
Study design
PregnAnZI-2 (ClinicalTrials.org NCT03199547) was a phase-III, double-blind, randomized, placebo-controlled trial in which 11,983 women from The Gambia and Burkina Faso were randomized to receive a single dose of 2 g of oral azithromycin or placebo (ratio 1:1) during labor. The median time from administration of azithromycin to delivery was 1.6 h (IQR 0.5–4.1)9. Details of inclusion and exclusion criteria are available in the study protocol published elsewhere36. The primary objective of the trial was to evaluate the impact of the intervention on neonatal sepsis and death9. The trial showed no effect on the neonatal sepsis or death though other infections, including skin infections, were reduced in the azithromycin arm9. Also, the intervention reduced maternal infections including mastitis9.
Here only participants from sites in The Gambia were included, where the trial was conducted in two health facilities located in the coastal region of the country. A subset of 253 mother-baby pairs were recruited in a bacterial carriage sub-study. These were randomly selected from study children born between January 2019 and March 202036. All the children in the carriage sub-study were vaginally delivered.
Selection of children for mycobiota analysis
The first 102 children recruited into the bacterial carriage sub-study in the Gambia were selected. For these children, an additional follow up was conducted at the age of 3 years, during which rectal swabs were collected from 72 of the 102 children initially selected plus an additional 25 children from the main carriage cohort. Details of the sample selection process is illustrated in Fig. 5. A total of 126 children were included in this mycobiota study. Fifty-seven of these children were born to mothers who received the active intervention (2 g azithromycin) and 69 were born to mothers who received placebo.
a Sample selection for mycobiota study. b Distribution of samples included in mycobiota analysis between trial arms at each time-point.
Collection of rectal swabs
During the trial, rectal swabs (RS) were collected with FLOQSwabs (COPAN, REF:519CS01) from the children included in the bacterial carriage sub-study. The first swabs were collected shortly after delivery (day 0). After post-delivery hospital discharge, active-follow up with home-visits occurred at day 6, day 28 and 4 months. RS were collected from the children during these follow-up visits. All the swabs were stored in skim milk-tryptone-glucose-glycerin (STGG) transport medium without preservative and transported in temperature-monitored (2–8 °C) cooler boxes with ice packs to the laboratory within 8 h. Upon reception, the samples were homogenized and stored at −80 °C for later processing.
Rectal swabs used for mycobiota analysis
A total of 467 RS from the children (214 azithromycin, 253 placebo) were processed. Sample numbers per time-point ranged from 40 to 46 for azithromycin arm and from 48 to 53 for placebo arm (Supplementary Table 1). As per best practice for microbiome studies, field controls were collected during the main study (PregnAnZI-2 trial) and during the year 3 follow up of children included in the microbiome studies. A vial of STGG with a plain sample collection swab immersed and exposed for approximately 1 min to the environment where participants were sampled, was used as a field control. To avoid contamination with fecal matter from the samples, the field controls were collected before the rectal swabs. A total of 109 field controls were collected, of which 12 were collected at the hospital sites during the main trial follow ups and 97 were collected from individual participant households during the year 3 follow up.
DNA extraction and quality control
We extracted DNA from the RS using the DNeasy® PowerLyzer® PowerSoil® Kit from Qiagen (Qiagen, Germany) with slight modifications as follows. A total of 100 µl of homogenized RS in 1 ml of STGG transport medium was used as input and two rounds of 10 cycles of beat beating at 2500 RPM for 30 s was applied with 10 min break between rounds. We followed the manufacturers protocol for the rest of the extraction steps and eluted in 100 µl of elusion buffer from Qiagen. Blank extraction and field controls were included and taken through all downstream analyses. Plain sterile swabs in sample storage vials with STGG exposed to the environment at the field site were included as field controls. The DNA extracts were quantified with a Qubit 4·0 Fluorometer (Invitrogen/Thermo Fisher Scientific) using the double stranded DNA high-sensitive kit.
ITS2 library preparation and sequencing
ITS2 amplicons were generated using the following primers (forward: GTGAATCATCGARTCTTTGAAC, reverse: TATGCTTAAGTTCAGCGGGTA) published elsewhere37, and the Q5 Hi-Fi 2X master mix from New England Biolabs (NEB). The PCR reaction was set up with 12.5 µl of master mix, 1 µl each of forward and reverse primers at 10 µM concentration, 5 µl of template, and 5.5 µl of molecular grade water. The following thermocycling conditions were used. Initial denaturation at 98 °C for 30 s, followed by 35 cycles of denaturation at 98 °C for 20 s, annealing at 51 °C for 30 s, and extension at 72 °C for 20 s. This was followed by a final extension at 72 °C for 10 min. The expected amplicon size was ~350 bp. Post PCR DNA concentrations were quantified as described earlier. The PCR products where then normalized to 50 ng (~200 fmol) in 12.5 µl for library preparation. Nanopore libraries were made using the ligation sequencing kit (SQK-LSK109) with the native barcoding expansion 96 (EXP-NBD196) using manufacturers protocol. Six pools of 96 libraries and 1 pool of 39 libraries were generated including rectal samples, field controls, extraction reagent blanks and PCR reagent blanks. Each pool was sequenced using an R9 MinION flow cell (FLO-MIN106D) on a GridION using quality filters of 200 bp minimum read length and minimum quality score of Q9. Between 4 million to 8 million reads were generated for each of the 96 library pools, and about 400,000 reads were generated for the pool of 39 libraries, which were mostly field controls.
Analysis of ITS2 sequences
The sequence data were analyzed using NanoCLUST38, a pipeline designed for analyzing 16S rRNA gene amplicon data generated on the Oxford Nanopore Technology (ONT) sequencing platform. The pipeline was optimized for analyzing ITS2 data generated on the ONT sequencing platform. The pipeline takes in raw FASTQ files and performs trimming and filtering using fastp39. Reads were filtered by minimum Q-score of 9 and read lengths between 200 bp and 500 bp. It then generates k-mer frequencies and performs clustering using UMAP-HDBSCAN40,41. We subsampled up to 5000 reads per sample for clustering setting minimum cluster size at 50 and minimum distance to define a cluster at 0.1. Sequences in each cluster are then corrected using Canu assembler42. This is followed by the selection of draft representative sequences for each cluster, which are subsequently polished using Racon43, and Medaka44. The polished consensus sequences are then classified using Kraken245, with a subset of the standard Kraken2 database (April 2024 version) containing only fungal and human sequences.
Mycobiota community analysis
Classification data generated with NanoCLUST were imported into R (version 4.4.0) and RStudio (version 2024.04.1 + 748)46, for further microbial community analysis. The Tidyverse (version 2.0.0), and phyloseq (version 1.48.0)47, packages were mainly used for data handling and organization. First, taxon counts were normalized by total sum scaling. We then inspected the initial profiles of the samples and controls to see the relative abundances of human and unclassified reads as well as possible contaminants (Supplementary Fig. 1). Most of the reads in the PCR and extraction blanks were unclassified, and the top two taxa in the rectal swabs were unclassified and human (Supplementary Fig. 1). We filtered out all human and unclassified reads. The filtered dataset was transformed into a feature table and used to create a phyloseq object together with the sample metadata. Using decontam (version 1.20.0)48, we identified contaminants in the dataset using the isContaminant function in the combined mode setting a probability cutoff of 0.2 for calling a contaminant. A total of 18 taxa (Supplementary Table 2) were identified as contaminants and filtered from the dataset. We re-inspected the profiles of the samples and controls again to see how they have been impacted by the filtering. Most of the potential contaminants were removed, though there still remained a couple of other potential contaminants (Aspergillus fumigatus and Aspergillus puulaauensis) which were subsequently filtered out (Supplementary Fig. 2). Details on the sample numbers that were available before and after all the filters were applied are shown in Supplementary Table 1. The number of reads in the samples and controls before and after filtering of unclassified, human, and contaminants are shown in Supplementary Fig. 3. Samples with only 1 or 2 species (not read counts) remaining post-filter were excluded from analyses of community composition, clustering, and differential abundance to avoid outlier effects.
Before measuring the effects of the intervention on the mycobiota, we first assessed the trial arms for comparability at baseline. Variables that had different representation between the trial arms were controlled for during statistical analysis.
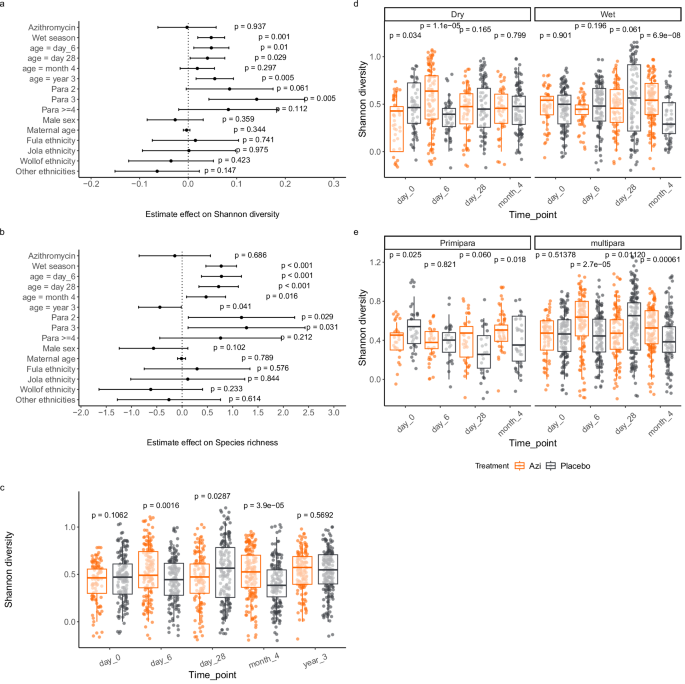
We measured diversity within individual samples (alpha diversity) using Shannon index and species richness. To understand the effects of potential factors that influence microbiome diversity, we assessed the effects of treatment, ethnicity, season of sampling, parity, and sex (sex was determined at birth) among others as covariates on Shannon diversity and species richness using a linear mixed effects model with a random effect on subject. Based on this model we examined interaction between treatment and season measuring variation of Shannon diversity between trial arms at each time-point by season using Wilcoxon rank sum test. The season stratified analysis did not include samples collected at the age of 3 years because all the samples at this time point were collected during the wet season. We also examined interaction between treatment and parity in a similar analysis. Finally, we assessed the effect of age on Shannon diversity using a linear mixed effects model, comparing day 0 to each of the subsequent time-points while controlling for treatment, season of sampling, ethnicity, parity and sex and adding individual variations as random effects. p values were adjusted for repeated testing by Dunnett’s test.
Overall community composition was measured with Bray–Curtis index using the vegdist function in vegan (version 2.6.4)49. Variance in community composition was compared between groups by permutational multivariate analysis of variance (PERMANOVA) using the adonis function in vegan. We assessed the effects of age, season of sampling, ethnicity, parity, and sex on overall community composition within each trial arm. For age comparisons, we compared variance across all time-points and then between day 0 and each of the subsequent time-points. We then compared variance in community composition by treatment by comparing trial arms at each time-point. As we did not find any significant variation in community composition by sampling season, parity, ethnicity, or sex, no stratified analysis was done for these variables.
To further explore the structure of the gut fungal community in our cohort, we employed an unsupervised clustering using Dirichlet’s Multinomial Mixtures model implemented in mothur (version 1.44.0)50, to group samples into clusters based on their community types. We used logistic regression to examine association between fungal clusters (grouped as dominant community type which we called fungCluster_3 vs others) and covariates including treatment, age, sampling season, and parity. We visualized the profiles of the clusters using a heatmap to see which taxa were driving the separation of samples and summarized the frequencies of the clusters per time-point for each trial arm. To understand the dynamics of changes in fungal community types, we assessed the transition of individual children through the different clusters over time.
We assessed variations in taxon abundance using linear models implemented in MaAsLin2 (version 1.18.0)51. First, we assessed temporal variations in taxon abundance between the trial arms at each time-point. We then assessed differences in taxon abundance between trial arms by season of sampling. Finally, we assessed overall abundance for each taxon by treatment, age, season of sampling, parity, ethnicity, sex, and bacterial cluster, while adjusting for random effects on subject. Only taxa with minimum abundance and variance of at least 0.01% were included in differential abundance analysis. p values were adjusted for multiple testing and an FDR cutoff of 0.2 was used for calling significance. We used bacterial clusters identified in these children from our previous study22, where we characterized gut microbiota development to identify potential associations of the bacterial community types with the abundance of individual fungal taxa. Bacterial clusters identified in the children at day 28 were used as this was the point at which we saw marked differences in the representation of bacterial community types between the trial arms22. Data on the bacterial clusters assigned to individual samples is provided in Supplementary Data 152.
Statistics and reproducibility
Sample size for each trial arm at baseline is shown in Table 1. Demographic comparability of the trial arms at baseline was assessed using various tests. For categorical variables (ethnicity, sex, season, breastfeeding mode) except for recent sickness and recent antibiotic consumption, Chi-square test was applied. For recent sickness and recent antibiotic consumption, Fisher’s exact test was applied. For continuous data (maternal age, birthweight, breastfeeding duration), t-test was applied.
The sample size was originally calculated for gut microbiota analysis. We chose to work with the same set of samples because we intended to link our findings with the results we obtained from the gut microbiota analysis. The sample size calculation was based on power to detect at least 10% difference in the top 10 operational taxonomic units (OTUs) and 20% difference in the next 10 OTUs in the gut microbiota using a sample size and power calculation tool for case-control microbiome study design developed by Mattiello et al. 53. We used the gut microbiome dataset from the human microbiome study embedded in the tool. With a sample size range of 30–70 per group, we estimated power by Monte Carlo simulations with 100 replications using the top 50 OTUs from the dataset. A sample size of 45 per group at each time-point had over 90% power to detect these differences. Though we expect higher interpersonal variations with the gut mycobiota than the gut microbiota, our analysis factored this by exclusion of outliers in comparisons of community composition and differential taxon abundance. The remaining samples used in each of these analyses are shown in the respective results.
Multivariate analysis of factors that influenced alpha diversity was done using a linear mixed effects model with random effects on individuals. Temporal variations in alpha-diversity between trial arms was assessed at each time-point by Wilcoxon Rank Sum test. Changes in Shannon diversity over time was assessed using a linear mixed effects model including ethnicity, season, parity, and sex as covariates in addition to the trial treatment while controlling for random variations among individuals. p values were adjusted by Dunnett’s test.
Beta-diversity was compared between trial arms at each time-point by permutational multivariate analysis of variance (PERMANOVA) using the adonis function in vegan49. Beta-diversity was also compared by age across timepoints using the adonis function with permutations restricted within individuals.
Differential taxon abundance was assessed using generalized linear models implemented in MaASLin251. Temporal differences between trial arms were assessed at each time. Variations by age and other covariates were assessed with the aggregated data.
Analysis of factors that drive mycobiota community-types was done by logistic regression using a generalized linear model.
Reporting summary
Further information on research design is available in the Nature Portfolio Reporting Summary linked to this article.