Study design
The overall objective of this study was to investigate the causative role of high uric acid in erectile dysfunction in patients and rat models by targeting MLCK, as well as to determine whether UA-lowering therapy of MLCK inhibitor could improve erectile function in rats. To address this, clinical information and serum of ED patients and healthy participants were collected from three different centers; High uric acid rat model (Uox-KO) was established alongside with wild-type rats as a control group; Pharmacologic inhibition of MLCK with ML-7 was also conducted in these rat model; Primary CCSMC was isolated and cultured for in vitro mechanistic study. Each rat group consisted of a minimum of five rats, and cell experiments were repeated three times. Sample sizes were determined based on our previous experiences and informed by similar non-randomized experiments, because the experimental groups were typically separated by genotypes. However, when a single genotype was divided into multiple groups, then randomization was used for allocation. Typically, investigators during data collection and analysis were not blinded to group allocation. In rat-based experiments, genotyping was identified before group allocation to ensure sufficient group size, resulting in investigators being unblinded. For cell-based experiments, the same investigators performed group allocation, data collection, and analysis thus, it is impractical to make blinding. Both sampling and experimental replicates were at least three times biological and specified in each figure legend. There were no exclusions to report.
Participations
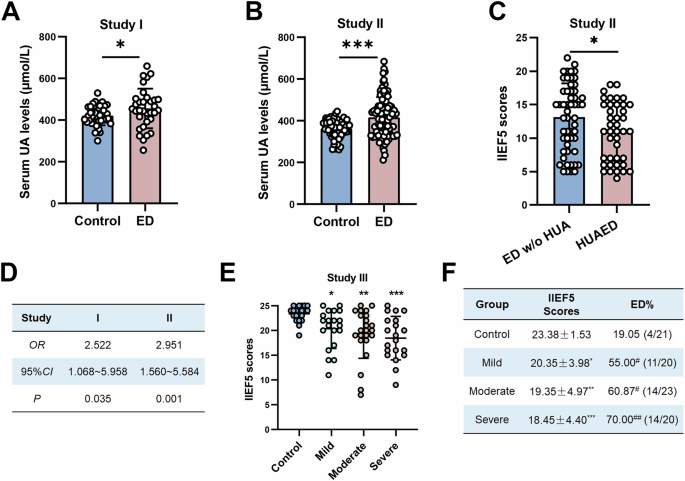
We collected information and serum from three centers: (1) Study I: Males aged 24–49 years old who underwent physical examination were included, completed the IIEF-5 questionnaire after their routine physical examinations under the guidance from physicians, and were grouped by their IIEF-5 scores. (2) Study II: Participants aged 24–49 years from the Andrology Department were included and grouped by their presence or absence of ED chief complaints (3) Study III: Male participants from the Metabolism Department aged 24–49 years were included and grouped by their serum UA levels. Patients with cardiovascular disease, diabetes, hypertension, obesity, hormone imbalance, nerve injury, and penile sclerosis were excluded. All participants signed informed consent, and the experimental ethics committee approved the study protocol of Zhongshan School of Medicine, Sun Yat-sen University (ZSSOM-Medical Ethics-2020-037). All ethical regulations relevant to human research participants were followed.
IIEF5 questionnaire
Rosen designed IIEF5 to quickly assess the presence and severity of erectile dysfunction50. It is often used for screening and diagnosis in the ED. The maximum score is 25. A score ≥ 22 is considered normal, 17–21 is mild, 8–16 is moderate, and ≤ 7 implies a severe situation. The questionnaire was conducted one-on-one among participants by a certain researcher for minimizing potential confounders.
Animals
Urate oxidase (Uox) knockout rats were used as hyperuricemia models gifted from Prof. Haibing Chen. CRISPR/Cas9 technique was used to knock out 5 bp of CTTCG in the Uox sequence of Wistar rats51. All experiments have been reviewed and approved by the Ethics Committee of Laboratory Animals of Sun Yat-sen University (SYSU-IACUC-2020-B0041). All animals were raised in an SPF environment and used in accordance with the guidelines of Sun Yat-sen University. We have complied with all relevant ethical regulations for animal use.
Erection function evaluation
For hypothesis-testing studies, function evaluation is the primary outcome measure. Rats were anesthetized by intraperitoneal injection of 30 mg/kg of pentobarbital sodium. The BL-420A/F biometric signal acquisition and analysis system (Techman Software) recorded the carotid pressure to represent the intracavernous pressure (ICP) and mean arterial pressure (MAP) and released a bipolar electrode to stimulate the erection (constant voltage 5 V, frequency 20 Hz, stimulation wave width 0.2 ms) for 60 s each time.
Arterial tension measurement
After rats were euthanatized by intraperitoneal injection of 100 mg/kg of pentobarbital sodium, the thoracic aorta was excised and immediately placed in a physiological saline solution (PSS) equilibrated with 95% O2 and 5% CO2. The aorta was then sectioned into cylindrical rings (2–3 mm in width) after connective tissue and adventitia were carefully removed. The aortic rings were subsequently mounted in a 4-chamber myograph system (DMT 620 M, Aarhus, Denmark) for isometric tension recording. Each ring was suspended between two stainless-steel hooks within an organ bath containing PSS, maintaining a temperature of 37 °C. The chambers were continuously aerated with a gas mixture of 95% O2 and 5% CO2 to mimic physiological conditions. After a balance of 15 min, optimal resting tension (5mN) was applied gradually for over 60 min, with buffer replacement every 15 min. Vessels were depolarized and activated by 100 mM KCl in PSS. Subsequently, the rings were stimulated to induce the contraction using phenylephrine (PE, 10−9 to 10−4 M). After achieving a stable contraction for an additional 30 min, concentration-response curves for acetylcholine (ACh, 10−6 to 10−5 M) were obtained. The tension (mN) is continuously recorded and analyzed using the data acquisition and analysis software (LabChart, ADInstruments).
Drugs and inhibitors
According to the Reagan-Shaw dose conversion formula [human equivalent dose (mg/kg) = rat dose (mg/kg) × (6/37)]52, the dose of benzbromarone and febuxostat was 1 mg/mL intragastric administration, with the control group was given a 0.5% CMC-Na solution. According to the manufacturer instructions, 10 μM ML-7 (#S8388, Selleck) and 50 μM 3170 (#S8736, Selleck) in 100 μL 0.1% DMSO solution, respectively, were injected into the cavernous tissue with an equal volume of 0.1% DMSO as control. Uox-KO rats of the same age were put together in one huge cage gently and then allocated to control and treatment groups randomly. All the rats were administrated once every two days.
Glucose/insulin tolerance test (GTT/ITT)
GTT: The rats were weighed and starved 16 h in advance. The end of the tail was cut off, and the fasting blood glucose was measured after wiping the first drop of blood with a cotton ball. Then the 20% glucose (#G7021, Sigma) working solution was intraperitoneally injected at the ratio of 2 g/kg body weight. Then, blood glucose levels were monitored after 15 min, 30 min, 45 min, 60 min, 90 min, and 120 min, respectively. ITT: The rats were weighed and starved 4 h in advance. The tail end of the rat was cut off, and the first drop of blood was wiped with a cotton ball before the fasting blood glucose was detected. The insulin (Novo Nordisk, 100 U/mL) working solution should be prepared for immediate use and kept away from light. The rats were injected intraperitoneally with insulin at the ratio of 0.75U/kg body weight. Blood glucose levels were monitored at 15 min, 30 min, 45 min, 60 min, 90 min and 120 min, respectively.
Cell culture
Primary cavernous smooth muscle cells were extracted and cultured from 7-week-old wild-type male Sprague-Dawley rats according to the previous description53,54. In detail, the entire penis was dissected under aseptic conditions. After several washing times with PBS, the mucosa tissue, urethra tissue, and glans head were removed in a medium dish. After rinsing with PBS several times, the corpus cavernosum tissue was placed in a new sterile container and cut into 1–2 mm pieces. The bottom of the flask was moistened in advance with FBS, and the tissue pieces were attached to the bottom with tweezers apart by 0.5 cm to 1 cm. About 2 mL DMEM was added to the culture bottle, and then the bottle was placed with the bottom side facing up in the incubator. After 2–4 h, the bottle was turned back to face up. After 3–5 days, cells appeared around the tissue blocks, which could be overgrown in about 15 days. During this period, DMEM was added when the culture medium turned yellow. After overgrowth, cells were digested with 0.25% Trypsin-EDTA (Gibco) and cultured in DMEM with 10% FBS and 1% penicillin-streptomycin solution. Besides, a human retinal pigment epithelial cell line (ARPE19, #CRL-2302, ATCC) was used as the low-MLCK-expressing cell model. Cells were digested with 0.25% Trypsin-EDTA (Gibco) and cultured in DMEM with 10% FBS and 1% penicillin-streptomycin solution.
Plasmids and recombined proteins
The overexpression plasmid pCDNA3.1-MYLK was constructed by cloning a 2994 bp fragment from MYLK cDNA (XM_017006469.2 → XP_016861958.1, myosin light chain kinase, smooth muscle isoform X7, 992aa) into the EcoRI and XhoI sites of control plasmid pcDNA3.1. Plasmids were constructed by Hanyi Biotechnology Co., LTD (#B4547-2, MLCK-WT; #B4624-2, MLCK-N803A; # K37188, MLCK-K799). The recombined WT MLCK protein was purchased from Abcam (#ab55674), and N803A MLCK protein was constructed by Genscript Biotechnology Co., LTD (#SC1810). The pcNDA3.1-Flag-NEDD4L plasmid was kindly provided by JY Zhang and K Li’s laboratory.
Transfection
According to the manufacturer’s instructions, the transfection of plasmids was performed at about 70% confluency of cells using Advanced DNA/RNA Transfection Reagent (#AD6000150, Zeta Life). In detail, directly mix at a ratio of 1 μg DNA with 1 μL transfection reagent or 1 μL RNA (20 μM) with 1 μL transfection reagent. Homogenize the mixture through 15 cycles of vigorous pipetting, followed by incubation at room temperature for 15 min to allow complex formation. Add the resulting complexes dropwise to the cell culture medium and distribute them by gentle swirling. After 24 h of standard incubation, aspirate the medium and replace it with fresh, pre-warmed culture medium.
Histological and immunofluorescence (IF) analyses
After being harvested, each rat corpus cavernosum tissue was equally divided into three aliquots. The middle ones were fixed in 4% paraformaldehyde, embedded in paraffin, and cut into 3–4 μm sections with sequence number. Sections of the same number were selected for histological staining. Vessel wall thickness and luminal diameter by Masson’s trichrome staining were quantified using ImageJ with a calibrated scale bar. Measurements were averaged across 3 non-consecutive sections per animal to ensure representativeness. Besides, after dewaxing, hydration, and quenching, sections were incubated with goat serum at room temperature for 1 h. Then, the penis tissue slices and cell slides were incubated with primary antibody at 4 °C for 16 h and then with secondary antibody at 37 °C for 2 h, protected from light. Finally, slices were incubated with 0.5ug/mL DAPI at room temperature for 10 min. Olympus BX63 microscope was used to observe and photograph. The antibodies and reagents used are shown in Table S7-S8.
Real-time quantitative polymerase chain reaction (RT-qPCR)
Total RNA was prepared using the RNA Purification Kit (#B0004D, EZBioscience). Quantification and integrity analysis of total RNA were performed by running 2 μL of each sample on a Nanodrop ultraviolet spectrophotometer. The cDNA was prepared by reverse transcription using the Evo M-MLV RT Premix (#AG11706, Accurate Biology).RT-qPCR was performed using the NovoStart® Universal Fast SYBR qPCR SuperMix (#E401, Novoprotein Scientific Inc.) and Bio-Rad CFX 96 fluorescent quantitative PCR instrument. Primers are described in Table S9.
Western blot (WB)
Before performing WB, an equal weight of tissues was lysed by the cell lysates with protease and phosphatase inhibitors on the ice. Then, we homogenized, sonicated, and centrifuged at 12,000 r/min for 30 min at 4°. The supernatant was extracted for protein quantification and WB. Due to limited protein yield from corpus cavernosum tissues, samples from two rats were pooled at equal concentrations for immunoblotting. This approach is consistent with prior studies using low-abundance tissues55. Equal proteins were separated by SDS–PAGE and transferred to PVDF membranes. Membranes were incubated overnight at 4 °C with diluted primary antibodies for 16 h and incubated at 4 °C with diluted second antibodies for 4 h. The Western blot was finally exposed using ECL substrate (#310212, Zeta Life) and imaged with a Bio-Rad imaging system. The antibodies used are listed in Table S7.
Immunoprecipitation
The cells were lysed with 500 μL of weak RIPA lysate overnight on a 4 °C shaker. Then, the lysate was centrifuged at 12,000 rpm at 4 °C for 20 min, and the supernatant was taken for protein quantification. After taking 500 μg protein into the new centrifuge tube, add the corresponding IP antibody at 1:100 and incubate on a 4 °C shaker overnight. Protein A/G PLUS Agarose was washed with weak RIPA lysate three times and added to the antibody-incubated samples overnight, and incubated again. On the second day, the mixture was centrifuged at 2000 RPM at 4 °C for 5 min, and the supernatant was removed. After washing with 300 μL weak RIPA lysate 3 times, the residue was lysed by SDS and detected by WB. The antibodies and reagents used are shown in Table S7-S8.
Nitrite/nitrate levels assay
The nitric oxide (NO) end products nitrite/nitrate in the serum of participants/rats and corpus cavernosum of rats were determined by the nitrite/nitrate levels assay kit (#S0021, Beyotime). Firstly, centrifuge human or rat fresh blood at 1500–2000 × g for 10 min and collect the serum. Collect the rat corpus cavernosum tissue supernatant after homogenizing the tissue in ice-cold PBS and centrifuging at 12,000 × g for 15 min at 4 °C. Then, prepare the standard curve (0–100 μM). Add 50 μL of standards or samples, 50 μL Griess Reagent I, and 50 μL Griess Reagent II immediately to each well. Mix gently and incubate away from light at RT for 15 min. Finally, read absorbance at 540 nm and calculate nitrite/nitrate concentrations from the standard curve.
MLCK levels detection
The MLCK levels in the serum of participants and rats were determined using the human and rat MLCK ELISA kits (#HM11395 and #RA20766, Bioswamp). Firstly, collect the serum of the participants and rats. Then, add 50 μL of standards (in duplicate) or 40 μL of serum and 10 μL of biotinylated antibody, and 50 μL of HRP-conjugate to each well (except the blank) step by step. Incubate for 30 min at 37 °C and wash 5 times with 1× wash buffer (300 μL/well) between each step. Add 50 μL Chromogen A/B, incubate for 10 min in the dark, and stop with 50 μL stop solution. Finally, read OD at 450 nm within 15 min (blank well as zero) and calculate the MLCK levels according to the standard curve.
Cell contraction assay
According to previous studies and kit instructions (#CBA-201, Cell Biolabs)56,57. In detail, primary CCSMCs at the same cell passage number, less than four, were collected to make cell suspension at the concentration of 2–5 × 10⁶ cells/mL, and the suspension was mixed with collagen gel in a ratio of 1:4. Next, 0.5 mL of cell collagen mixture was placed in each well of the 24-well plate and incubated at 37 °C for 1 h. After collagen polycondensation, place 1 mL of medium in each well and gently separate the collagen block from the edge of the dish with the sterile blunt tablet. The cells were cultured continuously in the dish with DMEM (10%FBS) with or without high uric acid (450 μm) for 48 h and photographed at different times.
Molecular docking
LigandScout software simulated the binding site between uric acid (PubChem CID: 1175) and MLCK protein (Uniport: Q15746). By optimizing the position and conformation, the biangular surface of the rotatable bond, the side chain of the amino acid residues, and the skeleton of the target protein58,59,60, the conformation with the lowest energy was found when MLCK bound to uric acid in its active region.
Cellular thermal shift assay (CTSA)
The method works by heating cells to different temperatures to denature and precipitate proteins. After repeated freezing and thawing, the cells were lysed. After the cell lysates were centrifuged to precipitate, the soluble proteins in the supernatant were quantified by Western Blot or mass spectrometry. According to the corresponding relationship between protein content and temperature, the temperature corresponding to 50% protein content can be obtained, that is, the melting point. CTSA is a biophysical detection method based on the principle of ligand-induced thermal stability of target protein, which means that the melting point of the protein will change with the interaction of ligand, i.e., the direct binding of the small molecule to protein will affect the melting point of the protein61,62,63,64.
Surface plasmon resonance (SPR)
Following the manufacturer’s instructions, Biacore T100 and CM7 sensor chips were used. Data were analyzed by Biacore T100 Evaluation software (GE Healthcare). All assays were performed at 25 °C. In brief, the CM7 sensor chip was activated, and MLCK WT or N803A protein was immobilized on the chip’s surface. Next, the chip was blocked and equilibrated with PBS. Next, the uric acid stock solution (0.1 mM) was diluted in PBS to a series of concentrations (50, 25, 12.5, and 6.25 μM). Then, the uric acid solution flowed at 30 μl min–1 for 150 s each run. Finally, the Steady model calculated the dissociation constants (KD).
Live-cell imaging
1×10⁵ cells/Well were inoculated on 24-well plates. After synchronous treatment the next day, an automatic high-throughput live cell imaging analysis system (BioTek-Lionheart FX) was used to take pictures every 30 min for 48 h to observe the cell contraction.
Statistics and reproducibility
SPSS24 software and GraphPad Prism 8 were used for statistical analysis and graphing. Continuous quantitative data conforming to normal distribution were represented by mean ± standard deviation (Mean ± SD). The two-tailed unpaired and paired t-test were used to compare the differences between the two groups under appropriate circumstances. One-way ANOVA and Dunnett’s multiple comparisons test were used for the different comparisons of multiple groups of continuous variables. The Chi-square test was applied to compare event rates. Risk factors for the disease were investigated using Logistic regression analysis to calculate OR and 95% CI. P-value < 0.05 was considered statistically significant. Sample sizes (n), defined as biologically independent units (e.g., individual participants or animals) are stated for each experiment in figure legends. Biological replicates (n) represent independently processed biological samples under identical conditions. All experiments were independently repeated at least three times with consistent results and are stated in figure legends.