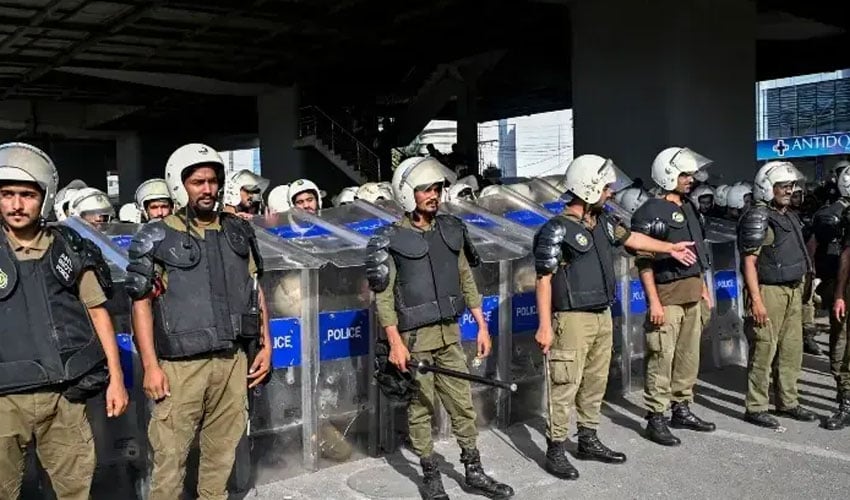
Literature search
An initial search yielded 319 articles from the Medline, Embase, and Cochrane Library databases. After removing 68 duplicates, the titles and abstracts of the remaining 251 unique studies were reviewed. Of these studies, 63 studies were subjected to a full-text review, resulting in the identification of 50 eligible RCTs9,10,11,12,13,14,15,16,17,18,19,20,21,22,23,24,25,26,27,28,29,30,31,32,33,34,35,36,37,38,39,40,41,42,43,44,45,46,47,48,49,50,51,52,53,54,55,56,57,58. Excluded studies after the full-text review included 7 retrospective studies, 3 studies with inappropriate designs, and 3 studies with inadequate endpoints (Fig. 1). The PRISMA checklist is provided in Supplementary Table S4.
PRISMA study selection flow diagram.
Study characteristics
The eligible studies, published between 2018 and 2023, involved a total of 9,193 participants9,10,11,12,13,14,15,16,17,18,19,20,21,22,23,24,25,26,27,28,29,30,31,32,33,34,35,36,37,38,39,40,41,42,43,44,45,46,47,48,49,50,51,52,53,54,55,56,57,58. Table 1 presents a summary of the key characteristics of the included RCTs. Among these trials, 10 RCTs focused on geriatric populations, with the elderly cohort defined by a varied age range from over 60 to over 75 years19,20,22,24,34,41,45,47,53,56. Nine RCTs specifically included female patients undergoing breast, thyroid, obstetric, or gynecologic surgery15,23,25,35,36,48,49,54,55. The comparators used for evaluating remimazolam in the studies were as follows: propofol in 37 RCTs9,11,13,14,15,16,17,18,19,20,21,22,23,24,26,28,29,30,31,33,35,36,37,39,40,41,43,48,49,50,51,52,53,55,56,57,58inhalation agents in 4 RCTs25,42,45,54dexmedetomidine in 5 RCTs10,27,32,34,47midazolam in 3 RCTs12,44,46and etomidate in 1 RCT38. A total of 24 trials enrolled patients receiving general anesthesia9,13,14,23,24,25,29,30,34,35,36,38,39,41,42,43,45,50,51,52,53,54,55,58and 26 trials included patients receiving procedural sedation10,11,12,15,16,17,18,19,20,21,22,26,27,28,31,32,33,37,40,44,46,47,48,49,56,57. In addition, 17 trials focused on patients undergoing GI endoscopy11,12,16,17,18,19,20,21,22,26,28,29,31,33,37,56,574 trials involved patients undergoing bronchoscopy9,10,39,44and 29 trials included patients undergoing other surgical procedures13,14,15,23,24,25,27,30,32,34,35,36,38,40,41,42,43,45,46,47,48,49,50,51,52,53,54,55,58. Notably, none of the trials targeted patients undergoing cardiac surgery. Among the reviewed RCTs, 33 trials collectively reported PONV as an outcome. Moreover, 18 trials specifically focused on postoperative nausea11,12,13,16,17,19,23,31,33,36,40,43,44,46,50,53,54,57and 17 trials examined postoperative vomiting9,11,12,13,16,19,23,31,33,36,40,43,44,46,50,54,57.
Risk of bias
The risk of bias for individual studies is presented in Fig. 2 and Supplemental Figure S5. In bias assessment, “some concerns” were identified in 3 RCTs for randomization, 2 RCTs for deviations from intended interventions, 3 RCTs for outcome measurement, and 19 RCTs for selective reporting. All included RCTs demonstrated a low risk of bias for missing outcome data. Overall, 25 trials were classified as having “some concerns” regarding bias, and the remaining 25 trials were categorized as having a “low risk”.

Risk of bias percentage across domains.
Overall analysis
A pooled analysis of 9,193 participants indicated that the effect of remimazolam on PONV was comparable to that of other anesthetics (random effects model; RR: 0.96, 95% CI: 0.80–1.13, P = 0.607, I2: 21%; Fig. 3). The analysis revealed no significant publication bias, as evidenced by the funnel plot (Fig. 4A) and Egger’s test (P = 0.323).

Forest plot for overall analysis. RR, relative risk; 95% CI, 95% confidence interval.

Funnel plot. A: Overall analysis, B-E: Subgroup analysis—variations according to anesthetic comparators, F-G: Subgroup analysis—general anesthesia vs. procedural sedation, H-J: Subgroup analysis—variations according to surgical procedure types, K: Subgroup analysis—elderly patients only, L: Subgroup analysis—female patients only, M: Subgroup analysis—nausea only outcome, N: Subgroup analysis—vomiting only outcome, O: Subgroup analysis—continuous infusion, P: Subgroup analysis—intermittent bolus, Q: Sensitivity analysis—PONV as primary outcomes.
Subgroup analysis 1: variations according to anesthetic comparators
In comparison with propofol, remimazolam demonstrated a similar incidence of PONV (fixed effects model; n = 7,340; RR: 1.03, 95% CI: 0.89–1.20, P = 0.676, I2: 14%; Fig. 5). However, compared with inhalation anesthetics, remimazolam was associated with a lower incidence of PONV (fixed effects model; n = 363; RR: 0.50, 95% CI: 0.34–0.73, P < 0.001, I2: 33%). No significant difference in PONV incidence was observed between remimazolam and dexmedetomidine (fixed effects model; n = 504; RR: 0.94, 95% CI: 0.75–1.19, P = 0.621, I2: 9%) or between remimazolam and midazolam (fixed effects model; n = 853; RR: 0.86, 95% CI: 0.32–2.28, P = 0.757, I2: 0%). Analysis of etomidate was not feasible due to the presence of only a single RCT, which reported no PONV cases. Subgroup analyses for the propofol, inhalation, dexmedetomidine, and midazolam comparator groups showed no significant publication bias, as determined by Egger’s test (P = 0.113, 0.309, 0.864, and 0.141, respectively). The corresponding funnel plots are presented in Fig. 4B-E.

Forest plot for subgroup analysis—variations according to anesthetic comparators. RR, relative risk; 95% CI, 95% confidence interval.
Subgroup analysis 2: general anesthesia vs. procedural sedation
Subgroup analysis stratified by anesthesia type (general anesthesia vs. procedural sedation) revealed that the effect of remimazolam on PONV did not differ significantly from that of other anesthetics in patients receiving either general anesthesia (fixed effects model; n = 3,137; RR: 0.91, 95% CI: 0.74–1.12, P = 0.368, I2: 30%; Supplemental Fig. S6) or procedural sedation (fixed effects model; n = 6,056; RR: 0.96, 95% CI: 0.83–1.12, P = 0.591, I2: 15%). No significant publication bias was detected, as demonstrated by funnel plots (Fig. 4F and G) and Egger’s test results (general anesthesia: P = 0.986, procedural sedation: P = 0.157).
Subgroup analysis 3: variations according to surgical procedure types
Subgroup analysis stratified by procedure type showed that the effect of remimazolam on PONV was comparable to that of other anesthetics among patients undergoing GI endoscopy (fixed effects model; n = 4,724; RR: 0.91, 95% CI: 0.76–1.11, P = 0.358, I2: 15%; Supplemental Fig. S7), bronchoscopy (fixed effects model; n = 858; RR: 1.02, 95% CI: 0.80–1.30, P = 0.875, I2: 44%), and other surgical procedures (fixed effects model; n = 3,611; RR: 0.94, 95% CI: 0.77–1.14, P = 0.542, I2: 28%). No significant publication bias was identified in subgroup analyses focusing on GI endoscopy, bronchoscopy, and other surgical procedures, as indicated by both funnel plots (Fig. 4H-J) and Egger’s test results (P = 0.342, 0.334, and 0.914, respectively).
Subgroup analysis 4: elderly patients
A review of 10 RCTs involving 1,692 geriatric patients excluded a study from the analysis due to the absence of PONV. Among these geriatric patients, no significant difference in PONV incidence was observed between those treated with remimazolam and those treated with other anesthetics (fixed effects model; n = 1,692; RR: 1.14, 95% CI: 0.88–1.49, P = 0.322, I² = 0%; Supplemental Fig. S8). The funnel plot (Fig. 4K) and Egger’s test (P = 0.638) indicated no significant publication bias.
Subgroup analysis 5: female patients
An analysis of 9 RCTs involving 1,061 female patients found no significant difference in the risk of PONV between remimazolam and other anesthetics (fixed effects model; n = 1,061; RR: 0.89, 95% CI: 0.61–1.30, P = 0.541, I² = 37%; Supplemental Fig. S9). Egger’s test revealed no evidence of publication bias (P = 0.092), with the corresponding funnel plot shown in Fig. 4L.
Subgroup analysis 6: nausea-only outcome
Postoperative nausea was specifically reported by 18 RCTs (Fig. 6). When compared with propofol, remimazolam exhibited no significant difference in postoperative nausea incidence (fixed effects model; 14 RCTs, n = 3,750; RR: 0.92, 95% CI: 0.76–1.11, P = 0.363, I² = 18%). One RCT comparing remimazolam with inhalation anesthetics showed a lower risk of postoperative nausea for remimazolam (n = 60; RR: 0.44, 95% CI: 0.23–0.86). Three RCTs comparing remimazolam to midazolam reported no significant difference in postoperative nausea incidence (fixed effects model; n = 853; RR: 0.86, 95% CI: 0.32–2.28, P = 0.757, I² = 0%). Due to a lack of RCTs reporting postoperative nausea as an outcome, analysis of dexmedetomidine and etomidate was not feasible. No publication bias was detected in subgroup analyses for propofol (Egger’s test: P = 0.208) and inhalation agents (Egger’s test: P = 0.141; funnel plot: Fig. 4M).

Forest plot for subgroup analysis—nausea only outcome. RR, relative risk; 95% CI, 95% confidence interval.
Subgroup analysis 7: vomiting-only outcome
Postoperative vomiting was specifically reported by 17 RCTs (Fig. 7). When compared with propofol in 13 RCTs involving 3,860 patients, remimazolam was associated with a higher incidence of postoperative vomiting (fixed effects model; n = 3,860; RR: 1.41, 95% CI: 1.05–1.90, P = 0.024, I² = 0%). However, a single RCT comparing remimazolam with inhalation anesthetics showed no difference in postoperative vomiting risk (n = 60; RR: 1.00, 95% CI: 0.28–3.63). Similarly, 3 RCTs involving 853 patients showed no significant difference in postoperative vomiting incidence between remimazolam and midazolam (fixed effects model; n = 853; RR: 0.82, 95% CI: 0.24–2.78, P = 0.750, I² = 0%). Egger’s test indicated no significant publication bias in subgroup analyses for propofol (P = 0.197) and inhalation agents (P = 0.890; funnel plot: Fig. 4N).

Forest plot for subgroup analysis—vomiting only outcome. RR, relative risk; 95% CI, 95% confidence interval.
Subgroup analysis 8: continuous infusion vs. intermittent bolus of remimazolam
In subgroup analysis stratified by remimazolam administration protocol, the incidence of PONV did not differ significantly between remimazolam and other anesthetics in studies using either continuous infusion (fixed effects model; n = 4,795; RR: 0.94, 95% CI: 0.82–1.07, P = 0.478, I² = 21%) or intermittent bolus (fixed effects model; n = 4,398; RR: 0.87, 95% CI: 0.66–1.14, P = 0.483, I² = 24%; Supplemental Fig. S10). No evidence of publication bias was observed in subgroup analyses for continuous infusion and intermittent bolus, as demonstrated by funnel plots (Fig. 4O–P) and Egger’s test (P = 0.984 and 0.068, respectively).
Meta-regression analysis: effects of mean age, sex distribution, and coadministered opioids
In a random-effects meta-regression model using mean age as the moderator, the age coefficient was 0.01 (95% CI: − 0.01–0.03, P = 0.412), indicating no significant effect of age; the age-specific R² analog (proportion of between-study variance explained) was 0.03 (Supplemental Fig. S11).
When the proportion of male participants served as moderator, the coefficient was 0.01 (95% CI: 0.00–0.02, P = 0.236), demonstrating that sex distribution did not have a significant effect; the R² analog was less than 0.01 (Supplemental Fig. S11).
In a random-effects meta‐regression model with the type of coadministered opioids as a categorical moderator (reference: no opioid coadministration, 9 RCTs), the coefficients for remifentanil, alfentanil, fentanyl, and sufentanil were − 0.64 (95% CI: −1.40–0.12, P = 0.098, 22 RCTs), − 0.39 (95% CI: −1.15–0.37, P = 0.311, 8 RCTs), 0.33 (95% CI: −0.67–1.34, P = 0.516, 6 RCTs), and 0.03 (95% CI: −1.07–1.13, P = 0.959, 5 RCTs), respectively. None of them differed significantly from the reference, and the R² analog was 0.33.
Sensitivity analysis: PONV as the primary outcome
Three RCTs involving 309 patients specifically assessed PONV as the primary outcome. Sensitivity analysis demonstrated no significant difference in PONV risk between remimazolam and comparator anesthetics (random effects model; RR: 0.78, 95% CI: 0.39–1.59, P = 0.499, I² = 52%; Supplemental Fig. S12). Egger’s test revealed no evidence of publication bias (P = 0.385), with the corresponding funnel plot shown in Fig. 4Q.