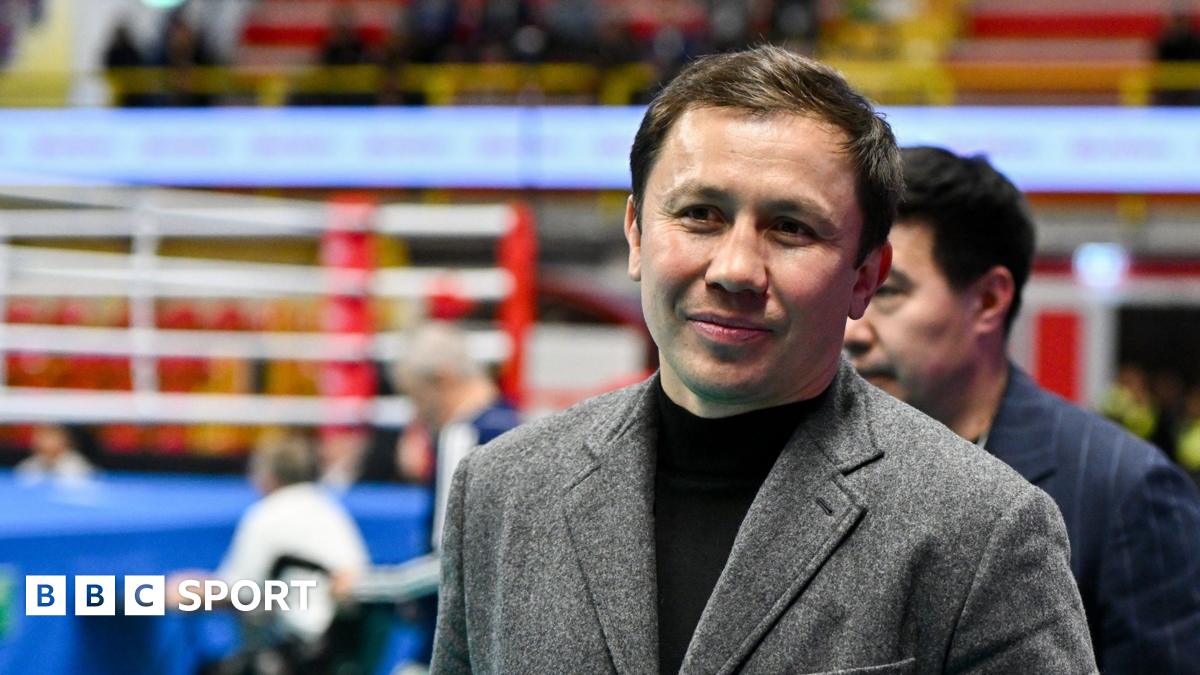
Functional and internalizing disorders co-aggregate with cardiometabolic and immune-related diseases within families: a population-based cohort study | BMC Medicine

Study population

We analysed data from Lifelines, which is a multi-disciplinary prospective population-based cohort study examining in a unique three-generation design the health and health-related behaviours of 167,729 persons living in the North of the Netherlands. It employs a broad range of investigative procedures in assessing the biomedical, socio-demographic, behavioural, physical, and psychological factors which contribute to the health and disease of the general population, with a special focus on multi-morbidity and complex genetics. Details on data collection and inclusion have been published elsewhere [14]. The Lifelines cohort is representative of the general population of the northern Netherlands [15].

We used data from the first wave (1A; 2007–2013) and its two follow-up questionnaires (1B and 1C, mean 2 and 3 years after inclusion, respectively), the second wave (2A; mean 4 years after inclusion), and the third wave (3A; mean 10.5 years after inclusion), its follow-up questionnaire (3B, mean 12 years after inclusion), and an add-on questionnaire on skin diseases [16] (mean 9 years after inclusion). We used data from all participants, including children, with sufficient data to ascertain case status for at least one of the studied disorders (n = 166,774).

For all studied disorders and diseases, we classify participants as lifetime cases or controls, meaning that they are cases if they fulfil the case definition in at least one assessment. If they do not fulfil the case definition in any non-missing assessment, they are classified as controls. Participants who are thus cases at one assessment and controls in another are considered lifetime cases and included in the analyses as such. We applied the same logic to composite phenotypic definitions; participants were not required to have complete data on all phenotypes to be a control. If they were controls at all non-missing assessments, they were coded as controls.

Functional disorders

Data on FDs was collected during wave 2A and 3A through questionnaires assessing all symptom criteria, from which we derived diagnoses of ME/CFS, FM, and IBS. We used the 1994 Centers for Disease Control and Prevention criteria [17] for ME/CFS and the 2010 American College of Rheumatology criteria [18] for FM. We used adjusted ROME III criteria [19] for IBS to align with ROME IV (recurrent abdominal pain more than one day per week for at least 6 months, along with two additional symptoms) [20].

Internalizing disorders

Data on current MDD (past 2 weeks) and GAD (past 6 months) were collected in waves 1A, 2A, and 3A using the Mini-International Neuropsychiatric Interview (MINI) [21], from which we ascertained diagnoses according to the DSM-IV-TR criteria [22]. Since lifetime measures of MDD and GAD were not available for many participants due to missing data, we used aggregated cross-sectional case/control status across three waves.

Cardiometabolic phenotypes

We defined five cardiometabolic phenotypes: obesity, type II diabetes mellitus (T2D), hypertension, metabolic dysfunction-associated steatotic liver disease (MASLD) and cardiovascular disease (CVD). These disorders are common and significantly heritable [23]. Furthermore, they have a range of shared (e.g. oxidative stress, insulin resistance, low-grade inflammation) and unique mechanisms (e.g. renin–angiotensin–aldosterone system dysregulation in hypertension, beta-cell dysfunction in T2D).

Hypertension

Blood pressure was measured using an automatic sphygmanometer at assessment 1A, 2A, and 3A. We defined hypertension as either systolic pressure ≥ 140 mmHg, diastolic pressure ≥ 90 mmHg in any assessment, or antihypertensive use at 1A.

Obesity

Anthropometry was performed when participants visited the research centres at waves 1A, 2A, and 3A. We defined obesity according to the WHO definition [24], which is a BMI ≥ 30 for adults and a BMI of 2 standard deviations above the WHO reference median for participants aged below 20.

Metabolic associated steatotic liver disease

MASLD is a chronic disease characterized by excessive fat accumulation in the liver in the absence of secondary causes such as significant alcohol consumption. At wave 1A, γ-glutamyltransferase and triglycerides were measured in blood in a subset of participants (N = 58,466). Together with anthropometric data, we calculated the fatty liver index as described elsewhere [25]. We defined MASLD as a fatty liver index ≥ 60.

Type II diabetes mellitus

Since type 1 diabetes (T1D) and T2D have a distinct pathophysiology (autoimmune vs insulin resistance), we distinguished between these two phenotypes by combining multiple types of relevant data. Generally, we defined T2D based on self-report items, glycaemic blood abnormalities, or the use of glucose-lowering drugs, with exclusion criteria for possible T1D based on insulin use and age at onset. Not all criteria could be applied in all waves, and in those, we used adapted criteria. Detailed criteria are provided in Additional file 1: Supplementary Methods [16, 26,27,28,29,30,31,32,33].

Cardiovascular disease

We defined cardiovascular disease (CVD) as a composite measure of heart failure, myocardial infarction, coronary artery bypass surgery or percutaneous coronary intervention, stroke, and intermittent claudication. We used self-report items, medication, and electrocardiography data (Additional file 1: Supplementary Methods). Our definition corresponds to that used in a previous paper in Lifelines [23], but with the addition of intermittent claudication and incorporating data across all assessments.

Immune-related diseases

We assessed two composite phenotypes of immune-related diseases, consisting of autoimmune diseases and atopy. Both involve immune dysregulation but have distinct pathophysiologies, as atopy is characterized by IgE-mediated hypersensitivity to external allergens whereas autoimmune diseases involve loss of immune tolerance causing lymphocytes to target self-antigens.

Autoimmune disease

Autoimmune diseases have a strong shared genetic component, but are individually relatively rare [34]. To increase power, we defined autoimmune disease as a composite measure of multiple autoimmune diseases (T1D, rheumatoid arthritis, autoimmune thyroid disease, multiple sclerosis, psoriasis, celiac disease, Crohn’s disease or ulcerative colitis). We used a combination of self-reported, laboratory, and medication data (Additional file 1: Supplementary Methods).

Atopy

Data on atopic diseases were collected in multiple questionnaires, with separate questionnaires for children and adults. We defined atopy as food allergy [29], asthma or eczema, based on self-report items and supported by drugs where possible (Additional file 1: Supplementary Methods).

Pedigree data

Pedigree data in Lifelines is based on information from municipal registries, self-reported familial relationships from participants, and validated with molecular genetic data if these data were available (around N = 80,000 participants). Nearly two-thirds of participants (N = 106,282, 63.7%) had at least one first-degree relative (parent, sibling, child) in the dataset, with a median of two first-degree relatives in participants with at least one first-degree relative. A minority of participants (N = 33,691, 20.2%) had at least one second-degree relative (half-sibling, grandparent, grandchild, aunt, uncle, niece, nephew) in the dataset, with a median of two second-degree relatives in participants with at least one second-degree relative.

For each participant, we used pedigree data to determine if they had a first- or second-degree relative affected by the relevant disorders. We did not use data provided by the proband on their family members; thus, only individuals with a relative in the dataset with data on the studied disorders had the possibility of having an affected relative. Furthermore, individuals with relatives in the dataset may be dissimilar in other ways compared to the general population. We therefore included the number of first- and second-degree relatives in the dataset with data on the relevant studied disorder for each participant as covariates for the subsequent analyses with that disorder.

Demographics

We included age and sex as covariates in the analyses. Sex in Lifelines is recorded from the Dutch Personal Records Database. We defined age separately for cases and controls of each phenotype. For cases, age was defined as the age at which participants first satisfied the case definition. For controls, it was defined as the last age at which participants had relevant data available. This accounts for some participants not having relevant data at some waves of data collection, for instance due to dropout or death.

Statistics

We estimated recurrence risk ratios (λR) to quantify familial co-aggregation [35]. For each pair of disorders, λR is the ratio between the prevalence of one disorder in individuals with an affected first-degree relative divided by the general population prevalence. For example, in the MDD-MASLD pair, we estimated the ratio of MDD prevalence in individuals with a first-degree relative with MASLD to MDD prevalence in the general population, and vice versa. A ratio above 1 indicates shared familial risk.

We estimated prevalences using logistic regression models, with exposure of having an affected first-degree relative and adjusted for age, age2 (to account for non-linear prevalence patterns by age), sex and number of first-degree relatives in the dataset. We calculate plug-in prevalence estimates as average adjusted predictions across the entire sample, and in individuals with an affected first-degree relative. We accounted for correlated measurements within families using robust standard errors with a sandwich estimator. We calculated λR as the simple ratio between prevalences, and we used the Delta method [30] to calculate the standard error of λR assuming independence between the numerator and denominator.

Next, we estimated familial correlations (rf), which measure the shared variance of traits attributable to familial factors, which include both genetic and common environmental effects. Since our analysis uses relatives instead of twins, our estimates capture combined genetic and common environmental causes instead of strictly genetic causes [36].

We estimated familial correlations using the Wray & Gottesman method [37], which is based on the liability threshold model, where disease status is determined by an underlying normally distributed liability [38]. The estimation depends on prevalence estimates in the general population and in individuals with affected first-degree relatives, as well as with affected second-degree relatives. We adjusted both models for the number of first- or second-degree relatives in the dataset with data on the phenotype. Details and equations are provided in Additional file 1: Supplementary Methods, while an example R script for estimating marginalized prevalences, recurrence risk ratios, and familial correlations is also provided (Additional file 2).

Preregistration, inference criteria and reporting

We preregistered our analysis plan (https://osf.io/kj7dx) with subsequent modifications to phenotype definitions and multiple testing corrections. Changes are detailed in Additional file 1: Supplementary Methods.

We tested directional hypotheses for both recurrence risk ratios (H0: λR = 1, H1: λR > 1) and for familial correlations (H0: rf = 0, H1: rf > 0). Because we do not expect any effect in the other direction, we evaluated one-sided tests. These amounted to a total of 105 tests. Since these tests are not independent, and our aim is exploratory (to identify novel etiological associations) controlling the family-wise error rate would be too conservative. We controlled the false discovery rate at 0.05 across all tests using the Benjamini–Hochberg procedure [39]. We reported estimates with only the lower bounds of one-sided 95% confidence intervals (CIs), as the upper bound is infinite for λRs and 1 for rfs and not informative. This is the case because the CI in this case is defined by only a lower critical region, and the sampling distribution’s probability density extends infinitely in the positive direction (but correlations have a theoretical maximum value of 1) [30].

Sensitivity analysis

We conducted a sensitivity analysis to assess if our results were influenced by misclassification of FDs. We excluded participants that also reported having conditions that may present with similar symptoms or are mentioned as exclusionary in diagnostic guidelines [17]. These were multiple sclerosis, dementia, schizophrenia, or an eating disorder for ME/CFS; ulcerative colitis, Crohn’s disease, or coeliac disease for IBS; rheumatoid arthritis for FM; and hepatitis, cancer, or heart failure for all FDs.

Continue Reading