Study population characteristics
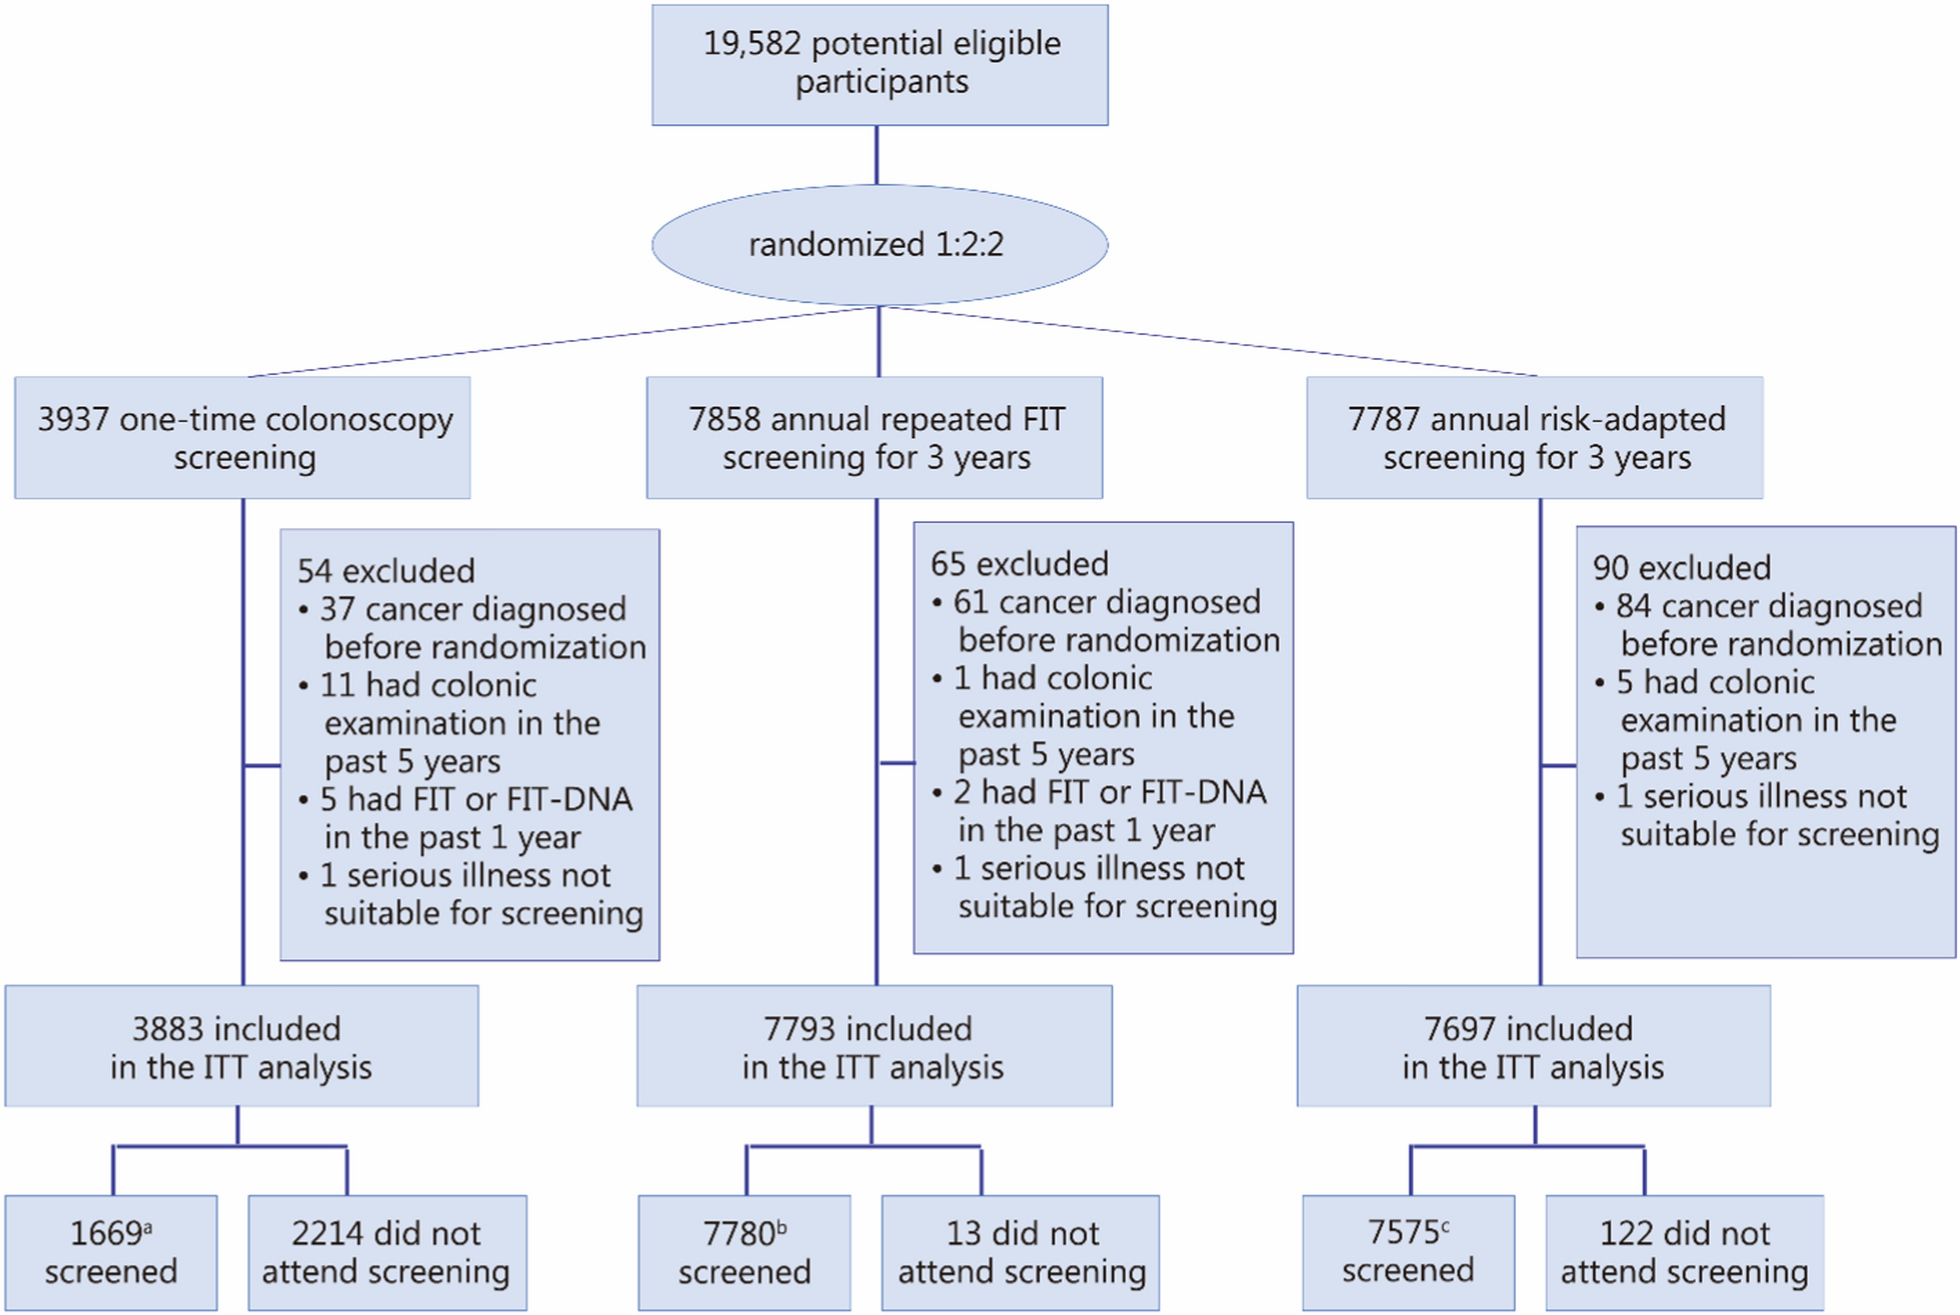
A total of 19,582 participants were recruited, of whom 209 were excluded for not meeting the inclusion criteria. The final analysis included 19,373 participants, with 3883 in the colonoscopy group, 7793 in the FIT group, and 7697 in the risk-adapted screening group (Fig. 1). Characteristics of the study population are shown in Additional file 2: Table S1. Among all participants, 8022 (41.7%) were men, with a mean age of 60.5 years. The distribution of basic characteristics was generally comparable across the 3 study arms, except for a slightly higher proportion of participants with a family history of CRC in the risk-adapted group.
Flow diagram of the study participants. a1644 had colonoscopy screening per protocol at baseline, 2 had colonoscopy, and 8 had FIT at the third round of screening, 1 had colonoscopy and 14 had FIT at the fourth round of screening. b7775 had attended at least 1 round of screening per protocol, and 5 examinations without having FIT or with a negative FIT result. c7122 had attended at least 1 round of screening per protocol, 103 underwent colonoscopy screening among low-risk individuals without having FIT or with negative FIT results, and 350 had FIT screening among high-risk individuals. FIT fecal immunochemical test, ITT intention-to-treat
Participation and compliance
Additional file 2: Table S2 and Fig. S1 illustrate the participation across the 3 arms from the T0 to T3 phases. The overall participation declined for both the FIT arm and the risk-adapted screening arm. In the FIT arm, participation at baseline was 94.0% (95% CI 93.5–94.5), which gradually decreased in subsequent rounds, although it remained relatively high (> 80%). In the risk-adapted screening arm, baseline participation was 85.2% (95% CI 84.4–86.0), declining to 63.4% (95% CI 62.3–64.5) by the 4th round. Additional file 2: Table S3 illustrates the participation of the risk-adapted screening arm, categorized by risk profile, from the T0 to T3 phases. In the risk-adapted arm, FIT participation rates among low-risk individuals were similarly high, ranging from 94.0% (95% CI 93.4–94.6) at baseline to 78.8% (95% CI 77.7–79.9) in the 4th round. However, among high-risk individuals, the colonoscopy participation rate was 49.0% (95% CI 46.4–51.6) at baseline; in the following 3 rounds, this rate decreased to 6.4% (95% CI 4.8–8.5), 10.5% (95% CI 8.6–12.7), and 3.7% (95% CI 2.7–5.0). Additional file 2: Table S4 illustrates the cumulative participation across the 3 arms from the T0 to T3 phases. The overall participation rates (attending at least 1 screening round) were 42.3% (1644/3883, 95% CI 40.8–43.9) in the colonoscopy arm, 99.8% (7775/7793, 95% CI 99.6–99.9) in the FIT arm, and 92.5% (7122/7697, 95% CI 91.9–93.1) in the risk-adapted arm. Regarding colonoscopy compliance among FIT-positive participants across the 4 screening rounds, the compliance rates in the FIT arm were 76.3% (817/1071), 75.7% (258/341), 71.7% (243/339), and 66.9% (81/121) for rounds 1 through 4, respectively, yielding an overall compliance rate of 74.7% (1399/1872). In the risk-adapted screening arm, the corresponding compliance rates among low-risk participants were 76.9% (601/782), 74.6% (182/244), 60.1% (98/163), and 63.5% (66/104) across the same rounds, with an overall compliance rate of 73.2% (947/1293) (Additional file 2: Fig. S1).
Detection rate for advanced neoplasm
Screening yield results from the ITT analysis are presented in Table 1, Fig. 2a, and Additional file 2: Table S5. The cumulative detection rates of advanced neoplasms over the 4 screening rounds were 2.8% (95% CI 2.3–3.3), 2.3% (95% CI 2.0–2.6), and 2.6% (95% CI 2.3–3.0) in the colonoscopy, FIT, and risk-adapted screening arms, respectively (Fig. 2a and Additional file 2: Table S5). After adjusting for age, sex, and study center, the ORs for the cumulative detection rate of advanced neoplasms were 1.21 (95% CI 0.95–1.55, P = 0.124) for colonoscopy vs. FIT, 1.06 (95% CI 0.83–1.34, P = 0.658) for colonoscopy vs. risk-adapted screening, and 1.15 (95% CI 0.93–1.41, P = 0.197) for risk-adapted screening vs. FIT (Table 1 and Additional file 2: Table S5). We observed that the risk-adapted screening arm had a slightly higher detection rate of advanced neoplasms among men compared to the FIT arm (OR = 1.30, 95% CI 1.01–1.67, P = 0.046), while the colonoscopy arm showed a higher detection rate among women compared to the risk-adapted screening arm (OR = 1.52, 95% CI 1.00–2.28, P = 0.046) (Table 1 and Additional file 2: Table S5). No statistically significant differences were found in the detection of advanced neoplasms in the proximal or distal colon/rectum across the 3 arms. A post hoc power analysis demonstrated 82.4% power to detect the observed differences in detection rates (Cohen’s w = 0.043), with a χ2 statistic of 4.76 (df = 2, P = 0.093). The results of detection rates for any colorectal neoplasm are shown in Additional file 2: Table S6.
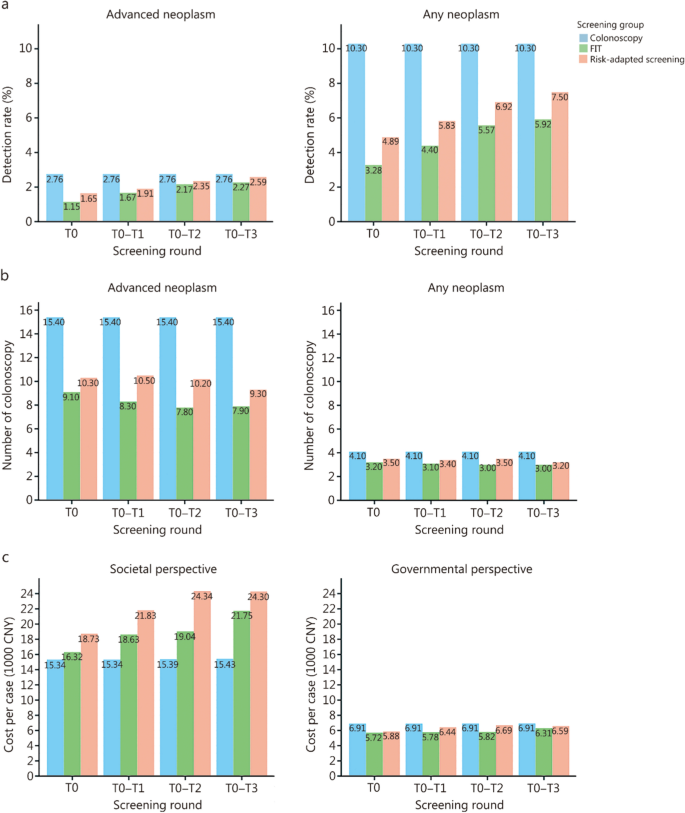
Comparison of screening yield and cost-effectiveness among different arms over 4 rounds of screening. a Detection rate for detecting advanced neoplasm or any neoplasm (ITT analysis). b Number of colonoscopies needed to be performed to detect 1 advanced neoplasm or any neoplasm. c Cost (in CNY 1000) for detecting 1 advanced neoplasm from the societal perspective and government perspective. CNY Chinese Yuan, FIT fecal immunochemical test, ITT intention-to-treat
In the PP analyses (Additional file 2: Table S7), detection rates of advanced neoplasms in the colonoscopy, FIT, and risk-adapted screening arms were 6.5%, 2.3%, and 2.7%, respectively, with an adjusted ORcolonoscopy vs. FIT of 2.42 (95% CI 1.87–3.11, P < 0.001), an adjusted ORcolonoscopy vs. risk-adapted screening of 1.90 (95% CI 1.48–2.44, P < 0.001), and an adjusted ORrisk-adapted screening vs. FIT of 1.32 (95% CI 1.07–1.63, P = 0.011).
Resource demand and costing outcomes
Detailed resource utilization and cost analysis results are shown in Fig. 2b, c, and Additional file 2: Tables S8–S10. In the colonoscopy arm, 15.4 colonoscopies were needed to detect 1 advanced neoplasm. In the FIT arm, the number of colonoscopies needed to detect 1 advanced neoplasm was 9.1, 8.3, 7.8, and 7.9 at T0, T0–T1, T0–T2, and T0–T3, respectively. In the risk-adapted screening arm, the corresponding values were 10.3, 10.5, 10.2, and 9.3 (Fig. 2b and Additional file 2: Table S8). From a societal perspective (Fig. 2c and Additional file 2: Table S9), the costs of detecting 1 advanced neoplasm were CNY 15,341 ($ 2223) for colonoscopy, CNY 21,754 ($ 3153) for FIT, and CNY 24,300 ($ 3522) for risk-adapted screening. From a government perspective (Fig. 2c and Additional file 2: Table S10), the costs for detecting 1 advanced neoplasm were comparable between the 3 strategies, with CNY 6914 ($ 1002) for colonoscopy, CNY 6313 ($ 915) for FIT, and CNY 6589 ($ 955) for risk-adapted screening.
Effectiveness on CRC incidence and mortality
Figure 3 and Additional file 2: Table S11 present the projected CRC incidence and mortality across the 3 screening arms and the no-screening scenario over 15 years. Over the 15 years, all screening strategies were associated with substantial reductions in both CRC incidence and mortality compared with no screening. Under the observed real-world adherence, the cumulative CRC incidence per 100,000 persons over 15 years was 1171, 1325, and 1293 for the colonoscopy, FIT, and risk-adapted screening arms, respectively, and 1552 for the no-screening group, corresponding to relative reductions of 24.6%, 14.6%, and 16.7%. The cumulative CRC mortality per 100,000 persons over the same period was 224, 210, and 234 for the colonoscopy, FIT, and risk-adapted screening arms, respectively, and 298 for the no-screening group, corresponding to reductions of 24.8%, 29.5%, and 21.5% relative to no screening. Therefore, in the TARGET-C trial (status quo), colonoscopy screening outperformed both FIT and risk-adapted screening. In addition, under the ideal scenario of 100% adherence, all strategies showed further improvements, with colonoscopy remaining the most effective in reducing CRC incidence and mortality. Compared with no screening, the relative reductions in CRC incidence and mortality were 41.0% and 45.3% for colonoscopy, 16.9% and 25.5% for FIT, and 37.9% and 35.9% for risk-adapted screening, respectively.
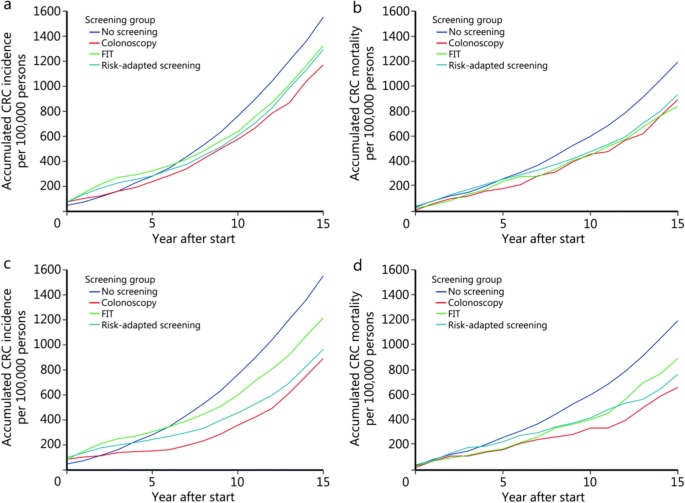
Long-term predicted colorectal cancer incidence and mortality of the 3 different screening arms and no screening. a Incidence under the status quo. b Mortality under the status quo. c Incidence under 100% adherence scenario. d Mortality under 100% adherence scenario. CRC colorectal cancer, FIT fecal immunochemical test
Cost-effectiveness analysis
Table 2 presents the cost-effectiveness analyses of the screening strategies over 15 years. All screening strategies were more cost-effective than no screening, using a WTP threshold of CNY 141,784 per QALY saved. Under the current scenario, colonoscopy screening yielded the highest discounted QALY per person at 9.631 (95% UI 9.618–9.645), with an ICER of 9060 CNY/QALY compared with no screening after 15 years. Within 15 years, risk-adapted screening and FIT screening were both dominated by colonoscopy.
To explore the impact of adherence on cost-effectiveness, we varied the probabilities of colonoscopy and FIT uptake (Additional file 2: Fig. S2a, b). FIT was the most cost-effective strategy in most scenarios when colonoscopy adherence fell to 20%. As colonoscopy adherence increased to 80%, colonoscopy screening became the most cost-effective approach in a greater number of scenarios. However, under the assumption of 100% adherence for both colonoscopy and FIT, the risk-adapted screening strategy was identified as the most cost-effective. The cost-effectiveness plane plot (Additional file 2: Fig. S2c), which illustrates this specific 100% adherence scenario, confirms the cost-effectiveness of the risk-adapted strategy under this condition.
Sensitivity analysis
In the sensitivity analysis, one-way analyses revealed that the ICERs of the screening strategies were sensitive to changes in the costs of FIT and colonoscopy, as well as transition rates across different disease states (Additional file 2: Fig. S3). Probabilistic sensitivity analyses and cost-effectiveness acceptability curves showed that colonoscopy screening had the highest probability of being cost-effective at the WTP threshold of 141,784 CNY/QALY (Additional file 2: Fig. S4).