Patient characteristics and treatment distribution
A total of 4,030 breast tumors categorized as classic HER2-negative from patients treated with either T-DXd or SG were included in our study. Based on recently developed further categorization of HER2 status, 45% (n = 1,815) were completely devoid of HER2 protein expression (HER2-null), while 55% expressed HER2 protein, among which 34% were HER2-low (n = 1,380) and 21% HER2-ultra-low (n = 838). Notably, the vast majority of patients received only one ADC in their treatment course (81%, n = 3,250) while a smaller subset (19%, n = 780) were treated with both agents (Table 1).
The median age of patients was comparable across treatment groups. Reflecting the greater prevalence of TNBC in Black women [23], there was a higher percentage of Black patients treated with SG only compared to T-DXd only (19% vs. 12%; P < 0.0001) and SG first compared to T-DXd first (18% vs. 13%; P < 0.0001). Patients treated with SG only or SG first were more likely (by 14% and 13%, respectively) to have biopsies derived from primary sites than visceral metastases, while patients treated with T-DXd only or T-DXd first were more likely (by 7% and 10%, respectively) to have biopsies derived from visceral metastases than primary sites (P < 0.001; Table 1).
Among 1,807 patients treated with SG only, a majority had HER2-null tumors (67%, n = 1,218), with smaller percentages of HER2-ultra-low (17%, n = 316) and HER2-low (15%, n = 273; P < 0.0001). Conversely, among 1,443 tumors from patients treated with T-DXd only, a majority were HER2-low (55%, n = 789), with smaller percentages of HER2-ultra-low (23%, n = 336) and HER2-null (22%, n = 318; P < 0.0001). Similarly, when examining patients treated with SG before T-DXd, a plurality was HER2-null (42%, n = 151/360), while a plurality of patients treated with T-DXd before SG had HER2-low tumors (45%, n = 190/420; P = 0.002; Table 1). These differences reflect real-world clinicians’ treatment choices for HER2-negative tumors based on HER2 status, and the preferential use of T-DXd and SG in HER2-low and HER2-null tumors, respectively.
Correlation of HER2 status with T-DXd but not SG TOT
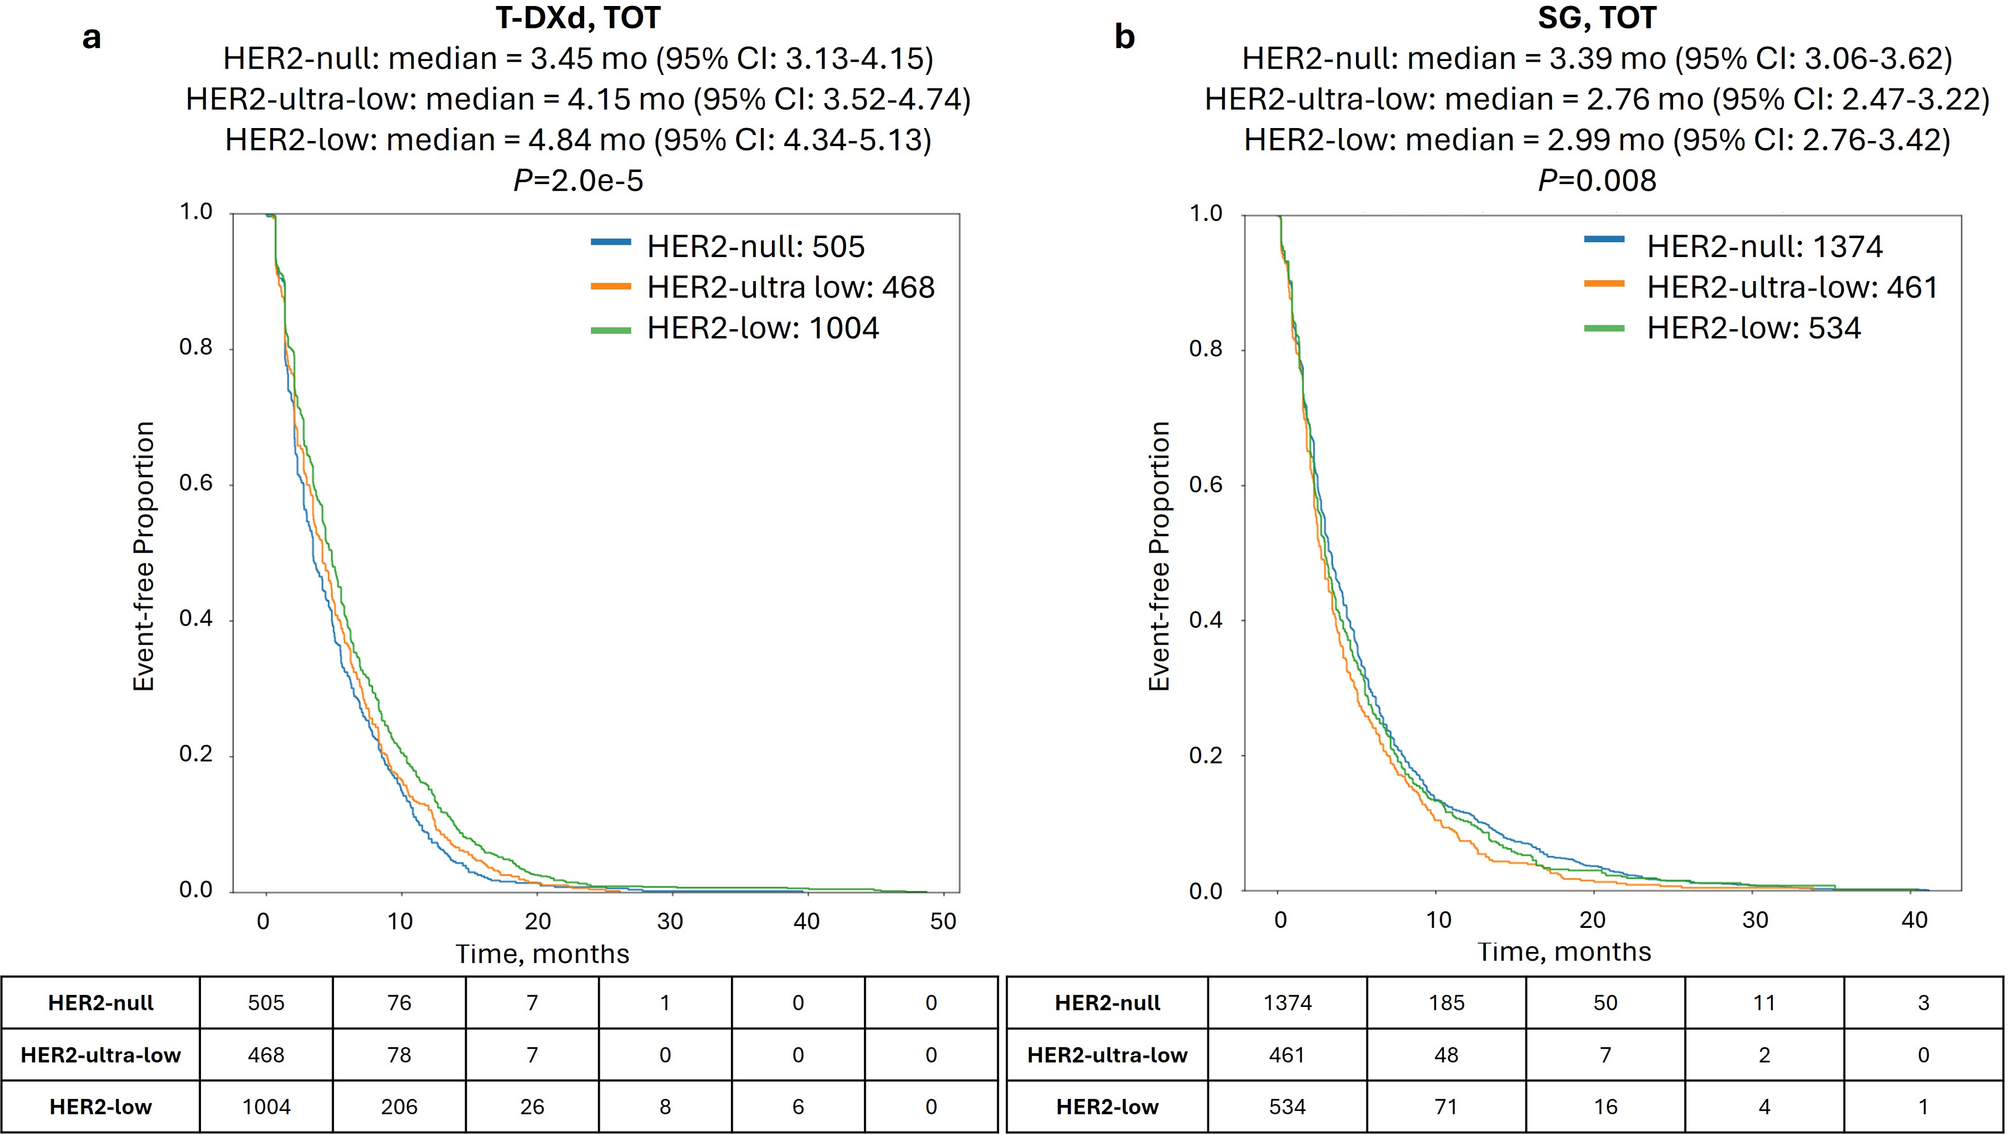
When investigating patient outcomes in cohorts stratified by HER2 status, HER2-low, HER2-ultra-low, and HER2-null cohorts treated with T-DXd had decreasing time-on-treatment (TOT; 4.84, 4.15, and 3.45 mo., P = 2.0e-5; Fig. 1a). Conversely, while SG TOT significantly differed according to HER2 status (P = 0.008), there was no decreasing trend observed (2.99, 2.76, and 3.39 mo. for HER2-low, HER2-ultra-low, and HER2-null, respectively; Fig. 1b).
Time-on-treatment (TOT) with T-DXd and SG according to HER2 status. Kaplan-Meier survival analysis of TOT with T-DXd (a) and SG (b) in HER2-null (blue lines), HER2-ultra-low (orange lines), and HER2-low (green lines)
T-DXd shows superior TOT compared to SG in HR+ tumors
We next compared TOT with T-DXd and SG in all HER2-negative patients treated with one ADC only. Notably, a significantly longer TOT was seen for T-DXd compared to SG [4.8 vs. 3.2 mo., hazard ratio = 0.801, 95% CI%: 0.744–0.862, P < 0.00001; Fig. 2a], which also held true in multivariate analysis considering other treatments received, specimen site, and BRCA1/2 mutation status (Supplementary Table S2). Interestingly, when stratifying by patients’ HR status, the effect was prominent in the HR+ subset [4.9 vs. 3.0 mo., hazard ratio = 0.616 (95% CI: 0.551–0.689), P < 0.0001; Fig. 2b) but was not significant in the HR- subset [4.1 vs. 3.4 mo., hazard ratio = 0.912 (95% CI: 0.783–1.063), P = 0.237; Fig. 2c].
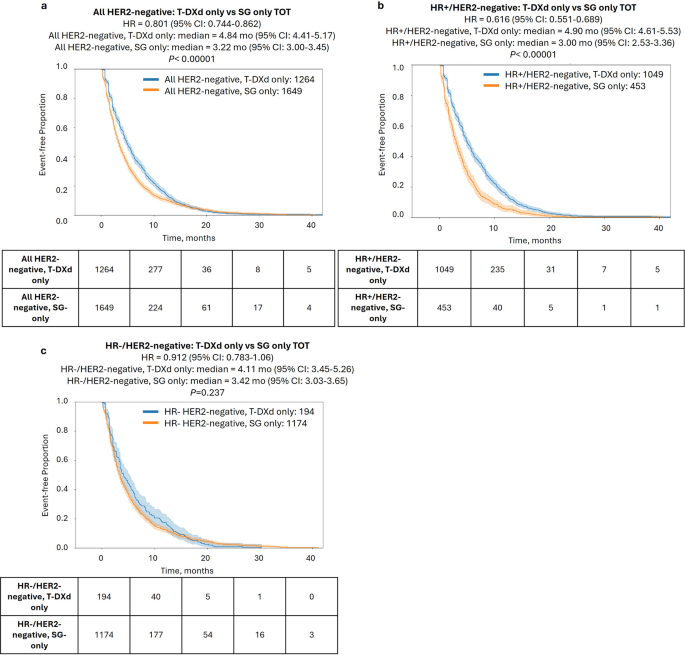
Time-on-treatment (TOT) with T-DXd only vs. SG only. Kaplan-Meier curves show TOT with T-DXd only vs. SG only in all HER2-negative patients (a), HR+/HER2-negative patients (b), and HR−/HER2-negative patients (c)
The striking TOT difference between HR+ and HR− patients prompted further investigation into TOT differences in HER2-negative categories (Table 2). Perhaps expectedly, we observed a significantly prolonged TOT with T-DXd compared to SG in both HER2-ultra-low [4.8 vs. 3.0 mo., hazard ratio = 0.71 (95% CI: 0.59–0.83), P < 0.001] and HER2-low cases [ 4.9 vs. 3.5 mo., hazard ratio = 0.83 (95% CI: 0.83-1.0), P = 0.011]. More unexpectedly, T-DXd showed a longer TOT than SG even in the HER2-null group [4.7 vs. 3.4 mo., hazard ratio = 0.91 (95% CI: 0.77-1.0)], although this did not reach the level of significance (P = 0.053). We next stratified by HR status. As we observed in the full HER2-negative cohort, the benefit of T-DXd over SG was restricted to HR+ tumors and was highly significant for all HER2-negative subsets including HER2-null tumors (P < 0.001; Table 2).
The exclusive benefit of T-DXd over SG in HR+ tumors led us to investigate whether HR status was a determining factor of T-DXd benefit. Interestingly, no significant effect was seen when comparing HR+ vs. HR− tumors across various HER2 categories for T-DXd (Supplemental Fig. S1a-b); in contrast, shorter TOT (but not OS) with SG was seen in HR+ tumors compared to HR− tumors [3.0 vs. 3.4 mo., hazard ratio = 1.3 (95% CI: 1.1–1.4), P < 0.00001)] (Supplemental Fig. S1c-d). Further analysis revealed significantly higher gene expression of TROP2 in HR− tumors [median TPM = 86.7, (95% CI: 79–92)] compared to HR+ [median = 65.8 (95% CI: 60–76)], consistent with previous reports [26]; however, a direct association of TROP2 expression and SG outcome was not seen (Supplementary Fig. S1e-f), suggesting that the improved benefit of SG in HR− tumors is not directly related to TROP2 expression.
Sequencing of T-DXd and SG impacts outcomes in HR−/HER2-null only
Finally, we examined outcomes according to the sequence of ADC treatment, comparing the interval from the start of the first ADC to the end of the second ADC (TOT2). In the full HER2-negative cohort, TOT2 was nearly identical for patients treated with T-DXd first versus SG first (Fig. 3a). When stratifying based on HER2 status, HER2-null cases showed a modest TOT2 advantage when treated with SG first compared to T-DXd first [hazard ratio = 0.66 (95% CI: 0.52–0.84), P < 0.001], while no difference in TOT2 was seen in the HER2-ultra-low and HER2-low groups (Fig. 3b, Supplementary Fig. S2). Similarly, no difference in OS (calculated from the start of the first ADC agent to last contact) was observed between patients treated with T-DXd first versus SG first in any of the HER2-negative subgroups (Fig. 4).
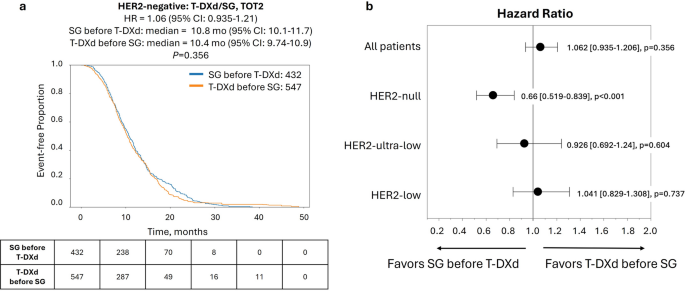
Time-on-treatment from start of first ADC to end of second ADC (TOT2) for patients in the full HER2-negative cohort according to treatment sequence of T-DXd and SG. (a) Kaplan-Meier curve shows median TOT2 of patients treated with SG before T-DXd (blue lines) vs. T-DXd before SG (orange lines). (b) Forest plot of hazard ratios for TOT2 with T-DXd before SG vs. SG before T-DXd in patient cohorts according to HER2 status
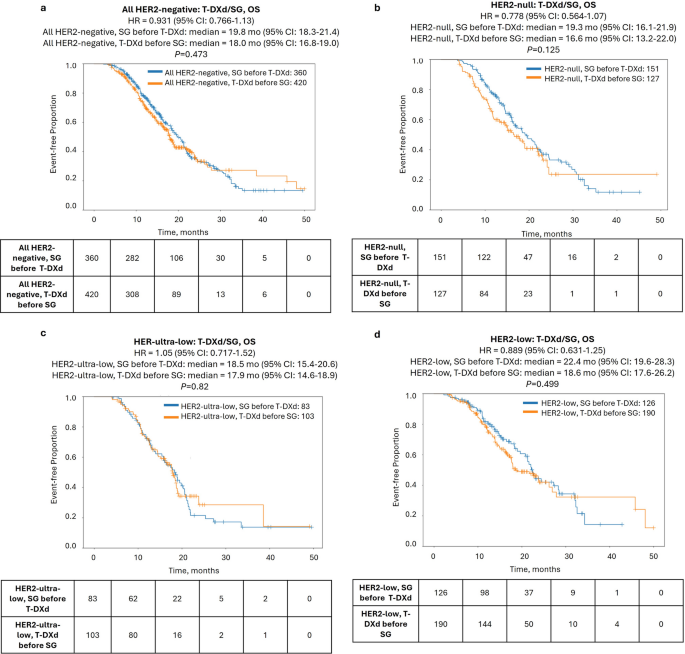
ADC-associated overall survival (OS) of patients in the HER2-negative cohort according to treatment sequence of T-DXd and SG. Kaplan-Meier curves show median OS of patients treated with T-DXd before SG (orange lines) vs. SG before T-DXd (blue lines) in the full HER2-negative cohort (a) and HER2-null (b), HER2-ultra-low (c), and HER2-low (d) cohorts
Further stratification by HR status revealed that sequencing mainly impacted outcomes in HR−/HER2-null tumors. There was a significant prolongation of TOT2 [11.7 vs. 7.4 mo., hazard ratio = 0.478 (95% CI: 0.333–0.685), P < 0.0001] when patients with HR−/HER2-null tumors were treated with SG-first compared to T-DXd-first, but no differences were noted in HR+ tumors in any HER2-negative subgroup. Notably, this difference translated to a significant prolongation of OS as well [19.7 vs. 11.8 mo., hazard ratio = 0.478 (95% CI: 0.303–0.756), P = 0.001] (Fig. 5). Conversely, T-DXd showed some preference in HR+/HER2-low tumors, with shorter TOT2 for SG-first [8.3 vs. 11.1 mo., hazard ratio = 1.43 (95% CI: 1.01–2.03)], although the P-value was borderline (P = 0.044) and there was no difference in OS (Fig. 5, Supplementary Figs. S3-4).
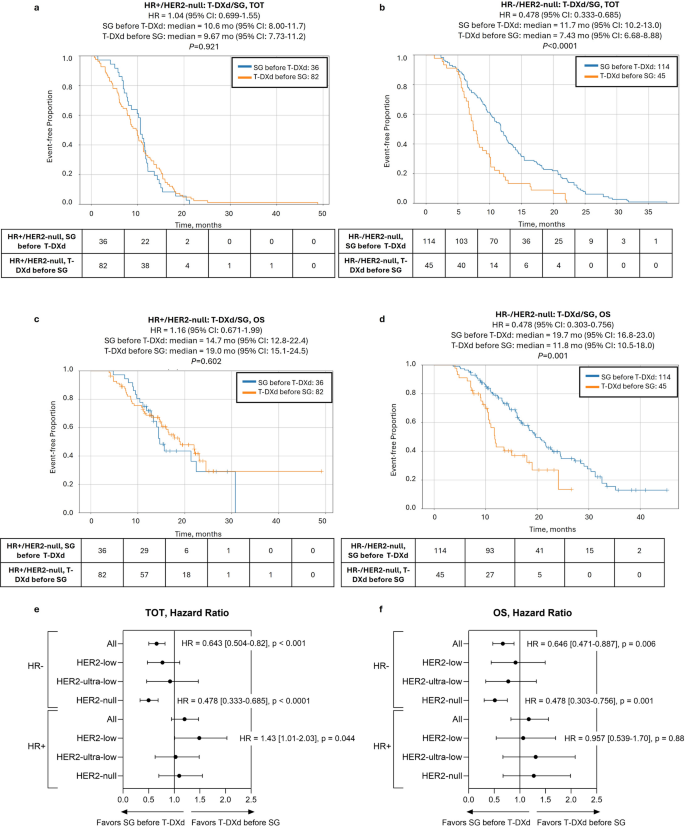
ADC sequencing-associated outcomes in patients with HER2-null tumors according to HR status. Kaplan-Meier curves show time-on-treatment from start of first ADC to end of second ADC (TOT2) (a, b) and overall survival (OS) (c, d) comparing SG before T-DXd (blue lines) vs. T-DXd before SG (orange lines) in HR+/HER2-null (a, c) and HR−/HER2-null groups (b, d)