OFAc improved bamboo shoot yield while maintaining overall quality
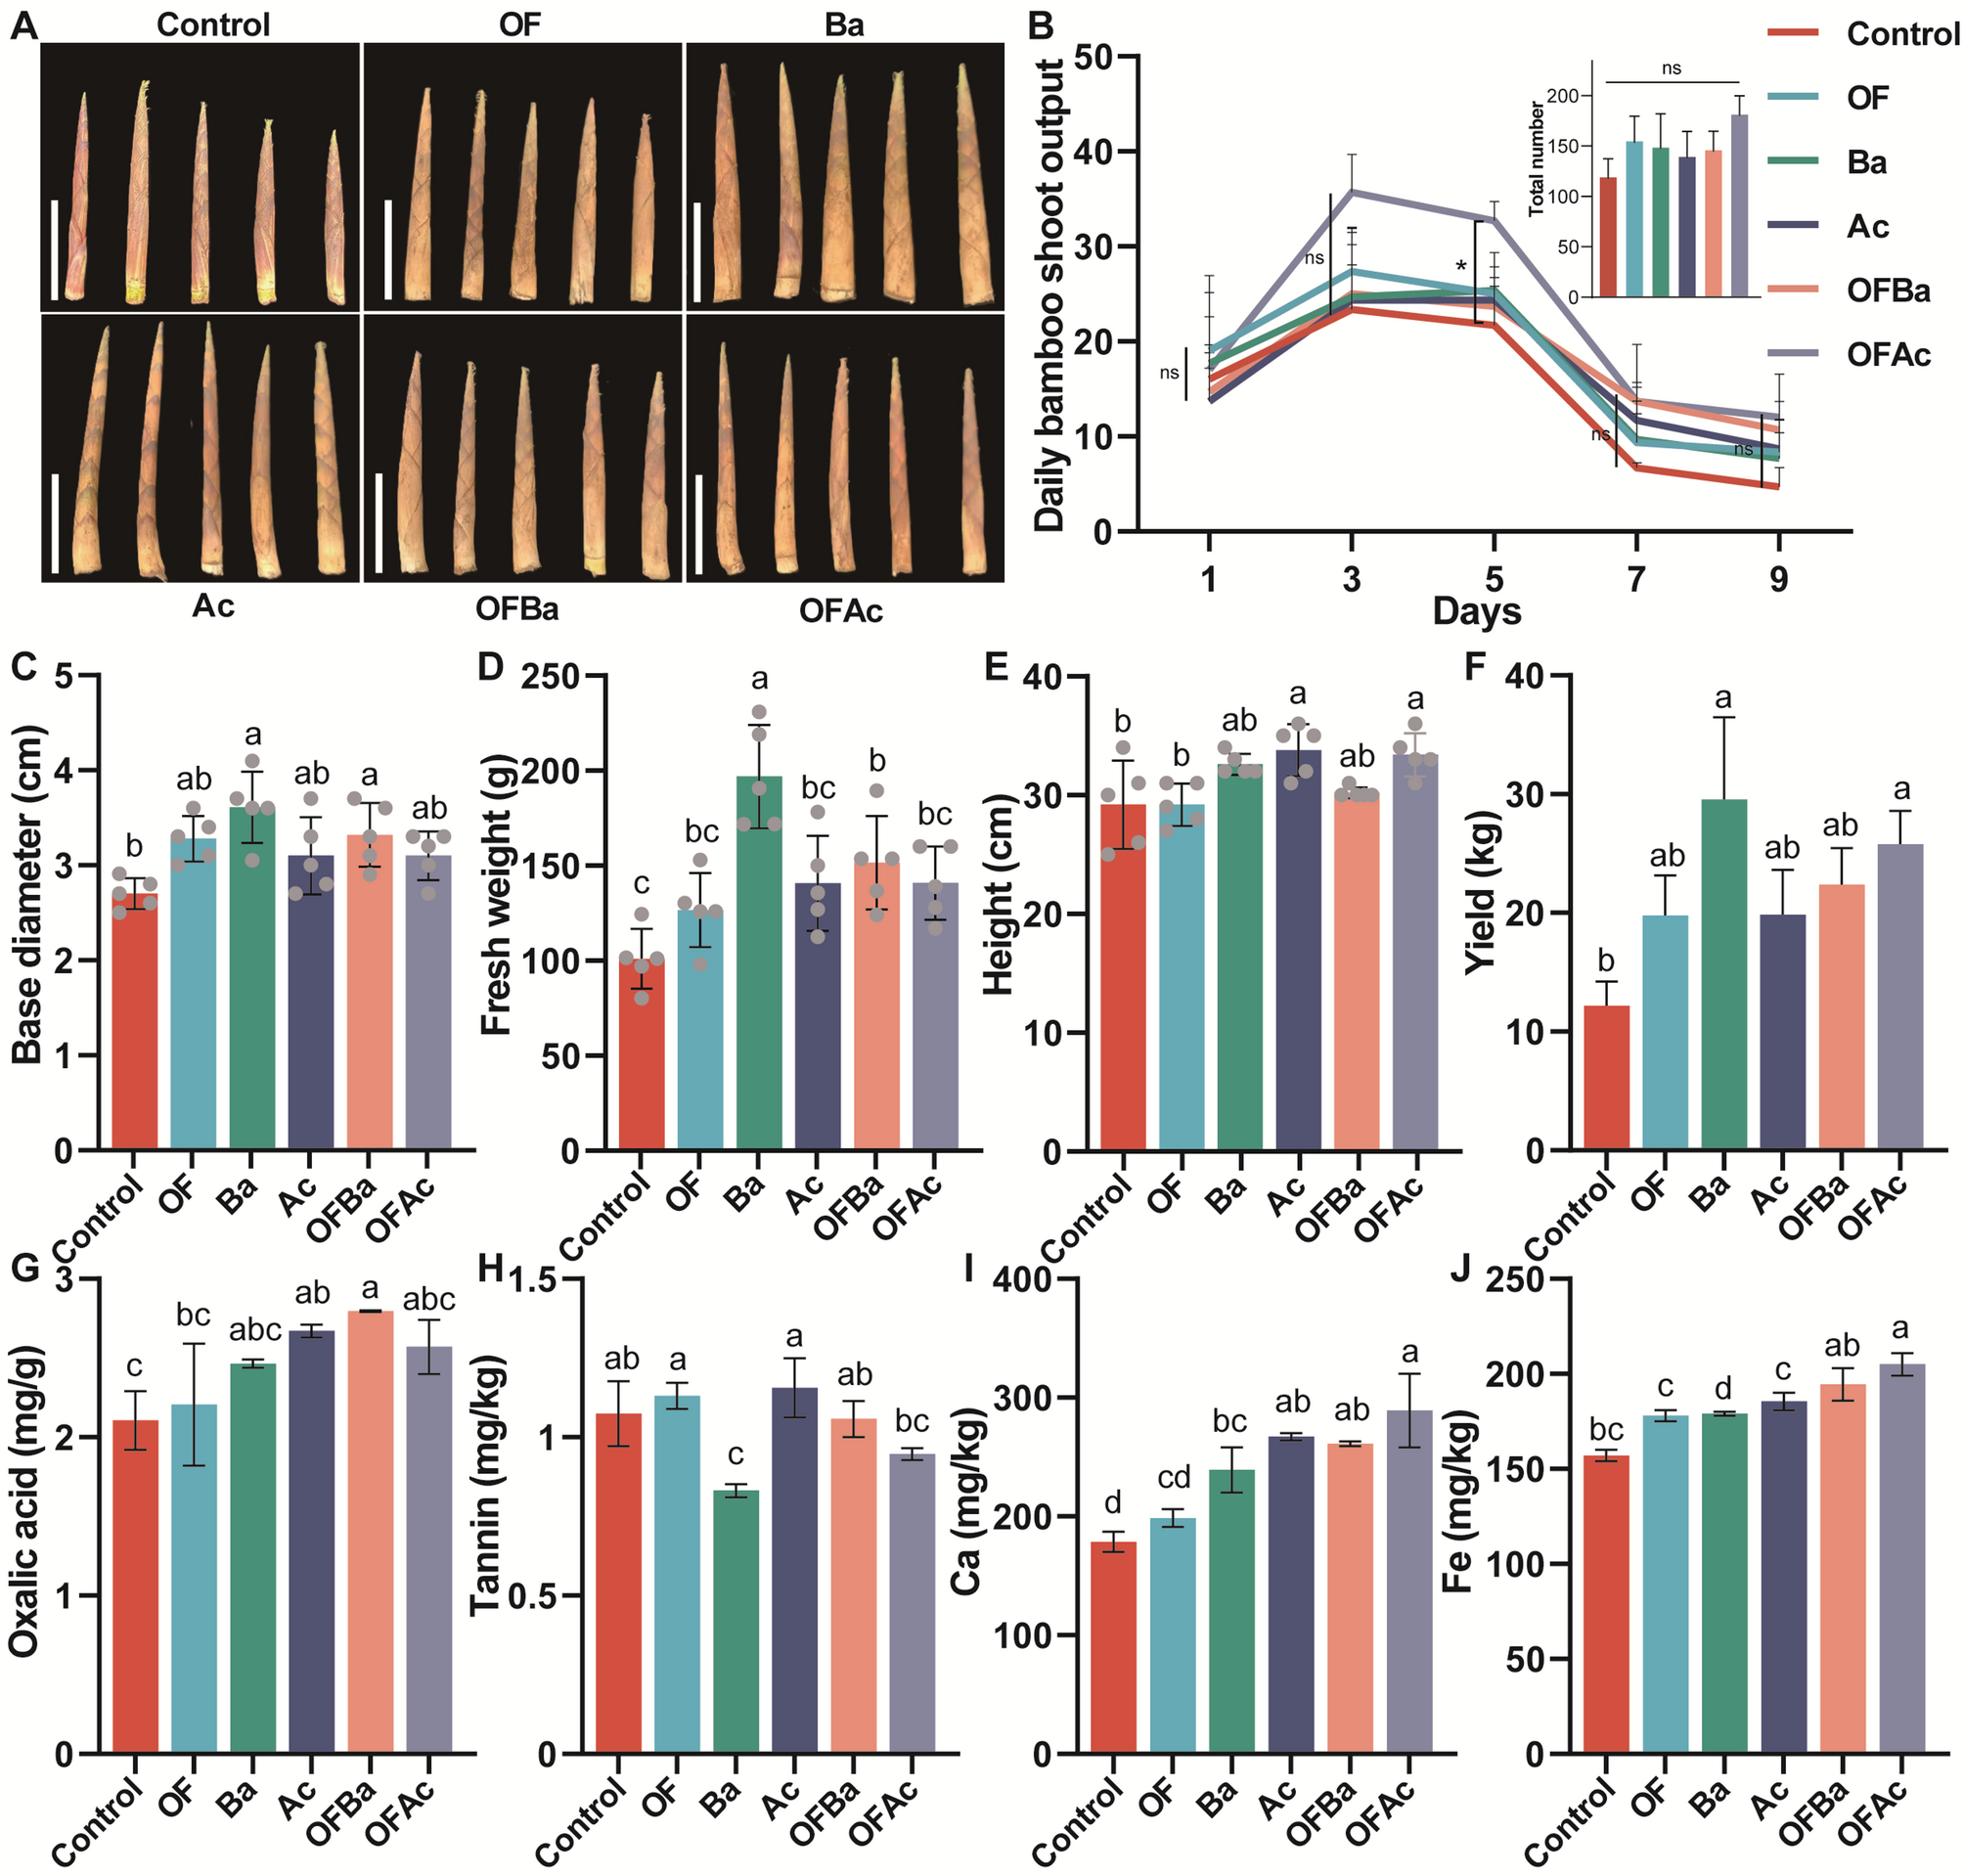
In the first year, C. opienensis bamboo shoot phenotype and daily bamboo shoot volume varied significantly across treatments. OFAc showed significantly higher bamboo shoot volume than the Control on day 5 (P < 0.05, ANOVA, Tukey HSD). However, total bamboo shoot volume did not differ significantly among treatments (Fig. 1A, B). Basal diameter differed significantly among treatments (P < 0.01, Tukey HSD, Fig. 1C), with the largest observed in Ba (3.61 ± 0.37 cm) and the smallest in Control (2.70 ± 0.16 cm). Fresh weight also varied significantly (P < 0.0001, Tukey HSD, Fig. 1D), with Ba producing the heaviest bamboo shoots (196.90 ± 27.13 g), a 95.03% increase over the Control (100.96 ± 15.74 g). Bamboo shoot height differed significantly (P < 0.01, Tukey HSD, Fig. 1E), with Ac producing the tallest shoots (33.80 ± 2.17 cm) and Control the shortest (29.20 ± 3.70 cm). Bamboo shoot yield was significantly higher in Ba (29.54 ± 6.96 kg) and OFAc (25.78 ± 2.81 kg) groups than in the Control group (P = 0.0035, Tukey HSD, Fig. 1F). To evaluate bamboo shoot quality, 38 key traits were analyzed (Fig. 1G–J, Table S3, Analysis of bamboo shoot quality after different fertilization treatments). Oxalic acid and tannin levels, which affect palatability, differed significantly among treatments (P = 0.0051 and P = 0.0004, respectively; Tukey HSD, Fig. 1G, H). Ba had the highest oxalic acid (2.47 ± 0.03 mg/g) and Control the lowest (2.11 ± 0.19 mg/g). Tannin content was highest in Ac (1.16 ± 0.09 mg/kg) and lowest in Ba (0.83 ± 0.02 mg/kg).
Effects of fertilization treatments on the growth, development, and quality traits of C. opienensis bamboo shoots in the field. A Representative bamboo shoot phenotypes; B line graph of daily bamboo shoot production; histograms showing (C) basal diameter, D fresh weight, E bamboo shoot height, and (F) yield. Histograms of (G) oxalic acid, H tannin, I calcium (Ca), and (J) iron (Fe) contents at peak bamboo shoot emergence. C (Control, no fertilizer), OF (organic fertilizer), Ba (Bacillus amyloliquefaciens), Ac (Azotobacter chroococcum), OFBa (organic fertilizer + B. amyloliquefaciens), and OFAc (organic fertilizer + A. chroococcum). One-way ANOVA was used for statistical analysis. Different letters (P < 0.05) and asterisks (*P < 0.05) indicate significance level with Tukey HSD. C–E, number of replicates per treatment for each measurement (n) = 5; B, F–J n = 3
Calcium and iron contents also varied significantly among treatments (P < 0.0001 for both, Tukey HSD, Fig. 1I, J). OFAc showed the highest Ca (289.00 ± 31.00 mg/g) and Fe (6.61 ± 0.44 mg/g) contents, whereas Control had the lowest (Ca: 178.50 ± 8.50 mg/g; Fe: 1.83 ± 0.02 mg/g). OF showed no significant difference from Control in 37 of 38 traits (Fig. 1G–J, Table S3). In Ba, Asp, Thr, Ser, and lignin levels decreased significantly, whereas Mg and Zn levels increased (29/38 traits unchanged). Ac showed significant reductions in multiple amino acids (Asp, Gly, Ala, Val, Ile, Leu, Tyr, Lys, His, Arg, and Pro), Cu, and fiber, whereas Mg and Na increased (19/38 traits unchanged). In OFBa, fiber and five amino acids (Asp, Ala, Lys, Arg, and Pro) decreased significantly, whereas K, Mg, and Zn increased (27/38 traits unchanged). OFAc showed reductions in fiber, Mg, and Cu, with no significant changes in 33 of 38 traits (Fig. 1G–J, Table S3).
In the second year, basal diameter (P < 0.0001, Tukey HSD, Fig. S1A), fresh weight (P < 0.0001, Tukey HSD, Fig. S1B), and bamboo shoot length (P < 0.0001, Tukey HSD, Fig. S1C) again differed significantly among treatments. All fertilization treatments resulted in significantly higher values than Control. On day 5, OFAc and OFBa yielded significantly more than Control (P < 0.01, Tukey HSD, Fig. S1D). The yield trend mirrored that of the first year, with significantly higher bamboo shoot yields in Ba (15.99 ± 4.16 kg) and OFAc (13.05 ± 1.07 kg) than that in Control (P = 0.012, Student’s t test, Fig. S1E). In summary, Ba significantly increased bamboo shoot yield while also raising oxalic acid levels and significantly reduced some quality traits. In contrast, OFAc enhanced yield without compromising palatability and largely preserved nutritional value, providing empirical evidence for further exploration of the “fertilizer type–nutritional traits–yield” mechanism.
Ac and Ba had the strongest impact on soil nutrients, followed by OFAc and OFBa
Soil physicochemical properties varied significantly among fertilization treatments (P < 0.05, Tukey HSD, Table 1). Ac and Ba exhibited the lowest soil pH values, whereas OFBa and OFAc showed intermediate values, and OF and CK displayed the highest pH levels. Total nitrogen (TN) levels were highest in Ac and Ba, whereas OFAc and OFBa showed intermediate values. OFAc had the highest total phosphorus (TP), exceeding Control, OF, and Ac. Control and OF exhibited significantly higher total potassium (TK) than other treatments. Total organic carbon (TOC) and total organic matter (TOM) peaked in Ba-treated soils, followed by Ac and OFAc. Ammonium nitrogen (AN) did not differ significantly, except for elevated levels in Ac. Available phosphorus (AP) was highest in OFAc, and available potassium (AK) peaked in Ba and OFAc. Total carbon (TC) followed the gradient: Ba > Ac > OFAc > OFBa > Control > OF. These results indicate that single applications of Ac or Ba significantly improved several soil properties (TN, TP, TOC, TOM), while combined treatments (OFAc, OFBa) produced intermediate effects between single amendments and the Control, providing a basis for subsequent analysis of nutrient regulation pathways.
Soil chemistry as a key factor in shaping the soil microbiota of C. opienensis under control and fertilization treatments
To assess the impact of fertilization on microbial diversity, we analyzed 41,046 bacterial and 8,242 fungal ASVs in C. opienensis soils. Rarefaction curves based on observed ASVs approached saturation, indicating sufficient sequencing depth (Fig. S2A, B). Bacterial and fungal α-diversity differed significantly among treatments based on multiple metrics, including the Chao1 index (P < 0.05, Tukey HSD, Fig. 2A, B). Phylogenetic diversity also varied significantly (P < 0.05, Tukey HSD). OFBa showed significantly higher bacterial and fungal α-diversity than Control, whereas OF, Ac, Ba, and OFAc showed no significant differences (Fig. S2C–H). At the phylum level, bacterial communities were dominated by Proteobacteria (31.35 ± 5.02%) and Acidobacteriota (27.90 ± 6.39%), whereas fungal communities were dominated by Ascomycota (40.13 ± 5.51%) and Basidiomycota (26.72 ± 5.14%) (Dataset S1, Mean relative abundance of soil ASVs by phylum across all samples, n = 30). Only Actinobacteriota and Chloroflexi averaged more than 9% abundance among other bacterial phyla, whereas Mortierellomycota and Rozellomycota were the only other fungal phyla exceeding 12% (Fig. S2I, J). PCoA revealed distinct clustering of bacterial (R = 0.7889) and fungal (R = 0.8802) communities by fertilization treatment (P = 0.001 for both; ANOSIM, Fig. 2C, D), indicating significant compositional shifts.
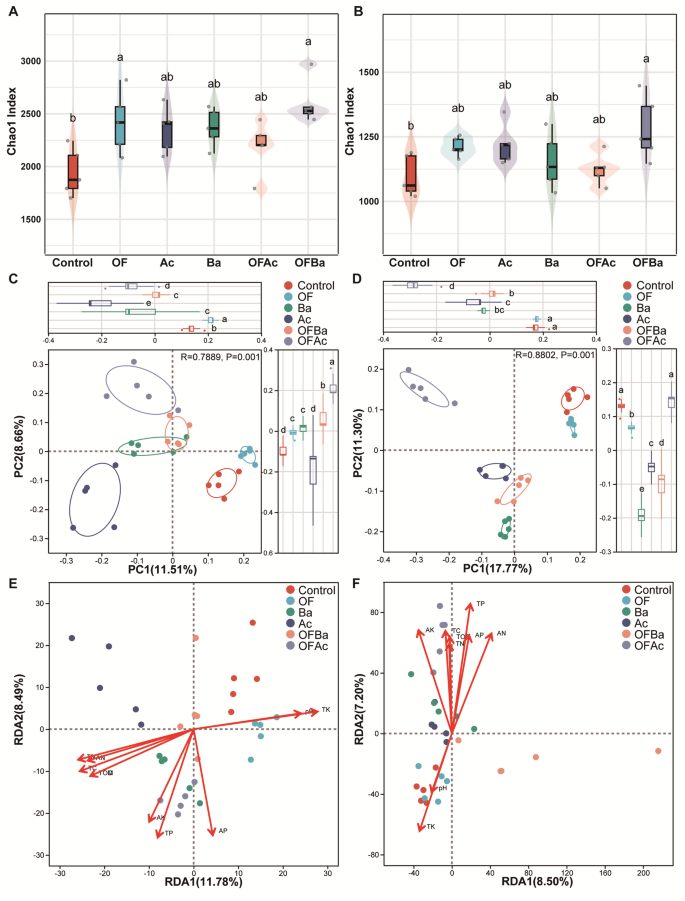
Effects of fertilization and Control treatments on soil microbial diversity and community composition in the rhizosphere of C. opienensis. Fused violin-box plots showing Chao1 indices of rhizosphere bacterial (A) and fungal (B) communities (P < 0.05, one-way ANOVA with Tukey’s test). Principal coordinates analysis (PCoA) of bacterial (C) and fungal (D) communities using the ANOSIM test. Different letters indicate significant differences at P < 0.05. ASV identification based on Bray–Curtis dissimilarity revealed clear clustering by treatment, and significance was evaluated using anosim in R. Effects of soil physicochemical properties on bacterial (E) and fungal (F) community variation were assessed using PERMANOVA with 999 Monte Carlo permutation test
Redundancy analysis (RDA) and PERMANOVA revealed soil chemical properties as key factors shaping bacterial and fungal communities. For bacteria, the following significantly influenced community composition: pH (variance explained [VE] = 7.96%, P = 0.001, Monte Carlo permutation test), TC (9.20%), TN (9.06%), TP (7.71%), TK (9.66%), TOC and TOM (both 8.36%), AN (8.33%), AP (7.64%), and AK (5.62%, P = 0.003) (Fig. 2E; Dataset S2, Results of the PERMANOVA for exploring the variance in the bacterial and fungal communities explained by the soil properties). For fungi, pH (9.60%, P = 0.001, Monte Carlo permutation test), TC (12.35%), TN (11.93%), TP (13.60%), TK (13.32%), TOC and TOM (12.01%), AN (11.96%), AP (11.64%), and AK (8.88%) were significant drivers (Fig. 2F; Dataset S2). Soil properties explained 32.44% of bacterial and 50.40% of fungal community variance (Dataset S2). These findings indicate that soil chemical characteristics play a major role in shaping the rhizosphere microbiota of C. opienensis under different fertilizations, laying a foundation for elucidating how fertilization influences microbial community structure.
Co-occurrence network of Ba was denser, whereas that of OFAc was sparser
Besides differences in microbial diversity and community composition, the co-occurrence networks of the Ba and OFAc microbiomes differed significantly from the Control (Fig. 3A–D; Fig. S3C–D). Other treatments showed no significant differences (Fig. S3A, B, D–F, H). In Ba-treated samples, bacterial network degree (P < 0.05, Mann–Whitney U test, Fig. 3I) and closeness centrality (P < 0.01, Mann–Whitney U test, Fig. 3J) were significantly higher than in Control. Fungal network degree showed no significant change (Fig. 3K), but closeness centrality was significantly lower (P < 0.001, Mann–Whitney U test, Fig. 3L) than that in Control. Similarly, in OFAc-treated soils, bacterial network degree (P < 0.05, Mann–Whitney U test) and closeness centrality (P < 0.01, Mann–Whitney U test) were also significantly higher than Control (Fig. 3I, J), whereas fungal degree remained unchanged and closeness centrality decreased significantly (P < 0.001, Mann–Whitney U test, Fig. 3L). Separate analysis of bacterial and fungal co-occurrence networks in Ba and OFAc communities showed that the bacterial network in Ba was more aggregated and denser than in Control (Fig. S3K), whereas its fungal network was more isolated and sparser (Fig. 3O). In contrast, both bacterial and fungal networks in OFAc were more isolated and less dense than those in Control (Fig. 3E–H). Both Ba and OFAc significantly increased C. opienensis bamboo shoot yield. However, the contrasting network structures and topological features of OFAc compared to Ba and Control warranted further investigation, providing key insights for further exploring how different fertilizer combinations influence microbial interaction patterns and their effects on yield.
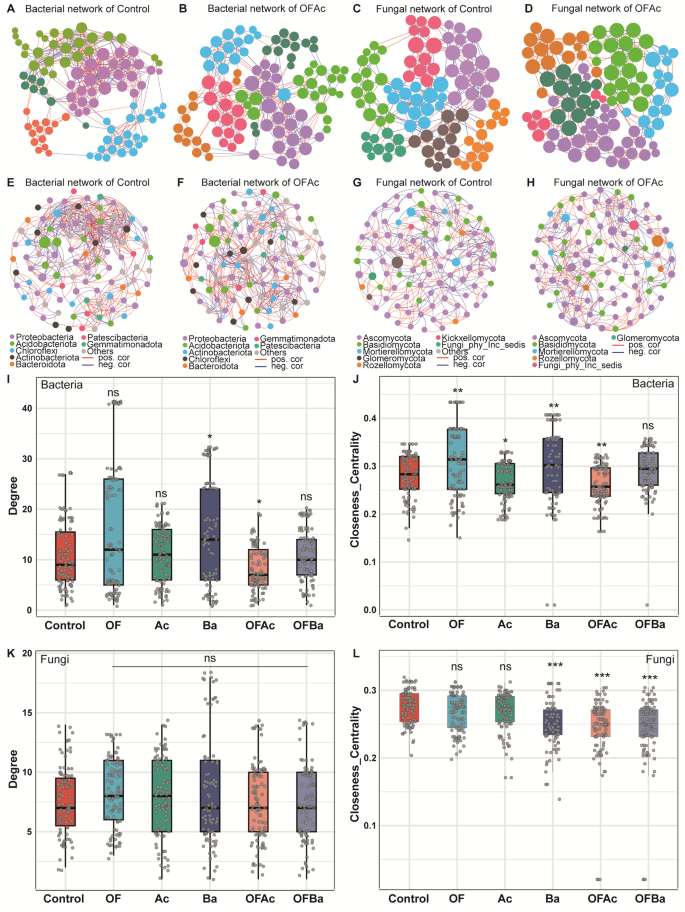
Bacterial and fungal co-occurrence networks in C. opienensis soil under control and fertilization treatments. Bacterial co-occurrence networks are shown for Control (A, E) and OFAc (B, F), and fungal networks for Control (C, G) and OFAc (D, H). Nodes in panels A–D are colored by microbial modules, whereas nodes in panels E–H are colored by microbial taxonomy at the phylum level. Correlations were inferred from ASV abundance matrices using Spearman’s method. Only robust and significant correlations (correlation coefficient < − 0.7 or > 0.7, P < 0.05) were retained to construct the co-occurrence networks. Each node represents an ASV of bacteria or fungi, and edges indicate positive correlations (red lines) or negative correlations (blue lines). Degree (I) and closeness centrality (J) of bacterial networks, and degree (K) and closeness centrality (L) of fungal networks in Control and OFAc soils were compared (Mann–Whitney U test). Asterisks denote significance levels (*P < 0.05, **P < 0.01, ns no significance)
A. chroococcum addition (Ac and OFAc treatments) caused the most significant shifts in community composition
To evaluate the effect of A. chroococcum addition on specific ASVs and identify those driving treatment-level differences, we used DESeq2 to compare microbial communities across treatments. Differentially enriched ASVs were identified in OF, Ac, Ba, OFAc, and OFBa treatments relative to Control (Fig. 4A, B). The addition of A. chroococcum (in Ac and OFAc) caused the most significant shifts in community composition, influencing 44 and 66 bacterial ASVs (Fig. 4E and F), and 75 and 156 fungal ASVs, respectively (Fig. 4E and F). Additionally, Ba notably altered the fungal community, affecting 126 ASVs (Fig. 4F), whereas OF and OFBa had minimal effects. Although some ASVs were commonly affected across treatments (Fig. 4E and F), many were uniquely influenced by Ac, OFAc, or Ba. Specifically, 22 bacterial and 40 fungal ASVs were uniquely affected by both Ac and OFAc, highlighting the strong influence of A. chroococcum. Meanwhile, 64 fungal ASVs were uniquely affected by Ba treatment (Fig. 4F). In contrast, OF and OFBa treatments affected relatively few ASVs—2 and 4 bacterial ASVs and 35 and 13 fungal ASVs, respectively (Fig. 4E, F; Dataset S3, DESeq2 results for responsive ASVs, their taxonomy, and the treatments they responded to). Bacterial ASVs that increased in abundance after A. chroococcum addition (Ac and OFAc) were primarily from the Acidobacteria, including Acidobacteriales, Vicinamibacterales, and Solibacteraceae (Fig. 4C). Fungal ASVs that increased were mainly from Ascomycota and Basidiomycota, such as Sordariomycetes and Auricularia (Fig. 4C). In contrast, ASVs that decreased after A. chroococcum addition were taxonomically diverse, spanning over 21 bacterial and fungal phyla, primarily Ascomycota, Rozellomycota, Basidiomycota, Acidobacteriota, Proteobacteria, Chloroflexi, and Actinobacteriota (Fig. 4C, D; Dataset S3). Ba uniquely influenced fungal ASVs, mainly increasing members of Ascomycota, including Sordariomycetes, Helotiales, Sordariales, and Talaromyces (Fig. S3B). In OF, only 10 bacterial ASVs responded, with 4 increasing—three of which were Actinomycetes—and 6 decreasing, spanning five phyla. Among 38 fungal ASVs that increased, most belonged to Ascomycota (Fig. S3C, D). In OFBa, 10 bacterial ASVs responded positively compared to those in Control, including Subgroup_2 (log₂ fold change = 22.65). Most ASVs that decreased in abundance belonged to Acidobacteria (Fig. S3E). The addition of A. chroococcum (Ac and OFAc) significantly reshapes bacterial and fungal community composition, highlighting the pivotal role of specific functional microbes in fertilizer-driven community shifts and laying a foundation for subsequent metabolite–microbe interaction analyses.
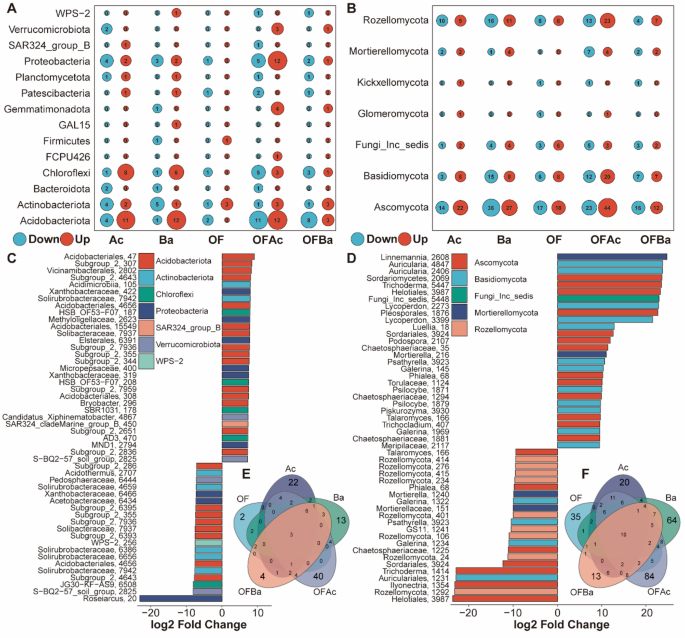
Differential effects of fertilization treatments on the microbial community structure in C. opienensis soil were assessed relative to the Control using DESeq2 (Adjust P < 0.01). A Number of upregulated (Up) and downregulated (Down) bacterial ASVs during microbial and/or organic fertilizer treatments (Ac, Ba, OF, OFAc, and OFBa) compared to those in Control, grouped by phylum. Bubble size indicates the number of responsive ASVs. B Top 50 bacterial ASVs showing increased (log2 fold change > 0) or decreased (log2 fold change < 0) abundance in response to treatments containing A. chroococcum (Ac and OFAc). ASVs are presented at the highest available taxonomic resolution and colored by class within each phylum. C Numbers of unique and shared ASVs identified during each treatment compared to those in the Control group
A. chroococcum addition (Ac and OFAc) significantly increased the richness of soil metabolites in C. opienensis
To investigate how A. chroococcum application alters the soil microbial community, liquid chromatography–mass spectrometry (LC-MS)-based metabolomics was used to profile metabolites in the root soil of C. opienensis under five fertilization treatments and Control. Differential metabolites were identified based on VIP scores from OPLS-DA, fold change, and P-values from univariate analysis. A total of 133 metabolites were detected (Dataset S4). Root soil metabolite composition varied across treatments, with Ac, OFAc, and OFBa showing the most pronounced differences compared to Control (Fig. S5A, B). Twenty-eight metabolites were significantly more abundant in Control than in all fertilization treatments (P < 0.05; Fig. 5A–D, Fig. S5C). Most were fatty acyls (n = 15), including fatty acids and conjugates (n = 11). The rest included organooxygen compounds (n = 7), lactones (n = 3), pteridines and derivatives (n = 2), and prenol lipids (n = 2), and others (Fig. 5A-D, Fig. S5C).
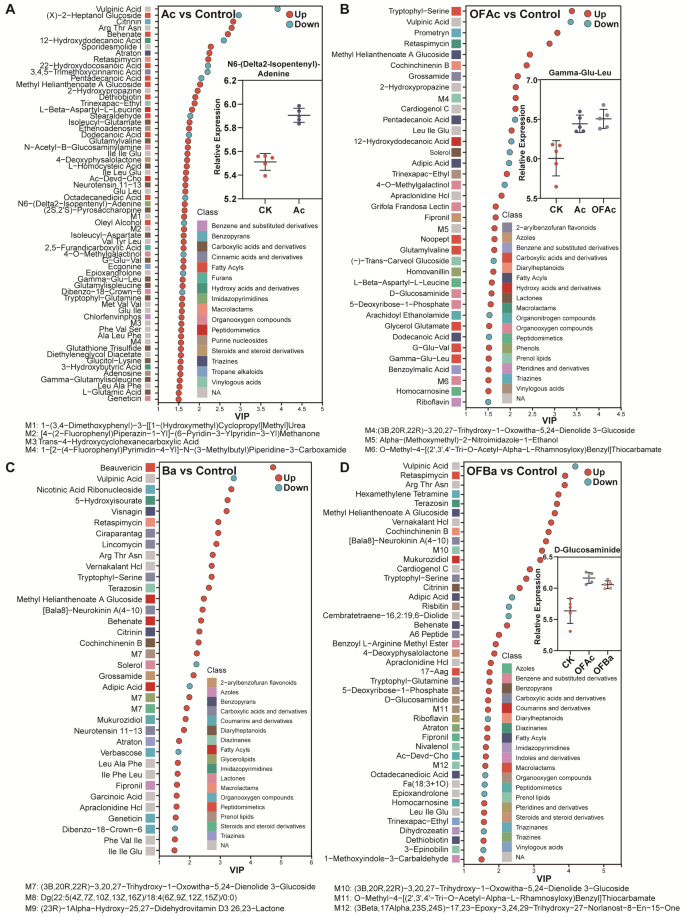
Differential metabolite profiles of C. opienensis soil under five fertilization treatments compared to those under Control. Significantly enriched metabolites in Ac (A), OFAc (B), Ba (C), and OFBa (D) treatments compared to that in the Control group. Red circles represent metabolites significantly upregulated, whereas blue circles indicate downregulated metabolites. Scatter plots display the abundance of representative enriched metabolites in each treatment; horizontal lines indicate the mean, and dots represent individual samples. VIP, variable importance; OPLS-DA, orthogonal partial least squares-discriminant analysis. n = 5, evaluated using OPLS-DA (VIP > 1.5, P < 0.05; see Dataset S4)
In contrast, A. chroococcum addition (Ac and OFAc) significantly increased the abundance of 70 soil metabolites, including 28 carboxylic acids and derivatives, notably amino acids, peptides, and analogues such as Gamma-Glu-Leu (Fig. 5A, B). Six organoheterocyclic compounds also increased, including benzopyrans, triazines, and imidazopyrimidines like N6-(Delta2-Isopentenyl)-adenine. A total of 31 and 5 metabolites were significantly increased and decreased in Ba treatment, respectively, compared to Control (Fig. 5C; Dataset S4). OFBa significantly increased 33 metabolites, including organic acids and derivatives (n = 7), lipids and lipid-like molecules (n = 7), organoheterocyclic compounds (n = 6), and others such as D-glucosaminide (Fig. 5C, D; Dataset S4). Changes in metabolite abundance show that Ac and OFAc treatments markedly enrich the rhizosphere metabolite pool, especially amino acids and organic acids, suggesting that metabolite enrichment may be an important mediator of microbially driven yield improvement.
Relationship of metabolites and microbial ASV with ac and OFAc
To assess metabolite–microbe interactions under A. chroococcum addition, Spearman rank correlation and hierarchical clustering were used to associate differentially abundant ASVs (identified by DESeq2) with metabolites from OPLS-DA. Clustering revealed two major groups. Cluster 1 comprised 45 microbial ASVs and 10 metabolites enriched in Control soils. ASVs mainly belonged to Proteobacteria, Chloroflexi, Rozellomycota, and Mortierellomycota, whereas metabolites included hydroxy acids and derivatives, fatty acyls, organooxygen compounds, and organonitrogen compounds such as 12-hydroxydodecanoic acid, 22-hydroxydocosanoic acid, 4-O-methylgalactinol, and arachidoyl ethanolamide (Fig. 6). Cluster 2 included 30 microbial ASVs and 65 root soil metabolites enriched in Ac and OFAc soils. Unlike Cluster 1, ASVs primarily belong to Acidobacteriota, Proteobacteria, Gemmatimonadota, Ascomycota, and Rozellomycota. The metabolites predominantly consisted of carboxylic acids and derivatives (17/65), organooxygen compounds (7/65), fatty acyls (5/65), and amino acids, peptides and analogues, carbohydrates, and carbohydrate conjugates (Fig. 6). Metabolite–microbe clustering analysis reveals that Ac and OFAc treatments induce the co-enrichment of specific metabolites and microbial taxa, providing empirical evidence for understanding fertilizer-regulated microbe–metabolite cooperation in the rhizosphere.
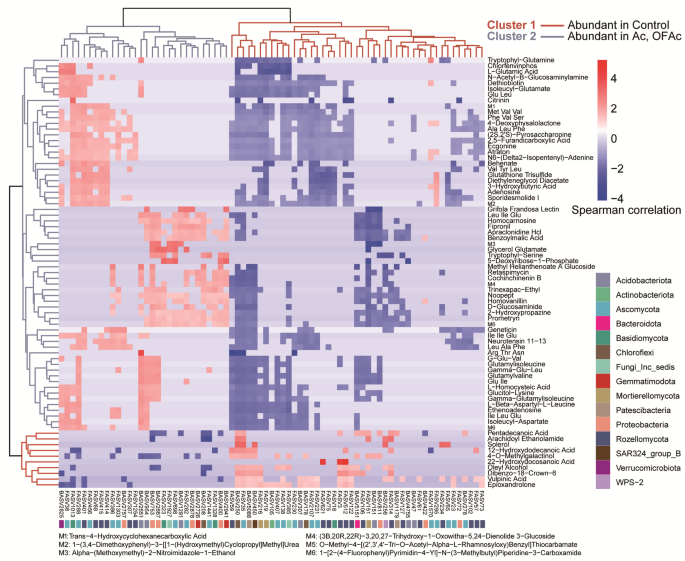
Heatmap of co-varying microbial taxa and metabolites in C. opienensis soil under five fertilization treatments and Control conditions. Differentially abundant ASVs (identified using DESeq2; (n = 75)), showing more than three significant positive or negative correlations with metabolites (Spearman rank correlation, r > 0.7, P < 0.05). A total of 75 metabolites were identified as key associations between metabolites and ASVs. These metabolites had more than two significant positive or negative correlations with ASVs (Spearman rank correlation, |ρ| >0.7, P < 0.05). Hierarchical clustering revealed two metabolites–ASV correlation clusters. Cluster #1 (red line) represents metabolites and ASVs more abundant in Control rhizosphere soil, whereas Cluster #2 (brown line) includes metabolites and ASVs enriched in soils amended with Azotobacter chroococcum (Ac and OFAc treatments). Red indicates positive correlations, white indicates no correlation, and blue indicates negative correlations between metabolites and ASVs
Metabolite–microbe networks in C. opienensis soil communities
To identify co-occurring changes between metabolites and microbial ASVs, we constructed a correlation network using their relative abundances across all treatments. The root soil network (Fig. 7A) included 148 ASVs and 91 metabolites connected via 692 links—352 positive and 340 negative—with an average of six connections per node (Dataset S5, List of network connectors, module and network hubs, network topological features, and correlation strength between network nodes). We identified 11 connectivity hubs, 5 modular centers, and 1 central network cluster as potential keystone metabolites or microbes (Fig. 7B; Dataset S5). One fungal hub, Rozellomycota (ASV369), was predominantly negatively correlated with metabolites in Modules 3 and 4, showing negative links with 34 of 36 metabolites, but positive correlations with 4-O-methylgalactinol and Dibenzo-18-Crown-6. Module 2, the largest, was dominated by positive correlations between Rozellomycota ASVs and four key metabolites: 4-deoxyphysalolactone, Fa(18:3 + 1O), 3-hydroxybutyric acid, and diethylene glycol diacetate (27 of 52 links). Negative associations primarily involved bacterial and fungal ASVs from diverse phyla. Module 1 featured negative correlations between the module center Mortierellomycota (ASV151) and 19 metabolites, alongside positive correlations with 18 metabolites linked to ASVs from Proteobacteria, Acidobacteriota, Ascomycota, and Rozellomycota (99 of 118 links). Module 5 lacked a central hub and was dominated by metabolite nodes, including 1-methoxyindole-3-carbaldehyde and fungal ASVs from various phyla. The 11 network connectors included 7 metabolites and 4 microbial ASVs (Fig. 7C). These ASVs were linked to 41 metabolites via 45 positive and 16 negative associations. Bradyrhizobium (ASV2748) and Galerina (ASV1232) were positively correlated with 36 metabolites, primarily amino acids, peptides, and analogues. These connected with the three module centers and seven connectors in Module 2. In contrast, 14 of 16 negative links were formed by fungi (ASV385) and Rozellomycota (ASV234) with 13 metabolites. Approximately half (69 of 143) of ASVs in the network were identified as DESeq2-responsive; of these, 54 responded to Ac or OFAc, and 38 to Ba or OFBa (Dataset S3).
Metabolite–microbe network analysis reveals complex positive and negative correlation modules and key nodes, providing a systematic perspective for elucidating the mechanisms of microbe–metabolite interactions under fertilization.

Co-occurrence networks depicting the relation between soil metabolites and microbial ASVs in C. opienensis soil under five fertilization treatments and Control. A A total of 1,048 bacterial and fungal ASVs and 130 rhizosphere soil metabolites were first analyzed using Spearman coefficients. Network showing associations among 148 bacterial and fungal ASVs and 91 rhizosphere soil metabolites (|ρ| >0.70, P < 0.05). Circles indicate bacterial ASVs, triangles fungal ASVs, and squares metabolites. Edges represent Spearman correlations of relative abundances, with red for positive and blue for negative correlations. The network is organized into five major modules. Hub nodes within the network and modules display dense connections, while eleven central nodes serve as connectors linking different modules. B Subnetworks of module hubs formed by metabolites or ASVs and their adjacent nodes. C Subnetworks of connector metabolites or microbes and their adjacent nodes. Microbial ASVs are colored by phylum
Soil nutrient changes induced by Ac and OFAc treatments drive increased C. opienensis shoot yields
To evaluate the cascading effects of A. chroococcum addition on soil chemistry, microbial community structure, root metabolites, and bamboo shoot yield, a PLS-PM was constructed (Fig. 8). The model posits that fertilization directly alters soil chemical properties (e.g., pH, organic matter, AN), which subsequently influence microbial community structure and diversity. These microbial changes promote the enrichment of key taxa and modulate metabolite abundance, ultimately enhancing C. opienensis bamboo shoot yield. The final model demonstrated good overall fit (GoF = 0.77) and convergent validity (AVE > 0.50 for all latent variables) (Fig. 8; Dataset S6, List of parameters for the PLS-PM). A. chroococcum addition was identified as the strongest driver of soil nutrient changes (path coefficient = 0.9916, P < 0.001), and soil nutrients emerged as the primary drivers of yield (path coefficient = 0.8430, P < 0.001). Soil nutrients also positively influenced microbial community structure (0.6668, P < 0.001), indirectly contributing to yield improvement through effects on key microbial taxa and metabolite profiles. Overall, the model suggests that A. chroococcum addition enhances soil nutrient status, which in turn reshapes microbial community composition, regulates functional microbes and metabolite abundance, and ultimately promotes C. opienensis bamboo shoot yield, thereby laying the foundation for proposing a “soil nutrients–microbes–metabolites–yield” regulatory model.
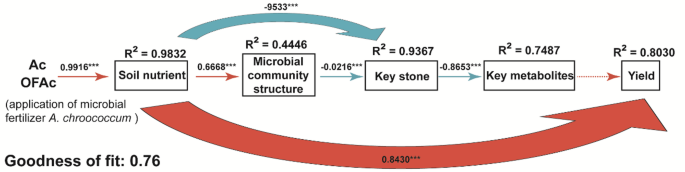
Partial least squares-path model depicting causal relationships among fertilization, soil properties, microbial community structure, keystone taxa, key metabolites, and yield. Solid and dashed arrows represent significant (P < 0.05) and non-significant (P > 0.05) effects, respectively. Blue arrows indicate positive influences, while red arrows indicate negative ones. Standardized path coefficients and their corresponding p-values are shown alongside the arrows; non-significant paths are not displayed. The values of R² denote the proportion of variance explained for each dependent variable