Design
A cross-sectional design that follows the STROBE (i.e., Strengthening the Reporting of Observational Studies in Epidemiology) checklist was adopted. Figure 2 is a flowchart of the study design.
Study setting, participants, and recruitment
The study setting was Accra, Ghana, and the participants were community-dwelling middle-aged and older adults aged 50 years or older. Multistage sampling was utilised to select the participants. We first classified the neighbourhoods of Accra into four cardinal blocks (i.e., north, south, west, and east) and randomly selected a representative number of neighbourhoods from each block. The participants were selected randomly from all selected neighbourhoods based on three selection criteria: (1) being aged 50 years or older; (2) being a permanent resident of Accra, and (3) availability and willingness to participate in the study. We calculated the minimum sample size necessary with the Daniel Soper’s sample size calculator for structural equation modelling [37, 38] based on standard statistics (i.e., moderate effect size = 0.3; power = 0.8, and α = 0.05). The sample size reached was 823, but we increased this number by 10% to allow for attrition. Thus, the minimum sample size of this study was 905.
Variables, operationalization, and measures
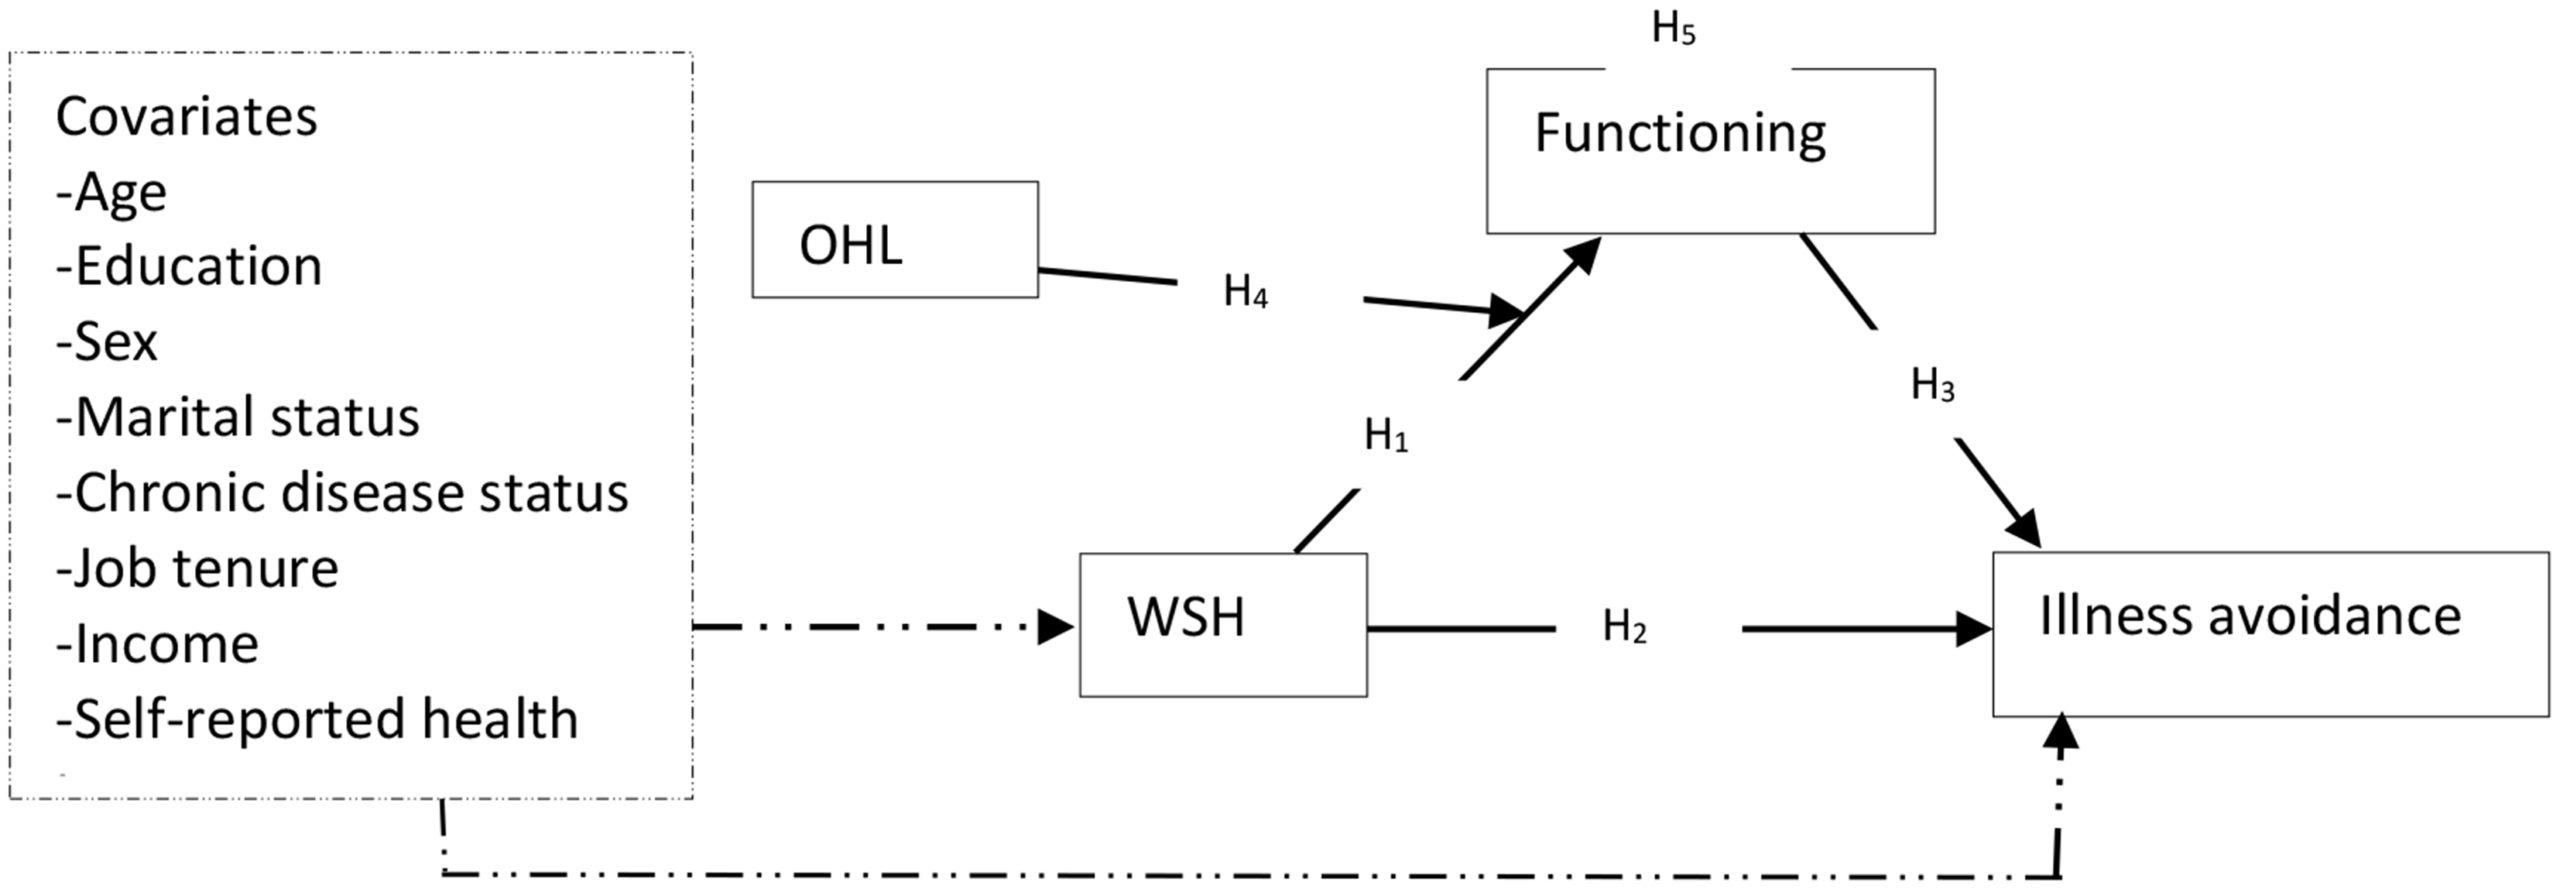
WSH, the dependent variable, was measured with a 5-item scale with five descriptive anchors (i.e., 1 – strongly disagree, 2 – disagree, 3 – somewhat agree, 4 – agree, and 5 – strongly agree). This measure was adopted in whole from a previous study [9] and was developed based on our earlier definition of WSH. Some of its items are “Overall, my workplace supports me in living a healthier life” and “Most employees here have healthy habits”. It yielded satisfactory internal consistency in the form of Cronbach’s α ≥ 0.7 (overall α = 0.76; men’s α = 0.74; women’s α = 0.77), which is within the recommended cut-off point [9, 39]. Scores on this tool obtained by summing up its items range from 5 to 25, with larger scores indicating higher WSH.
Illness avoidance and functioning were measured with sub-scales from a previously validated successful ageing measure [11], associated with five descriptive anchors (i.e., 1 – strongly disagree, 2 – disagree, 3 – somewhat agree, 4 – agree, and 5 – strongly agree), and comprised 4 and 9 items respectively. Illness avoidance, the dependent variable, is a measure of overall health and the avoidance of medication as well as therapy. Some of its items are “I did not use medication or therapy” and “I was healthy enough to move around freely”. Functioning, the mediating variable, is a measure of cognitive functioning and how well one could perform physical and social tasks independently. Some of its items are “I had enough energy for daily life” and “When I tried to recall familiar names or words, it was not difficult for me to do so”. Illness avoidance (overall α = 0.72; men’s α = 0.76; women’s α = 0.81) and functioning [overall α = 0.84; men’s α = 0.87; women’s α = 0.80] produced Cronbach’s α ≥ 0.7. The ranges of scores on illness avoidance and functioning were 4–20 and 9–45 respectively, with larger scores indicating higher illness avoidance and functioning.
OHL, the moderating variable, was measured with a 12-item standard measure adopted in whole from a previous study [36]. The scale was associated with four descriptive anchors [i.e., 1 – strongly disagree, 2 – disagree, 3 – agree, and 4 – strongly agree] and produced satisfactory Cronbach’s α ≥ 0.7 (overall = 0.75; men’s = 0.82; women’s = 0.74). Its scores range from 12 to 48, with higher scores indicating higher OHL. Appendix 1 shows items used to measure WSH, illness avoidance, functioning, and OHL.
Eight potential covariates were measured following previous research [7, 34, 40, 41]. Chronic disease status was measured with a single question asking participants to report the number of chronic conditions they had, and the responses were coded into two groups (none – 1, and one of more – 2). Self-reported health was measured with a single question asking the participants to report whether their health was poor or good (poor – 1, and good – 2). Like chronic disease status and self-reported health, sex (men – 1, and women – 2), and marital status (not married – 1, and married – 2) were measured as categorical variables and coded into dummy-type variables. Job tenure, age, education, and income were measured as discrete variables. Job tenure was how long (in years) participants had worked in their current organization whereas age was a measure of chronological age. Education was measured as years of schooling whereas income was measured as the individual’s gross monthly earnings in Ghana cedis.
Instrumentation
Data were collected with a self-reported questionnaire comprising three sections. The first section presented a statement of the study’s aim, importance, ethical considerations, and general survey completion instructions. The second section presented measures on WSH, OHL, functioning, and illness avoidance, whereas the final part captured questions on the covariates and personal factors. We avoided or minimised Common Methods Bias (CMB) at the survey design stage by following recommendations in the literature [34, 42, 43] to structure sections and questions in the questionnaire. In this vein, specific instructions for completing each scale and section in the right context were provided. The general instructions provided guided the participants to avoid errors in their completion of the survey. Standard scales with concise and unambiguous items or questions were used. In the second stage, Harman’s one-factor approach, a statistical procedure, was followed to investigate the absence of CMB in the data.
This technique required the use of an exploratory and confirmatory factor analyses to assess the factor structures of the scales used. With this technique, the absence of CMB in the data is confirmed if two or more factors are produced on each scale, or variances extracted are less than 40% [42, 43]. In the exploratory factor analysis, each scale yielded at least two factors, and each factor accounted for less than 40% of the total variance. WSH produced two factors (factor loadings of items ≥ 0.5; variance explained by factor 1 = 31.12, and variance explained by factor 2 = 23.09). OHL (number of factors extracted = 4), functioning (number of factors extracted = 3), and illness avoidance (number of factors extracted = 2) yielded similar results. Confirmatory factor analysis produced consistent results, signifying the absence of CMB in the data.
Ethics and data collection
The study received ethical review and clearance from the ethics review board of the Africa Centre for Epidemiology (no. 005-10-2022-ACE) after the board reviewed the study protocol. All the participants provided written informed consent before participating in the study. We gathered data with three specially trained research assistants who administered questionnaires at designated centres. Some participants could not complete the questionnaire at the centres, so they were allowed to take the questionnaires home and return them over two weeks through a private courier hired by the researchers. Data were gathered over four weeks between July and August 2023. Out of 1501 questionnaires administered, 1015 were analysed, 465 were not returned by the participants, and 21 were discarded because at least 50% of their questions were not answered.
Statistical analysis
We utilised SPSS 28 (IBM Inc., New York, USA) to summarise the data and perform exploratory data analysis, including the first sensitivity analyses for the ultimate covariates. Amos 28 was used to test the moderated mediation model. Data were summarised with descriptive statistics [i.e., frequency, and mean], enabling us to identify missing data. Marital status was the only variable with 1% missing data, but we performed the exploratory data analysis with the missing values as they were less than 10% (of the data on marital status) and were randomly distributed [34, 41]. We found no outliers in the data after using box plots to visualize the distribution of the data on all continuous variables. Previous studies [7, 34, 40] were then followed to perform the first sensitivity analysis for the ultimate covariates. We utilised this analysis to ensure that only measured covariates likely to confound the primary relationships were incorporated into the moderated mediation model. After following some standard steps (see Appendix 2), none of the measured covariates qualified as the ultimate covariate.
The statical moderated mediation model fitted. Note: WSH – workplace support for health; OHL – occupational health literacy; e1 and e2 are errors
Figure 3 shows the statistical moderated mediation model tested with Hayes’ Process Model [44, 45] through structural equation modelling. To create the interaction term (i.e., WSHxOHL), we centred the moderator (i.e., OHL) and multiplied it with WSH in harmony with Haye’s Process Model. The moderated mediation was fitted on the whole sample after computing the basic path coefficients (i.e., a, b, and c; see Fig. 3), Simple Slope (SS), Conditional Indirect Effect (CIE), and Index of Moderated Mediation (i.e., InModMed) using the “user-defined estimands” function in Amos 28. Appendix 3 shows the equations used to estimate the SS and CIE on the whole sample and sub-samples (i.e., men and women). The constant in each equation is the standard deviation of the moderator variable. The InModMed, SS, and CIE were estimated at different levels [i.e., low and high] of the moderator variable. The above parameters and their significance were based on 2000 biased corrected sampling iterations (bootstraps) with a 95% confidence interval.
In the second sensitivity analysis, the statistical model (see Fig. 3) was fitted for men and women, and the relevant parameters (i.e., direct effects, indirect effects, SS, CIE, and InModMed) were estimated for these samples. A minimum of p < 0.05 was used to detect the statistical significance of the effects. The moderation effect was visualized with figures depicting the effect of WSH on functioning at two levels (i.e., low, and high) of OHL. Multivariate normal distribution of the data was not achieved in fitting the models possibly owing to the relatively large sample used [46], but this violation of the assumption was corrected with our 2000 biased-corrected bootstraps [46].