Plant materials and treatments
Broccoli (Brassica oleracea L. var. Italica) was collected from Shulan Agricultueal Farm in Hangzhou, Zhejiang Province. ‘Naihanyouxiu’ broccoli cultivar was used as plant material in the study, which was provided from Sakata Seed Corporation. And the broccoli was harvested at commercial maturity, characterized by tightly closed florets and a deep green color. For this experiment, broccoli of the same size, consistent color, and no mechanical damage were selected.
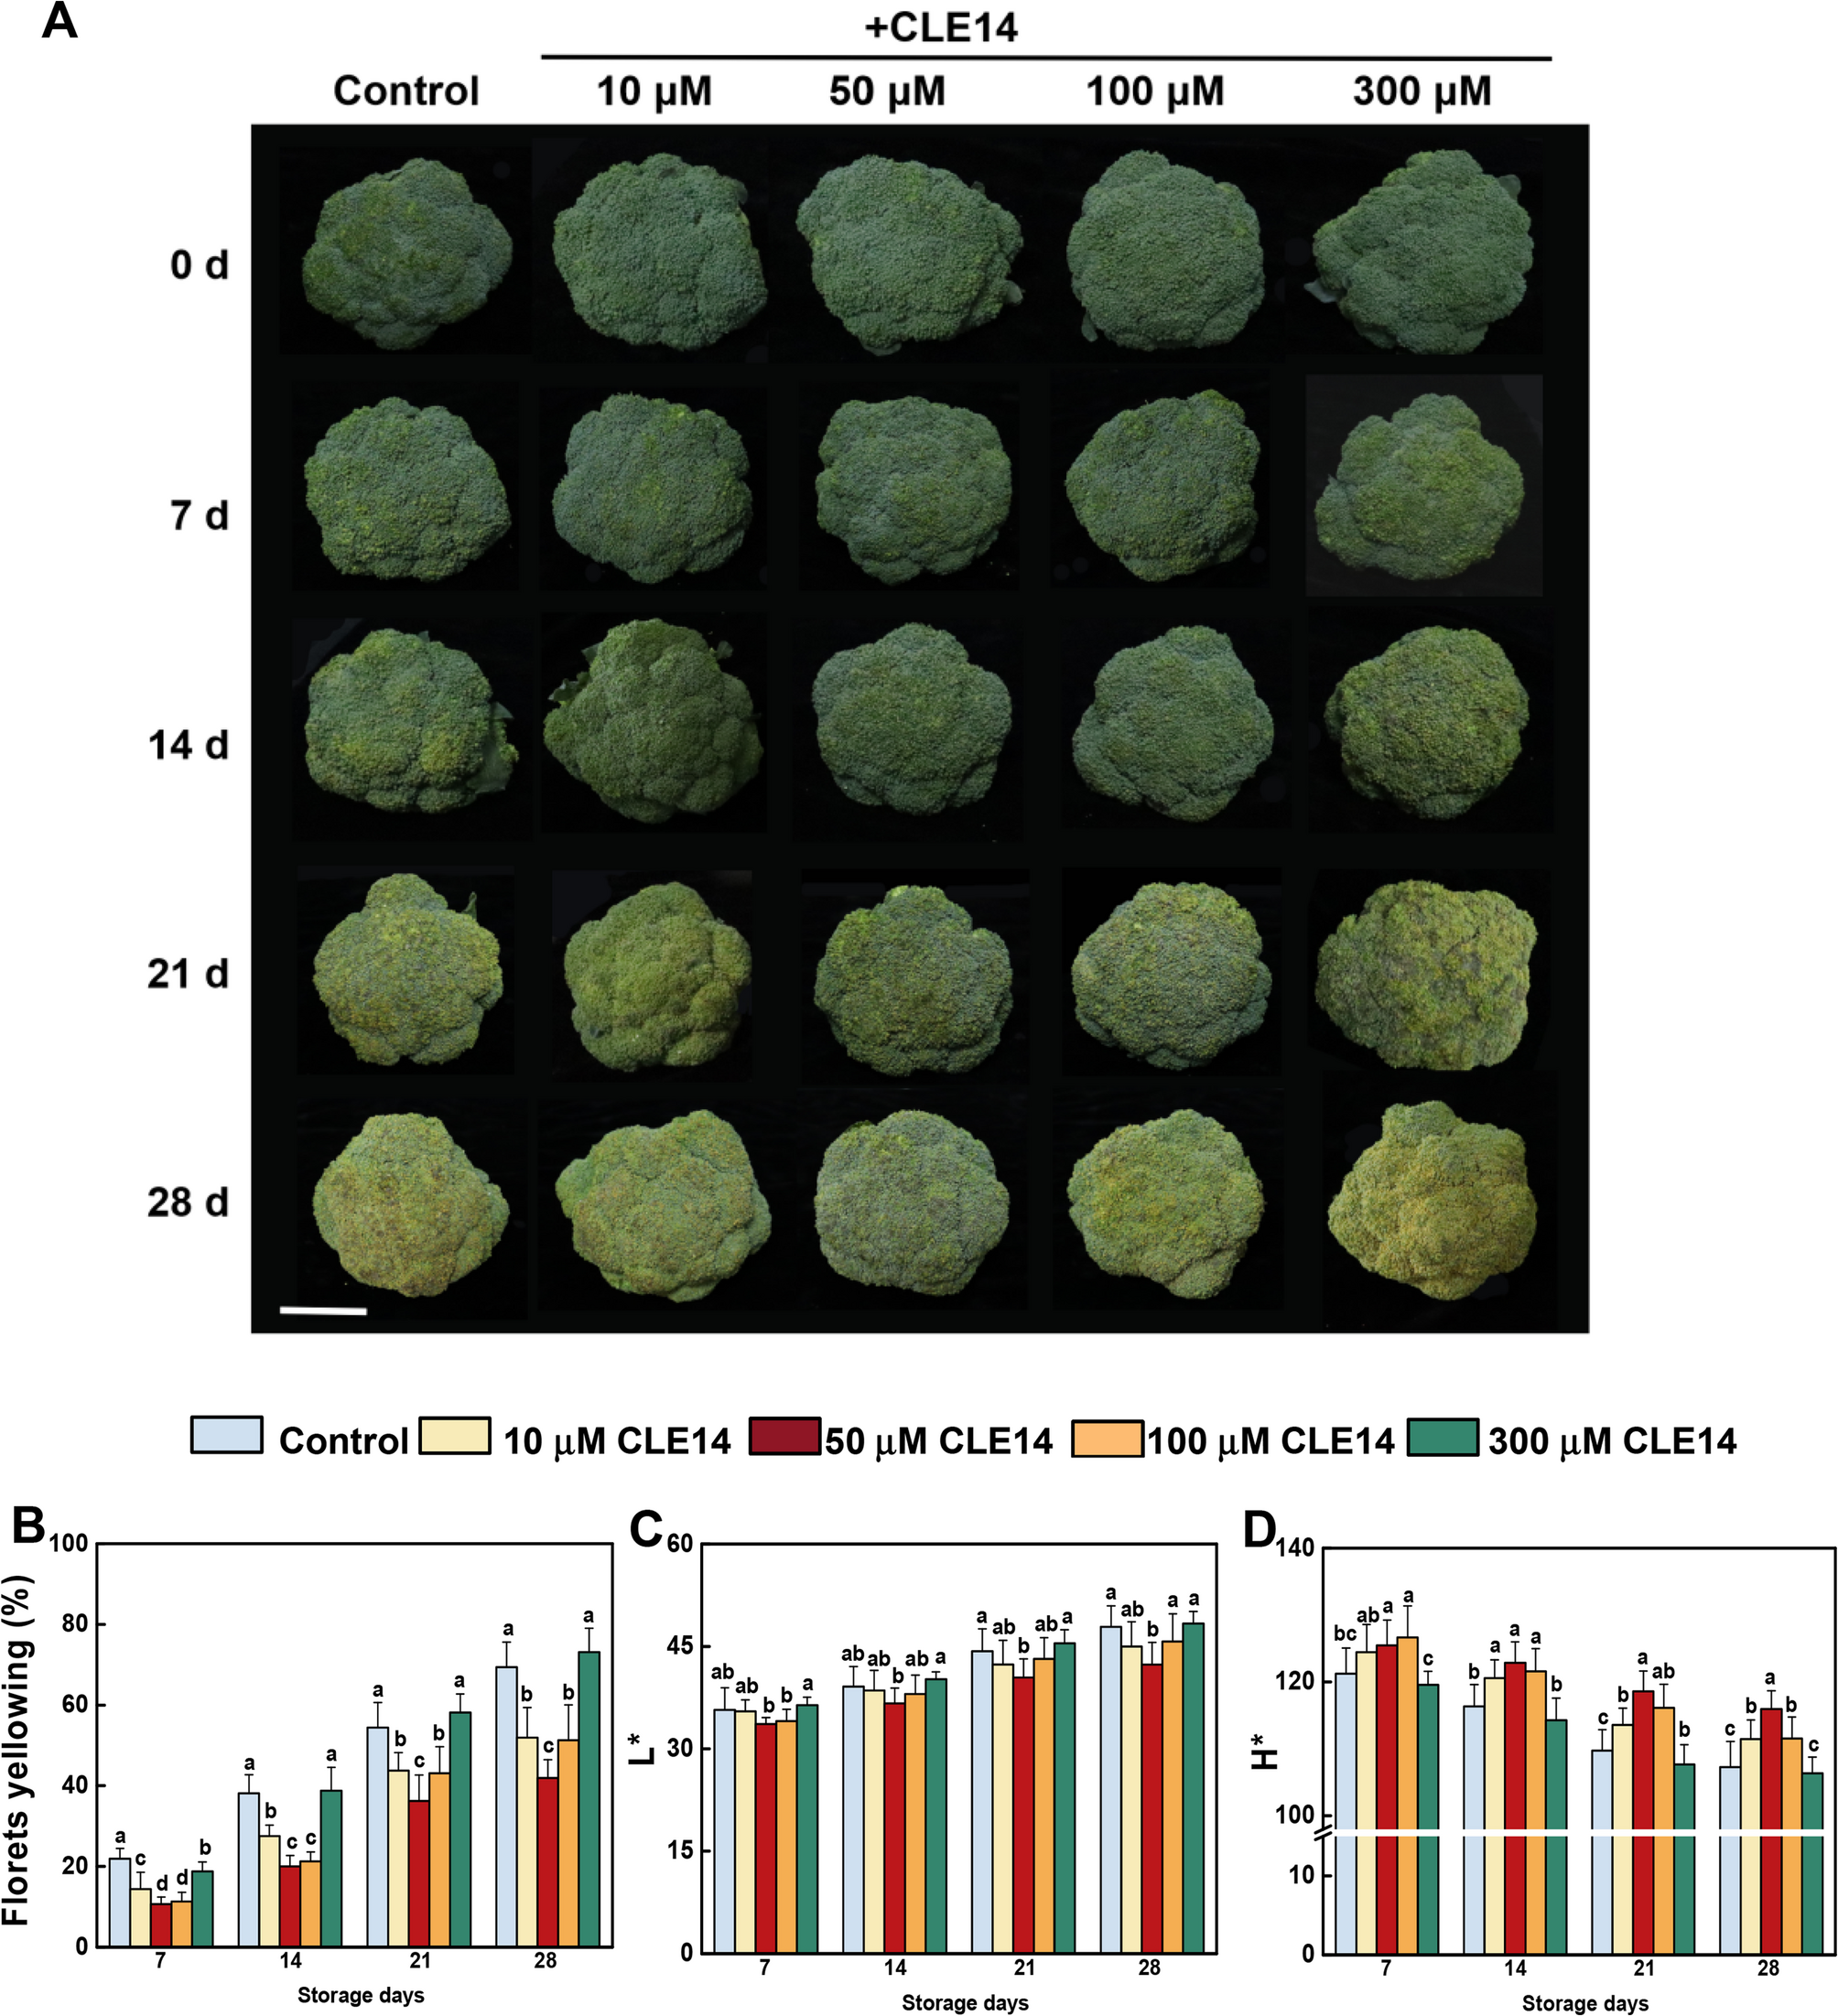
The CLE14 peptide was synthesized by Dongheng Biomedical Co., Ltd., China. A total of 300 broccoli heads were randomly assigned to 5 groups containing 60 broccoli heads each (three replicates, 20 broccoli heads per replicate) for the experimental treatments, and sprayed with 0 (control), 10, 50, 100 or 300 µM CLE14, respectively. After being dried overnight, the treated broccoli was packaged and stored at 4 ± 0.5℃ for 28 days. The appearance attributes were evaluated every 7 days. After each evaluation, the florets from the five broccoli groups were collected for subsequent gene expression and biochemical analyses.
Broccoli yellowing index and color detection
The broccoli yellowing index (%) was used to assess the yellowing area of broccoli surfaces using the scale described by Luo et al. [22]. The color parameters of broccoli were valued using a digital colorimeter (CR-400, Konica Minolta, Japan). The values of lightness (L*) and hue angle (H*) were measured at five points on each broccoli every 7 days.
Measurement of nutritional quality of broccoli
The soluble sugar content of broccoli was determined using a commercial assay kit (BC0030, Solarbio, China).
The soluble protein content in broccoli was measured using a BCA protein assay kit (ml095490, Shanghai Enzyme-linked Biotechnology, China). The intracellular proteins in broccoli were extracted using PBS buffer (50 mM, pH 7.4), and the soluble protein content was calculated by measuring the absorbance at 760 nm using BSA as a standard.
Broccoli endogenous Vitamin C content was detected using the solid blue salt colorimetric method descripted by Zhang and Huang [23]. Vitamin C content was calculated by measuring the absorbance at 420 nm.
Glucosinolate levels were quantified using a glucosinolate assay kit (ml092776, Shanghai Enzyme-Linked Biotechnology). Total glucosinolate content was determined by measuring the absorbance at 505 nm.
The phenolic and flavonoid contents were measured using the Folin-Ciocalteu method and NaNO2-Al(NO3)3-NaOH colorimetry method, respectively. First, broccoli samples (0.5 g) were mixed with 5 mL of methanol (80%) and subjected to ultrasonic treatment for 30 min. Supernatants were then collected for analysis. For phenolic content measurement, 200 µL of the supernatant was combined with 1 mL Folin-Ciocalteau and 800 µL Na2CO3 solution (75 g L−1), and the mixture was incubated at 25℃ for 1 h. The absorbance was then measured at 765 nm. For the total flavonoid content test, 1 mL of the supernatant was mixed with 1 mL 70% ethanol and 0.3 mL of 5% NaNO2. After mixing, 0.3 mL 10% Al(NO3)3 was added and the mixture was left to stand for 3 min at 25℃, 1 mL NaOH (1 mol L−1) was then added. The reaction mixture was detected at 510 nm after 10 min using rutin as a standard.
Chlorophyll content
The chlorophyll content was assessed following the method described by Xu et al. [24]. Approximately 100 mg of broccoli powder was added to 5 mL of acetone/ethanol (2:1) solution. Chlorophyll content was analyzed based on absorbance at 664 nm and 645 nm.
RNA extraction and quantitative PCR analysis
Total RNA was extracted from broccoli florets using an RNA Simple Total RNA Kit (Tiangen, China) with DNase I treatment. A ReverTra Ace quantitative (qPCR) reverse transcription (RT) kit (Toyobo, Japan) was used to synthesize cDNA. qRT-PCR assays were performed using the StepOne detection system (Thermo Fisher Scientific, USA) and SYBR Green PCR Master Mix Kit (Takara, Japan). Gene expression levels were calculated using the comparative ΔΔCt method. Briefly, the average Ct value for the target gene was normalized to the average Ct value of the endogenous reference gene (BoActin) to obtain the ΔCt value for each sample: ΔCt = Ct (target gene) – Ct (reference gene). The ΔΔCt value was then calculated as: ΔΔCt = ΔCt (test sample) – ΔCt (untreated sample). The relative fold change in gene expression was determined as 2^(-ΔΔCt). Three independent biological replicates were analyzed per experimental group. Sequences of primers are listed in Table S1.
RNA-seq analysis
Three independent repeats from the control and CLE14-treated broccoli at 0, 7, 14, 21, and 28 d post-harvest were used for RNA-seq analysis. RNA was extracted using the RNAprep Pure Plant Kit (Tiangen, China) and quantified using a NanoDrop 2000 spectrophotometer (Thermo Fisher Scientific). RNA integrity was determined using the RNA Nano 6000 Assay Kit of the Agilent Bioanalyzer 2100 system. Biomarker Technologies (Beijing, China) prepared Illumina libraries and sequenced them on an Illumina NovaSeq 6000 sequence platform (150 bases paired-end reads; Illumina, USA). The raw reads were further processed using the bioinformatics pipeline tool, and the BMKCloud (www.biocloud.net) online platform. Raw reads in fastq format were first processed through in-house Perl scripts, and the reads containing adapter or poly-N and low-quality reads were removed to obtain clean reads for further analyses. The proportion of clean reads in the samples (Q30) ranged from 94.62 to 97.82%. The cleaned reads were aligned to the Brassica oleracea reference genome from NCBI using hisat2 tools soft with default parameters. Gene expression levels were quantified by mapping fragments per kilobase of transcript per million fragments mapped (FPKM). Additional, differential expression analysis between treatments were performed using the DESeq2 package, and the genes with an adjusted P-value < 0.01 & Fold Change ≥ 2 were assigned as differentially expressed. Randomly chosen deferentially expressed genes were verified using qRT-PCR. The weighted gene co-expression network analysis (WGCNA) (min Module Size 30, and merge Cut Height, 0.25) was used to build a co-expression network. Data were analyzed using the online BMKCloud bioinformatics platform.
Malondialdehyde (MDA), H2O2 content and O2
•− production rate
The MDA levels were measured following Xu et al. [24]. Broccoli floret powder was mixed with 5 mL trichloroacetic acid, and the supernatant was collected via centrifugation. The supernatant was combined with 2 mL of thiobarbituric acid (0.67%) and boiled for 20 min. The MDA content was analyzed by measuring the absorbance at 450, 532, and 600 nm.
H2O2 content was measured using a Micro Hydrogen Peroxide (H2O2) Assay Kit (BC3590, Solarbio, China).
The generation rate of superoxide anions (O2•−) was determined using hydroxylamine oxidization according to Shi et al. [25]. Briefly, broccoli (0.5 g) was mixed with 2 mL of PBS buffer, and the supernatant was collected. The supernatant was mixed with 100 µL NH2OH·HCl (1 mM), 1 mL PBS buffer and subjected to incubation at 25℃ for 1 h. Following this, 1 mL C6H7NO3S (17 mM) and 1 mL C10H7NH2 (7 mM) were added. The generation rate of O2•− was calculated based on absorbance at 530 nm after incubation at 25℃ for 20 min, using NaNO2 as the standard.
Enzyme activities
The activities of pheophorbide a oxygenase (PAO) and pheophytinase (PPH) were measured using Plant enzyme activity Kits (Enzyme-linked Biotechnology).
Catalase (CAT) and superoxide dismutase (SOD) activity was measured as described by Cheng et al. [26]. Broccoli floret powder (0.5 g) was added to 3 mL of PBS buffer (50 mM, pH 7.8, with 0.2 mM EDTA, 2mM AsA, 25 mM HEPES, and 2% polyvinylpolypyrrolidone [w/v]). The supernatant was then collected for enzyme activity assay, which was performed using a SHIMADZU UV-2600 spectrophotometer (Shimadzu, Kyoto, Japan).
Statistical analysis
All data were analyzed using Statistical Analysis System version 8 (SAS Institute Inc., Cary, NC, USA). The significance of treatment differences was analyzed using ANOVA followed by Tukey’s test at the 5% significance level. Data were recorded as the mean ± standard errors (SE) of at least three independent biological replicates.