This section showcases the accomplishment of the suggested approach CBMDFBA and validates it using simulation data. Overall, energy usage and latency parameters concerning MDs and MHs are calculated. The simulation setup described in the section below is used to test the effectiveness of CBMDFBA.
Simulation setup
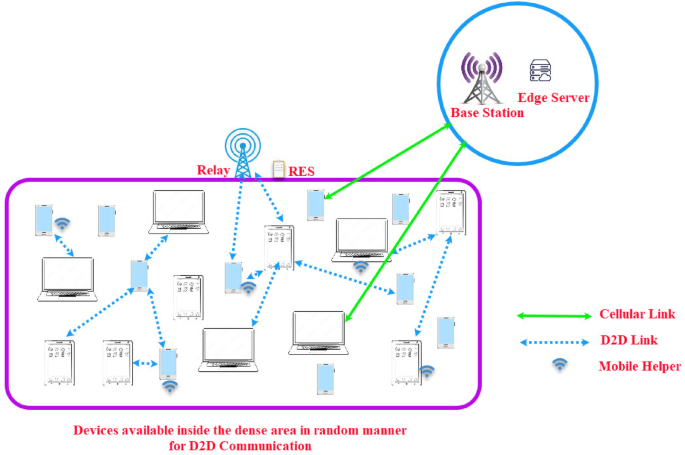
The geographical distribution of MDs is uniform inside the small dense area. Parameters used in simulation are shown in Table 4. BS is situated at a distance of 200 m from the area. 72 MDs are randomly located inside the small dense area of 20 m in length and 4.5 m in width. Out of 72 MDs, up to 20 available MHs can be selected randomly for computation offloading. For D2D connectivity, range for communication with MHs is 5 m. For both MDs and MHs, the maximum transmit power ({P_{hbox{max} }}) is 24 dBm. The network can tolerate a latency of 0.2 s. MDs and MHs have the following set of compute resources: ({f_{MD}})∈1 × 10⁹ CPU cycles/sec and ({f_{MH}})∈1 × 10⁹ CPU cycles/sec. For RES computation resource ({f_{RES}})∈15 × 109 CPU cycles/sec and for ES is ({f_{ES}}) ∈40 × 109 CPU cycles/sec. To compute 1-bit task,(Cr) ranges from 1500 to 2000. The devices effective system capacitance is ({C_Psi }) =10−28. The channel noise and path loss exponent are ({N_0}) = −174 dBm and (alpha) = 4 respectively. The data size for each user with high computational demands is uniformly distributed in ({L_r}) ∈ [1 2.5] Mbits. MATLAB 2023a version was used to perform simulation outcomes. The system features Intel(R) Core (TM) i5-8250 CPU running at 1.6 GHz, 16 GB RAM, and 64-bit Windows 11.
Simulation results
The results of various computing demands are discussed in this section. The performance is measured based on two parameters: latency and energy consumption. Total energy consumption is calculated by Eq. (16). Equations (1), (4), and (5). The difference in latency is vast between the proposed work and the existing work. So, latency is plotted on a logarithmic scale to differentiate the simulation results.
In Figs. 3 and 72 users have been considered when considering the ideal case of a dense area. And out of 72 users, five users are seeking task computation. A total of four schemes have been compared in Fig. 3 name as (1) Resource allocations using Q learning with considering parameter throughput- RA(QL-Munkres-TH), (2) Resource allocations using Q learning with considering parameter distance- RA(QL-Munkres-Dist), (3) Resource allocation with considering maximum power- RA(Max-Power), (4) Proposed scheme for resource allocation using CBMDFBA. The results have shown that the latency calculated in Fig. 3(a) for 1Mbps task size in the proposed scheme is reduced by 99.87% in comparison with RA(QL-Munkres-TH) scheme, 99.89% in comparison with RA(QL-Munkres-Dist) scheme and 99.73% in comparison with RA(Max-Power) scheme. The average latency has been calculated at 2.13ms only in the proposed scheme CBMDFBA. In Fig. 3(a), it is clear that the proposed algorithm is showing that the latency is reducing with increasing the number of users. In Fig. 3(b), the task size has been considered 1.5Mbps, and it found that 99.86% has reduced the latency, 99.88%, and 99.71%, respectively, to the scheme RA(QL-Munkres-TH), RA(QL-Munkres-Dist) and RA(Max-Power). The average latency has been calculated at 3.75ms only in the proposed scheme CBMDFBA. Figure 3(b) shows that the proposed method decreases latency as the number of user increases. In addition, it is performing well, even with an increment in task size.
Latency vs. MDs for (a) ({t_s}) = 1Mbps, (b) ({t_s}) = 1.5Mbps, (c) ({t_s}) = 2Mbps, (d) ({t_s}) = 2.5 Mbps.
Figure 3(c) shows that when compared to schemes RA(QL-Munkres-TH), RA(QL-Munkres-Dist) and RA(Max-Power) with task size of 2Mbps resulted in a 99.87%, 99.89%, and 99.74% reduction in latency. According to the proposed CBMDFBA scheme, the average latency is 4.34 ms. It also indicates that the proposed algorithm’s latency is decreasing with increasing users. Figure 3(d) demonstrates that a task size of 2.5Mbps led to a 99.84%, 99.87%, and 99.68% reduction in latency when compared to schemes RA(QL-Munkres-TH), RA(QL-Munkres-Dist) and RA(Max-Power). The average delay, as per the proposed CBMDFBA scheme, is 6.69ms. Also, the latency is decreasing with the number of users.
In Fig. 4, Energy consumption is calculated, and simulation results are compared. In Fig. 4(a), the average energy consumption is 973.4 J for the proposed CBMDFBA scheme, which is 53.56% less than a comparison of scheme RA(QL-Munkres-TH). And 61.20% less in comparison with scheme RA(QL-Munkres-Dist) and 67.67% less with scheme RA(Max-Power) for the task size of 1Mbps. Figure 4(b) demonstrates that a task size of 1.5Mbps led to a 72.82%, 75.62%, and 79.69% reduction in energy consumption when using CBMDFBA as compared to RA(QL-Munkres-TH), RA(QL-Munkres-Dist) and RA(Max-Power).
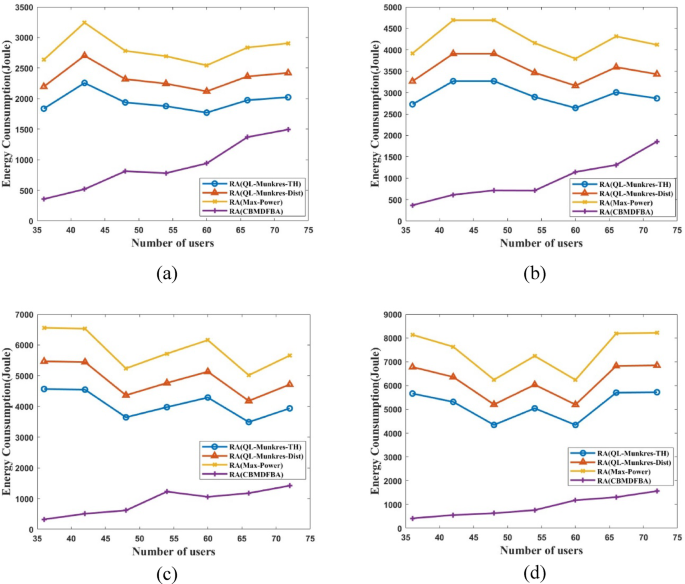
Energy usage vs. MDs for (a) ({t_s}) = 1Mbps, (b) ({t_s}) = 1.5Mbps, (c) ({t_s}) = 2Mbps, (d) ({t_s}) = 2.5 Mbps.
The average energy consumption is calculated at 899.1 J in the proposed scheme CBMDFBA. In Fig. 4(c), task size 2Mbps is considered, and it found that the energy consumption is reduced by 76.31%, 80.21%, and 83.51%, respectively, to the scheme RA(QL-Munkres-TH), RA(QL-Munkres-Dist) and RA(Max-Power). The average energy consumption is 917.4 J only in the proposed scheme CBMDFBA. Figure 4(d) shows that, when the proposed scheme is compared to schemes RA(QL-Munkres-TH), RA(QL-Munkres-Dist), and RA(Max-Power) with taking task size 2.5Mbps, it resulted in 83.26%, 86.01%, and 88.34% reduction in energy consumption. According to the proposed CBMDFBA scheme, the average energy consumption is 841 J. From Fig. 4, it is clear that energy consumption is increasing with the increasing number of users.
In next scenario, we have considered the 52 MDs and 20 MHz are available in dense areas. We have increased the number of MHs to see the variation in simulation results. In Fig. 5, latency has been calculated with varying numbers of MHs. Figure 5(a) shows that the CBMDFBA scheme lowers latency by 99.86% when compared to the RA(QL-Munkres-TH), 99.88% when compared to the RA(QL-Munkres-Dist) scheme, and 99.71% when compared to the RA(Max-Power) strategy for a 1Mbps task size.
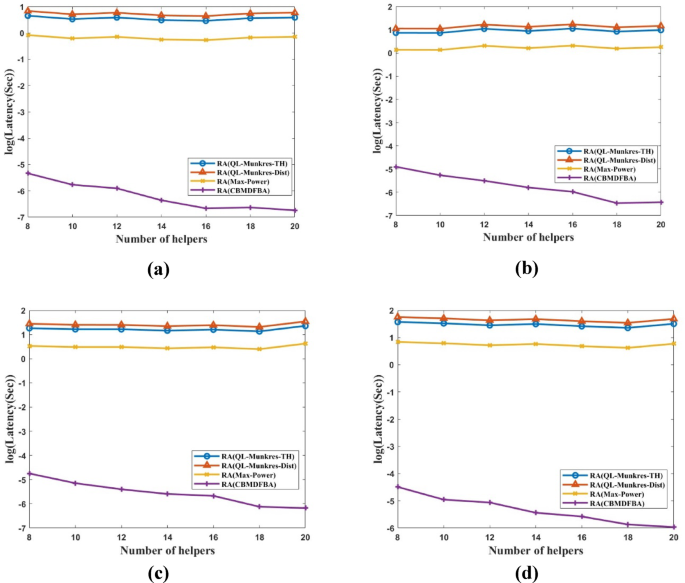
Latency vs. MHs for (a) ({t_s}) = 1Mbps, (b) ({t_s}) = 1.5Mbps, (c) ({t_s}) = 2Mbps, (d) ({t_s}) = 2.5 Mbps.
In the CBMDFBA scheme, the average latency is calculated at 2.27 ms. Figure 5(b) shows that, when comparing proposed scheme with scheme RA(QL-Munkres-TH), RA(QL-Munkres-Dist) and RA(Max-Power), the latency is decreased by 99.84%, 99.87%, and 99.70%, respectively, with 1.5Mbps. In the proposed CBMDFBA system, the average latency is determined at 3.59ms. Task size of 2Mbps is examined in Fig. 5(c), and it is found that, in comparison to Schemes RA(QL-Munkres-TH), RA(QL-Munkres-Dist), and RA(Max-Power), the latency in the proposed scheme is decreased by 99.87%, 99.89%, and 99.72%, respectively. In the proposed CBMDFBA system, the average latency is 4.89 ms. Figure 5(d) shows that, when comparing scheme RA(QL-Munkres-TH), RA(QL-Munkres-Dist), and RA(Max-Power) with proposed CBMDFBA, the latency is decreased by 99.88%, 99.90%, and 99.78%, respectively with task size 2.5Mbps. The proposed CBMDFBA technique yielded an average delay of 5.10 ms. From Fig. 5, it is evident that the latency is decreasing with the increase in the number of helpers, and it also shows better results for larger task sizes.
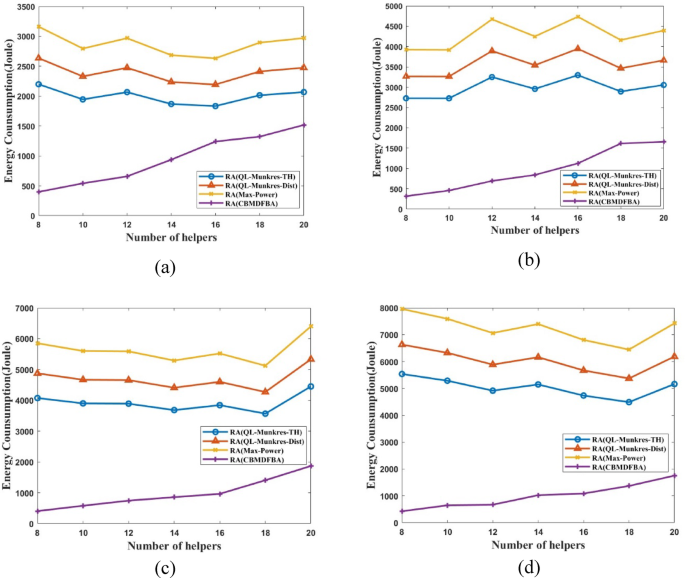
Energy usage vs. MHs for (a) ({t_s}) = 1Mbps, (b) ({t_s}) = 1.5Mbps, (c) ({t_s}) = 2Mbps, (d) ({t_s}) = 2.5 Mbps.
Figure 6 presents the energy consumption calculation and a comparison of the simulation results. Figure 6(a) shows that the proposed CBMDFBA scheme’s average energy consumption is 955.9 J, 53.91% less than scheme RA(QL-Munkres-TH). Additionally, there was a 60.82% decrease from scheme RA(QL-Munkres-Dist) and a 67.35% decrease from scheme RA(Max-Power). In Fig. 6(a), the task size is considered 1Mbps.
Compared to schemes RA(QL-Munkres-TH), RA(QL-Munkres-Dist), and RA(Max-Power), Fig. 6(b) shows that a task size of 1.5Mbps resulted in a reduction of 68.93%, 74.05%, and 78.37% in energy usage for the proposed scheme. The proposed approach calculates the average energy usage at 943.7 J. When comparing the proposed scheme CBMDFBA to schemes RA(QL-Munkres-TH), RA(QL-Munkres-Dist) and RA(Max-Power), Fig. 6(c) shows that a task size of 2Mbps resulted in a reduction in energy consumption of 78.29%, 81.87%, and 84.89% with schemes RA(QL-Munkres-TH), RA(QL-Munkres-Dist) and RA(Max-Power) respectively.
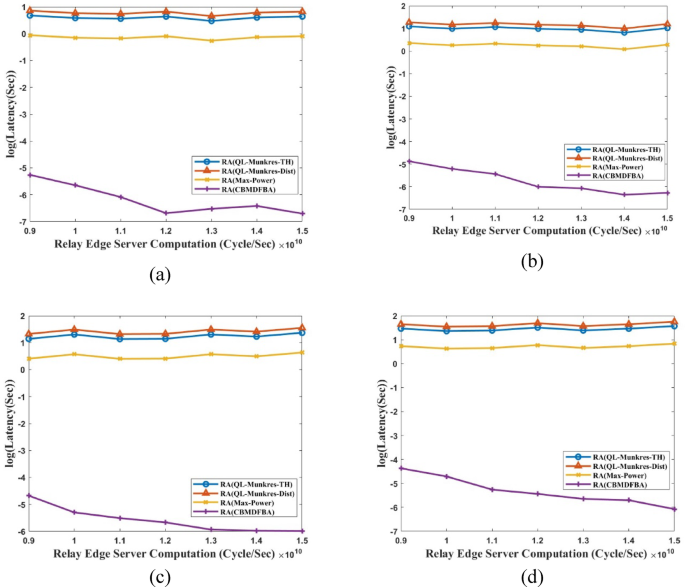
Latency vs. RES computation (a) ({t_s}) = 1Mbps, (b) ({t_s}) = 1.5Mbps, (c) ({t_s}) = 2Mbps, (d) ({t_s}) = 2.5 Mbps.
The total average energy consumption in the proposed scheme is 908.3 Joules. Comparing the CBMDFBA to schemes RA(QL-Munkres-TH), RA(QL-Munkres-Dist) and RA(Max-Power) with a task size of 2.5Mbps, Fig. 6(d) shows that the reduction in energy usage is reduced by 79.45%, 82.83%, and 85.69% respectively for schemes RA(QL-Munkres-TH), RA(QL-Munkres-Dist) and RA(Max-Power) with proposed scheme. The average energy usage is 1036 J for the CBMDFBA scheme. In Fig. 6, it is clearly shown that the energy consumption is increasing with the increasing number of helpers due to the increment of the interference between the devices.
Figure 7 presents simulation results for latency vs. RES computation (cycle/sec). Figure 7(a) shows that the proposed CBMDFBA scheme’s average latency is 2.09ms, 99.88% less than scheme RA(QL-Munkres-TH). Additionally, there is a 99.90% reduction from scheme RA(QL-Munkres-Dist) and a 99.76% reduction from scheme RA(Max-Power). In Fig. 7(a), the task size is considered to be 1Mbps. Figure 7(b) shows that, when comparing the proposed scheme with scheme RA(QL-Munkres-TH), RA(QL-Munkres-Dist), and RA(Max-Power), the latency is decreased by 99.88%, 99.90%, and 99.75%, respectively with considering task size 1.5 Mbps. In the proposed CBMDFBA scheme, the average latency is determined to be 3.05ms. The task size of 2Mbps is examined in Fig. 7(c), and it is found that, in comparison to Schemes RA(QL-Munkres-TH), RA(QL-Munkres-Dist), and RA(Max-Power), the latency in the proposed scheme is decreased by 99.86%, 99.88%, and 99.71%, respectively. The average latency in the proposed CBMDFBA system is calculated at 4.61 ms. Figure 7(d) shows that, when comparing scheme RA(QL-Munkres-TH), RA(QL-Munkres-Dist) and RA(Max-Power) with CBMDFBA, the latency is decreased by 99.86%, 99.88%, and 99.72%, respectively, when the task size selected 2.5 Mbps. The proposed CBMDFBA technique yielded an average delay of 5.93ms. Figure 7 shows that the proposed scheme performs well even if the task size increases. Latency is decreasing; even RES computation is expanding.
Figure 8 presents the energy consumption calculation and a comparison of the simulation results for RES computation. Figure 8(a) shows that the proposed CBMDFBA scheme’s average energy consumption is 1114 J, 46.52% less than scheme RA(QL-Munkres-TH). Additionally, there is a 55.31% reduction from scheme RA(QL-Munkres-Dist) and a 62.76% reduction from scheme RA(Max-Power). In Fig. 8(a), the size of the task is considered 1Mbps. Compared to schemes RA(QL-Munkres-TH), RA(QL-Munkres-Dist), and RA(Max-Power), Fig. 8(b) shows that a task size of 1.5Mbps resulted in a reduction of 66.36%, 71.89%, and 76.58% in energy usage for the proposed scheme.
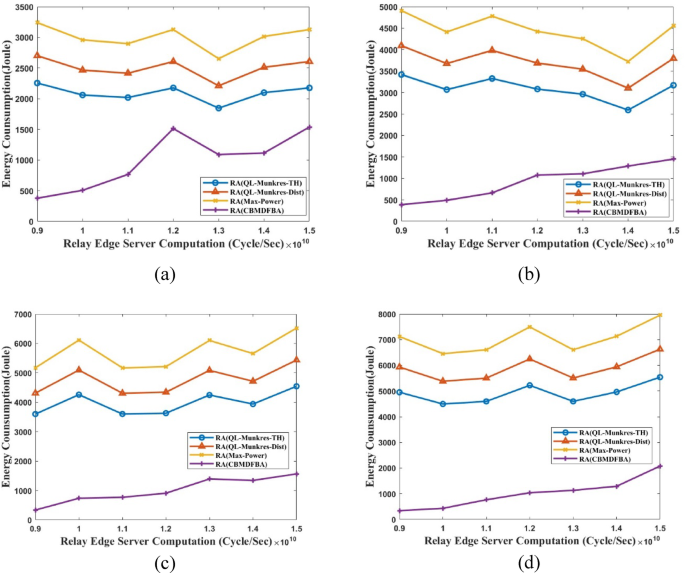
Energy usage vs. RES computation for (a) ({t_s}) = 1Mbps, (b) ({t_s}) = 1.5Mbps, (c) ({t_s}) = 2Mbps, (d) ({t_s}) = 2.5 Mbps.
The proposed approach determines the average energy usage as 989.4 J. When comparing the proposed scheme CBMDFBA to schemes RA(QL-Munkres-TH), RA(QL-Munkres-Dist) and RA(Max-Power), Fig. 8(c) shows that a task size of 2Mbps resulted in a reduction in energy consumption of 76.65%, 80.49%, and 83.74%. The total average energy consumption in the proposed scheme is 937.7 Joules. Comparing the CBMDFBA to schemes RA(QL-Munkres-TH), RA(QL-Munkres-Dist), and RA(Max-Power) with a task size of 2.5Mbps, Fig. 8(d) shows that the reduction in energy usage is 81.63%, 84.66%, and 87.21%. The average energy usage is 933.4 J per the planned CBMDFBA system. In Fig. 8, it is clearly shown that the energy consumption increases with the increase in the RES computation due to the increase in the interference between the devices.
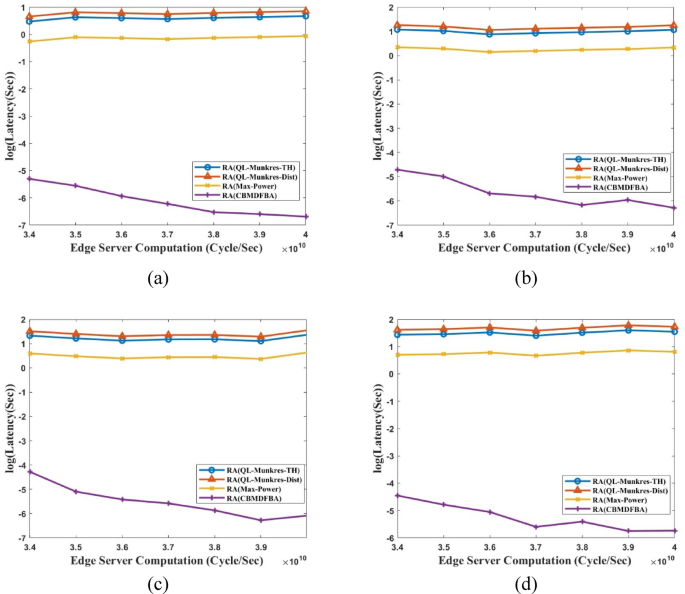
latency vs. ES usage for (a) ({t_s}) = 1Mbps, (b) ({t_s}) = 1.5Mbps, (c) ({t_s}) = 2Mbps, (d) ({t_s}) = 2.5 Mbps.
Figure 9 presents simulation results for latency vs. ES computation (cycle/sec). Figure 9(a) shows that the proposed CBMDFBA scheme’s average latency is 2.47 ms, 99.86% less than scheme RA(QL-Munkres-TH). There are 99.88% and 99.71% reductions, respectively, to scheme RA(QL-Munkres-Dist) and RA(Max-Power). In Fig. 9(a), the size of the task is considered to be 1Mbps. Figure 9(b) shows that, when comparing the proposed scheme with scheme RA(QL-Munkres-TH), RA(QL-Munkres-Dist), and RA(Max-Power), the latency is decreased by 99.87%, 99.89%, and 99.72%, respectively with task size 1.5 Mbps. In the proposed CBMDFBA scheme, the average latency is calculated at 3.53ms. The task size of 2Mbps is examined in Fig. 9(c), and it is found that, in comparison to Schemes RA(QL-Munkres-TH), RA(QL-Munkres-Dist), and RA(Max-Power), latency in the proposed scheme is decreased by 99.86%, 99.89%, and 99.72%, respectively. In the proposed CBMDFBA scheme, the average latency is determined at 4.73 ms. Figure 9(d) shows that, when comparing scheme RA(QL-Munkres-TH), RA(QL-Munkres-Dist) and RA(Max-Power) with CBMDFBA, the latency is decreased by 99.88%, 99.90%, and 99.75%, respectively with task size 2.5 Mbps. The proposed CBMDFBA technique yielded an average delay of 4.94ms. Figure 9 shows that the proposed scheme performs well even if task size increases. Latency also decreases even with ES computations increasing.
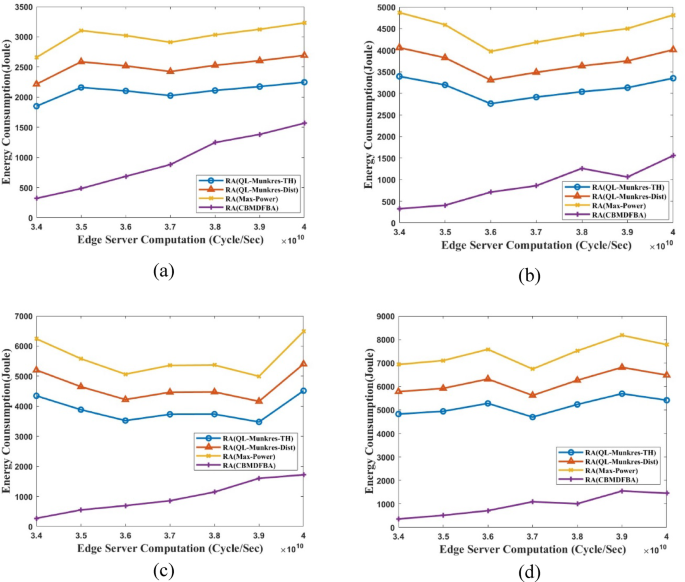
Energy consumption vs. ES computation for (a) ({t_s}) = 1Mbps, (b) ({t_s}) = 1.5Mbps, (c) ({t_s}) = 2Mbps, (d) ({t_s}) = 2.5 Mbps.
Figure 10 presents the energy consumption calculation and a comparison of the simulation results for ES computation. Figure 10(a) shows that the proposed CBMDFBA scheme’s average energy consumption is 974.4 J, which is 53.33% less than scheme RA(QL-Munkres-TH), 61.01% less than scheme RA(QL-Munkres-Dist) and a 67.51% less from scheme RA(Max-Power) for 1Mbps task size. Compared to schemes RA(QL-Munkres-TH), RA(QL-Munkres-Dist), and RA(Max-Power), Fig. 10(b) shows that a task size of 1.5Mbps resulted in a reduction of 68.54%, 73.71%, and 78.09% in energy usage for the proposed scheme. The proposed approach determines the average energy usage as 964.8 J. When comparing the proposed scheme CBMDFBA to schemes RA(QL-Munkres-TH), RA(QL-Munkres-Dist) and RA(Max-Power), Fig. 10(c) shows that a task size of 2Mbps resulted in a reduction in energy consumption of 75.96%, 79.92%, and 83.26%. The total average energy consumption in the proposed scheme is 982.4 Joules. Comparing the CBMDFBA to schemes RA(QL-Munkres-TH), RA(QL-Munkres-Dist), and RA(Max-Power) with a task size of 2.5Mbps, Fig. 10(d) shows that the reduction in energy usage is 78.44%, 81.99%, and 84.99%. The average energy usage is 1037 J, as per the CBMDFBA. In Fig. 10, it is clearly shown that the energy consumption increases with enlarge in the RES computation due to surge in the interference between the devices.
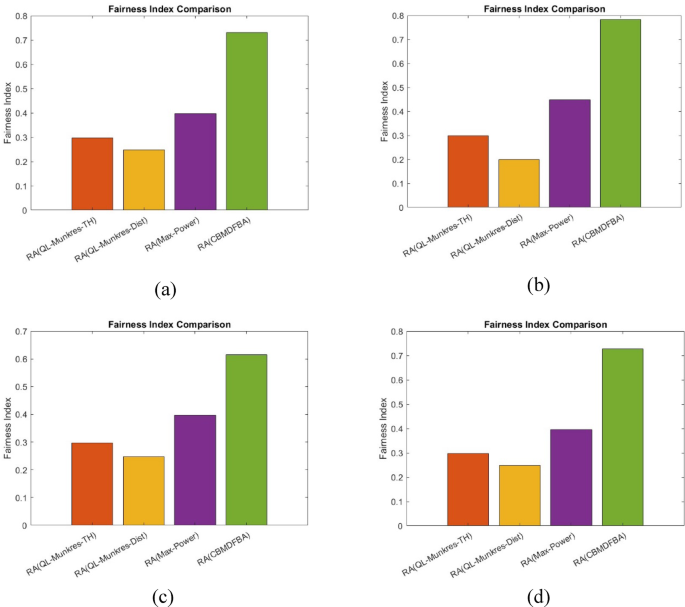
Fairness Index with varying (a) Mobile users, (b) mobile helps, (c)({f_{RES}}), (d) ({f_{ES}}).
Fairness index is calculated with the help of:
$$f(x)=frac{{(sumlimits_{{i=1}}^{n} {{x_i}{)^2}} }}{{nsumlimits_{{i=1}}^{n} {x_{i}^{2}} }}$$
(29)
A high fairness index means resources are distributed efficiently in the system. A comparison between all the baseline algorithms and the proposed algorithm is shown in Fig. 11. The figure shows that the proposed algorithm has the highest fairness index.
Figure 12 represents a plot between energy efficiency and edge server computation for the all baseline algorithms and proposed algorithm for varying MUs, MHs, ({f_{RES}})and({f_{ES}}). The figure shows that the energy efficiency is highest for the proposed algorithm compared to baseline algorithms.
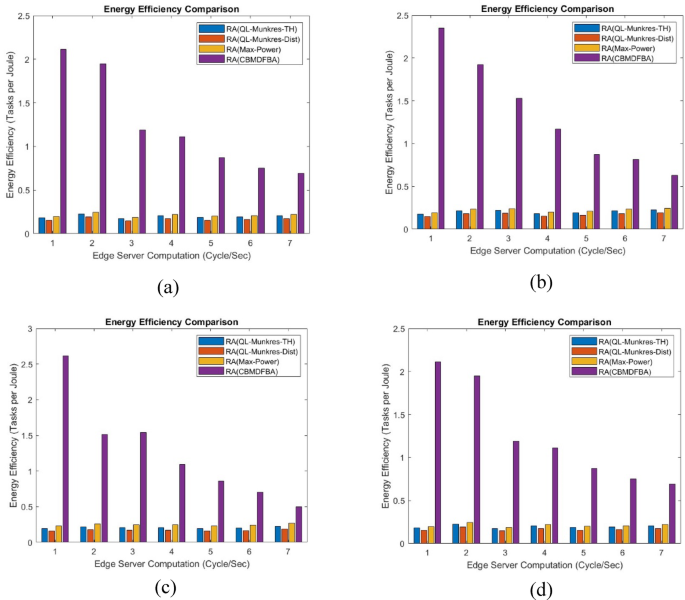
Energy Efficiency with varying (a) Mobile users, (b) mobile helps, (c)({f_{RES}}), (d) ({f_{ES}}).
Convergence of the proposed algorithm CBMDFBA is shown in Fig. 13. Average Q-values settle after a certain number of repetitions.
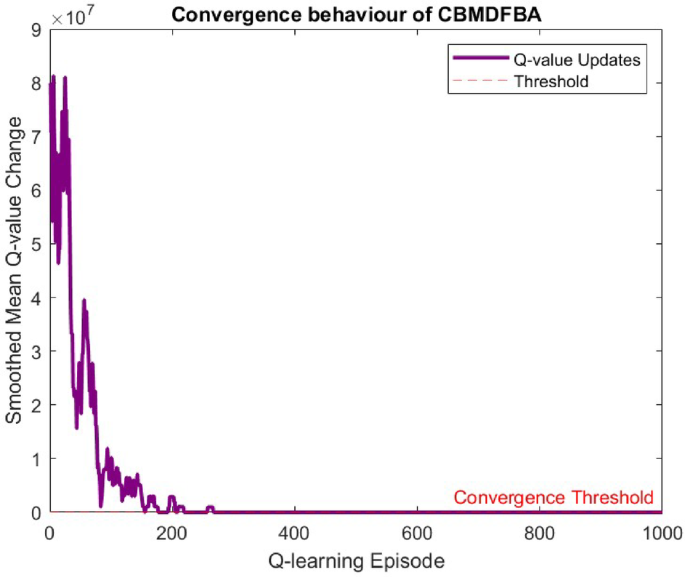
Convergence behaviour of CBMDFBA.