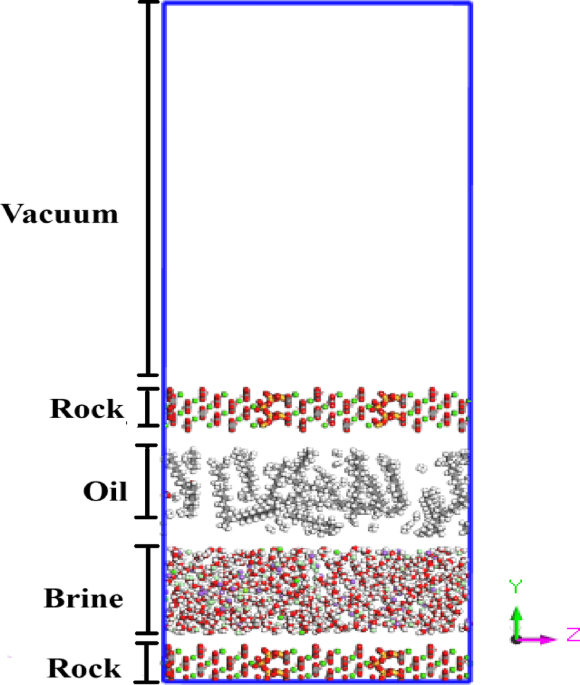
To elucidate the role of LSWI in altering interfacial properties, this study focuses on the behavior of the EDL at the surface of composite carbonate reservoir rocks composed of both calcite and quartz. Using MD simulations, we systematically investigated how key brine ions (Na⁺, Cl⁻, Mg²⁺, and Ca²⁺) interact with the heterogeneous surface under varying salinity conditions. The mineralogical contrast between calcite and quartz provides a unique framework to assess ion-specific preferences and localized EDL formation. Our results highlight that salinity not only affects the overall EDL thickness but also modulates the spatial distribution of ions at the distinct calcite–quartz interfaces. These observations reveal critical insights into how composite rock–brine interactions contribute to the effectiveness of the LSWI mechanism, as detailed in the following section.
Table 3 presents the energy interactions between components (H-water, O-water, oil, Na+, Cl−) in three different systems (DW, SW, and FW) for two rock composite tissues, CaCO3 and SiO2. The negative values indicate attractive forces, while positive values indicate repulsive forces. The values highlighted in blue in Table 3 are obtained by summing the values of the two rows directly above them.
These values reflect the cumulative interaction energy across all pairs within the specified groups. The unusually high values arise due to the large number of particle pairs contributing to the total energy. The reported values represent the average of the total cumulative energy across all such pairs during production simulation time. This approach accounts for temporal fluctuations and provides a representative value for the interaction energy.
Interaction between Na+ and the rock surface
Table 3 details notable observations regarding the negative interaction between Na + and CaCO3 (values of – 185 kcal/mol for DW, – 789 kcal/mol for SW, and − 1539 kcal/mol for FW). As salinity increases, so does the adsorption capacity of CaCO3 rock; this suggests that CaCO3 rock has an increased capacity for Na+ adsorption50, which indicates a favorable interaction of Na + ions with CaCO3 tissue.
Na + exhibits an initial negative interaction (value of – 80 kcal/mol), expressed by attraction to the SiO2 surface. However, as salinity increases, this effect becomes positive (values of 374 kcal/mol for SW and 208 kcal/mol for FW) due to the occupation of the oxygen atoms of the SiO2 rock surface with Na+ ions in the SW system. indicating that Na+ repulsively affects the SiO2 surface and causes it to retreat from the surface. This is an unfavorable interaction for the EOR mechanism for two reasons: first, it increases the thickness of the EDL; second, it destroys the integrity of the stern layer that previously appeared on the surface of pure calcite, which was representative of the reservoir rock9,15,50,51. In turn, the instability of the stern layer leads to a decrease in EOR.
Nevertheless, when considering the overall interaction of Na⁺ with the entire composite rock surface, the net interaction becomes increasingly negative with salinity. This suggests that the overall force exerted by Na+ is attractive to the entire surface of the reservoir rock, indicating a favorable interaction for the EOR mechanism.
Interaction between Cl– and the rock surface
Another significant observation in Table 3 is the interaction between Cl⁻ ions and CaCO₃ surfaces. Cl⁻ exhibits a repulsive interaction with calcite that becomes increasingly pronounced with rising salinity, as reflected by interaction energies of + 658 kcal/mol, + 1479 kcal/mol, and + 2627 kcal/mol for the IW, SW, and FW systems, respectively. These increasingly positive values indicate that Cl⁻ ions are positioned farther away from the calcite surface at higher salinities. This behavior is further supported by the ion number density profiles shown in Fig. 3, which demonstrate that Cl⁻ distributions become more spatially localized under high-salinity conditions. The greater separation between Cl⁻ and the calcite surface reduces the hydrophilicity of the CaCO₃ phase, thereby negatively affecting key mechanisms related to EOR. This interpretation is consistent with the findings of Dastjerdi et al.51. In contrast, Cl− and SiO2 show a negative interaction at the beginning of the DW system, wherein Cl− is adsorbed to the SiO2 rock. The interaction energy increases to − 667 kcal/mol in the SW system as salinity rises, whereas it decreases to − 476 kcal/mol in FW. This suggests that Cl⁻ ions cease to interact significantly with the SiO₂ surface beyond a certain concentration. In the FW system, this behavior is attributed to the saturation of available surface sites, where Cl⁻ ions occupy all accessible Si sites on the SiO₂ surface. Briefly, it is significant to note that for all three systems under study, the total interaction between Cl− and the reservoir rock surface is positive (repulsion from the rock surface). On the other hand, Cl− prefers to adsorb to the SiO2 part of the reservoir rock surface. However, the increase in the Cl− is one of the main factors in creating the difference in electrical charge and, as a result, reduces the hydrophilicity of the rock surface, which leads to a decrease in EOR, Which is also consistent with Ding et al.52 observations.
We analyzed the electrostatic interactions of Na⁺ and Cl⁻ ions with the rock surface to quantify the charge-dependent interaction disparity. A stronger attractive force was observed between Na⁺ ions and the negatively charged rock surface, leading to a net positive interaction energy difference favoring Na⁺ adsorption. Meanwhile, the rock surface with Cl− ions exhibits a negative electrostatic force. The difference in electrostatic force values determines the interaction strength of the entire reservoir rock. The discrepancy in this electric charge provides a force-type value on the entire reservoir rock surface. In the ninth row (∑Na++Cl−) of Table 3, the interaction rates between Na+ and Cl− are listed in Table 3. The interaction energy value ranges from 209 kcal/mol in low-salinity to 764 kcal/mol. The FW system has recorded the most significant increase, leading to the highest reduction in the thickness of the EDL layer. At high salinities, the increasing electric charge difference force between brine ions is the primary factor influencing the reduction in EDL layer thickness. To validate this assertion, the findings derived from molecular dynamics were utilized. The charge density, density profile, and radial distribution function (RDF) plots are presented.
(1) The charge density and density profile:
Figure 2 displays the density diagrams for DW, SW, and FW systems on the right-hand side, while their charge diagram is on the left. The figure displays the salinity increase from top to bottom. purple and yellow lines indicate an increase in both value and area under the curve, which represents the increase in the electric force difference between Na+-Cl−. This information is also presented in Table 3. It is quantified by numbers. However, the density graphs on the right-hand side of Fig. 2 illustrate the increase in density of Na+ and Cl− ions (represented by the blue and green lines) as salinity increases. This change in density is believed to be the primary factor influencing the alteration of surface wettability, which is in agreement with the study24. Based on the findings, it can be inferred that the development of the EDL on a charged surface is influenced by the salinity and ionic compositions. Injecting low-ionic strength LSW decreases the repulsive electrostatic forces between the interfaces of oil-brine and brine-rock. This leads to the expansion of the EDL, resulting in the thickening of a thin water layer that separates oil and rock. As a consequence, the wettability of the system shifts towards a water-wet state, facilitating the separation of oil and increasing the oil’s relative permeability.
The charge density is on the left side, and the density profile is on the right for DW, SW, and FW systems from top to bottom.
The expansion of EDL in the rock surface
Rock surfaces that come into contact with water attract positively charged cations, which are typically hydrated with water molecules, called the Stern layer, and it is devoid of anions. The positive charge of this layer can be caused by two possible causes. First, while the calcite plane is a neutral surface, the outermost atoms of the surface are sets of oxygen atoms of carbonate groups, resulting in relative polarity of the surface with a partial negative charge. Second, polar water molecules create a monolayer on the surface, increasing its polarity. The slab’s improved polarity with partial negative charge due to oxygen atoms makes it a favorable substrate for Na+ ions adsorption. Beyond the positive Stern layer, adjacent to the Stern layer is the Diffuse layer, which comprises liberated ions and has a greater concentration of counter ions. The term “EDL” denotes these two layers, and its thickness has been believed to be a significant factor in the mechanism by which wettability changes53.
Ion number-density profiles as a function of distance from a cleaved calcite–quartz composite for (A) SW and (B) FW. Gray shading denotes the atomic planes of the rock surfaces; the green region marks the Stern layer (SL), where counterions are tightly adsorbed, and the pink region indicates the diffuse layer (DL), where ion densities decay into the bulk.
In SW (Fig. 3A), the SL thickness is approximately 1.5 Å, with Na⁺ and Cl⁻ peaks that are relatively broad and a modest contribution of Ca²⁺/Mg²⁺ reflecting lower ionic strength (interaction energy ≈ 437 kcal/mol). In FW (Fig. 3B), the SL compresses to ~ 1.0 Å, dominated by sharply defined Na⁺ and Cl⁻ peaks (interaction energy ≈ 765 kcal/mol), in agreement with observations by Bourg and Sposito54. while divalent cations (Ca²⁺/Mg²⁺) remain less abundant near the surface due to competition and their stronger hydration, specifically for Mg2+ ions which exhibit a greater separation from the quartz surface compared to the calcite surface, indicating weaker direct surface interactions with quartz. This behavior is discussed in detail in Fig. 4. Beyond the SL, the first Cl⁻ peak shifts from ~ 10 Å in SW to ~ 12 Å in FW, and both Na⁺ and Cl⁻ distributions become more localized under high salinity. These results confirm that elevating brine salinity compacts the Stern layer and intensifies interfacial electrostatic interactions, thereby promoting ion bridging that enhances oil adhesion and drives the system toward oil-wet conditions, This finding aligns with the results reported by Gu et al.15 and Tian et al.33.
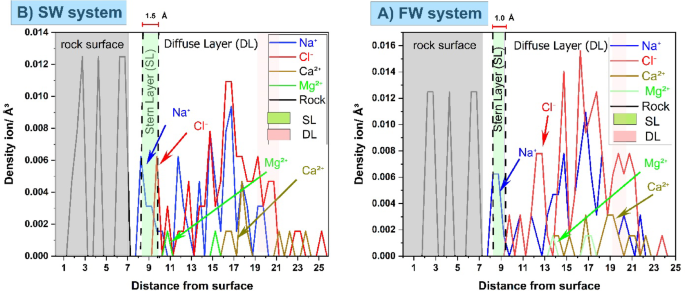
Ion number density profiles for Na⁺, Cl⁻, Ca²⁺, and Mg²⁺, illustrating the formation of EDL on a composite calcite–quartz surface for (a) SW and (b) FW systems.
Figure 4a illustrates the RDF of Na+ ions interacting with oxygen on the surface of the CaCO3 reservoir rock. The RDF is plotted using a cut-off radius of 12 Å. The RDF is calculated separately for DW, SW, and FW. This allows for analyzing and studying the probable phenomena occurring near the rock within the specified distance. The initial peak is observed at a radius of 2.125 Å, indicating the beginning of Na+ ions pairing. The corresponding values are (23, 7, 6). This phrase describes the initial and immediate interaction between Na+ ions and the surface of CaCO3. The rise in salinity has resulted in a decrease in this correlation, primarily caused by the heightened electric charge difference force between Na+ and Cl−. This, in turn, leads to a reduction in the thickness of the EDL layer and subsequently decreases the quantity of Na+ molecules in the stern layer. Another contributing cause to the peak reduction in this picture is the development of ion bridges due to increased salinity. This phenomenon has been demonstrated in previous study55.
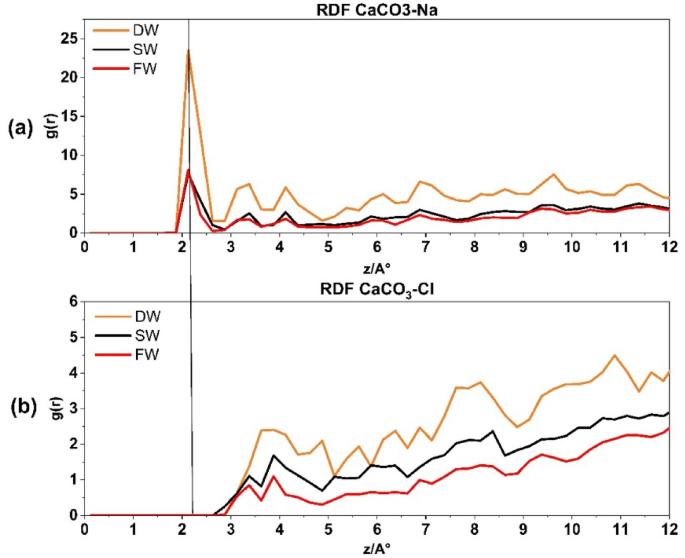
Radial distribution function for CaCO3–Na+ interaction (a) and CaCO3–Cl− interaction (b).
In contrast, Fig. 4b illustrates the correlation between Cl− atoms and the CaCO3 surface, with DW, SW, and FW. Notably, the first peak appears at a radius of 3.875 Å, indicating that the pairing with calcite commences at a distance of 1.75 Å from the Na+ ions (Stern layer). Due to the reasons stated previously, an increase in salinity has an inverse relationship with the number of Cl− molecules that tend to pair with calcite.
Figure 4 presents the RDFs of CaCO₃–Na+, CaCO₃–Cl− for different brine systems. This figure provides insights into the affinity of Na⁺, Cl⁻ions for interacting with the calcite surface in the simulated reservoir environment. As expected, Na⁺ ions, which are typically hydrated by water molecules, initially associate with oxygen atoms on the CaCO₃ surface. With increasing salinity, the number of Na⁺ ion pairs decreases, leading to a higher electrostatic force disparity between Na⁺ and Cl⁻ ions. Consequently, this results in a decrease in the thickness of the electrical double layer (EDL), as demonstrated in Fig. 2a–c by the rising density profiles and surface charge densities of Na⁺ lines and Cl⁻ lines across the three systems: DW (A), SW (B), and FW (C).
The presence of Na+ and Cl− ions arranged in a layered structure can be noticed on the surface of calcite in brines, as shown in Figs. 4 and 6. The Na+ RDF peak adjacent to calcite, within the first compact hydration layer indicates a solid-like form. This shows that the cation is strongly bound directly to the substrate without any water molecules in between. It is important to note that Na+ ions are more likely to be adsorbed onto the outermost oxygen of the calcite tissue. At the same time, water molecules are more likely to be adsorbed above the calcium of calcite rock. The AFM experiment conducted by Ricci et al.56 provides evidence for the preferential localization of Na+ cations on a calcite surface when in contact with an electrolyte solution. The presence of dangling oxygen of calcite atoms, specifically located above the calcium of calcite atoms in the calcite tissue, is responsible for the gap observed between the first peak of water molecules and the peak corresponding to Na+ ions near the calcite tissue as it is shown in Fig. 4a.
Figure 5 depicts the presence of Na+ and Cl− ions on the quartz surface. Figure 5a depicts the RDF of Na+ ions interacting with the quartz surface of the reservoir rock under different salinity conditions: DW, SW, and FW salinity. In the DW system, the first peak measurement at a radius of 3.875 Å yields a count of 8, suggesting a significant occurrence of Na-quartz rock pairings. As salinity increases, the affinity of Na+ to bond with quartz diminishes. However, Fig. 5b illustrates the bonding between Cl− ions and the quartz surface. This bonding is shown by the first peak at a radius of 3.375 Å, which corresponds to a value of 1.2. Conversely, the Na+ of Cl− ions exhibits no inclination to establish a connection with quartz rock at lower radii, but its concentration rises at larger radii. It is important to observe that as salinity increases, the propensity of Cl− to interact with SiO2 rock diminishes.
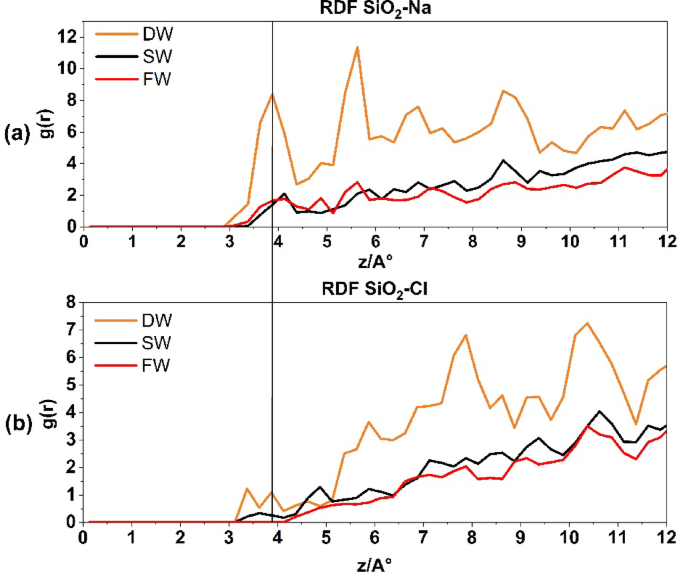
The radial distribution function for SiO2-Na+ interaction in above and SiO2-Cl− interaction at the down.
Figure 6a displays the RDF CaCO3–O water for all three states of the system. It indicates that as salinity increases, there is a higher likelihood of water oxygen linking with calcite rock (shown by the first peak at (:approx:) 2.37 Å in Fig. 6a), with a recorded value of (:approx:) 6.25. The direction of water molecules towards calcite rock is mostly influenced by the oxygen atoms in the water. As salinity increases, the quantity of ions in the porous medium also increases. This causes the EDL to become thinner, resulting in a greater amount of water oxygen molecules that are inclined to bond with calcite. in agreement with recent experimental and simulation results55.
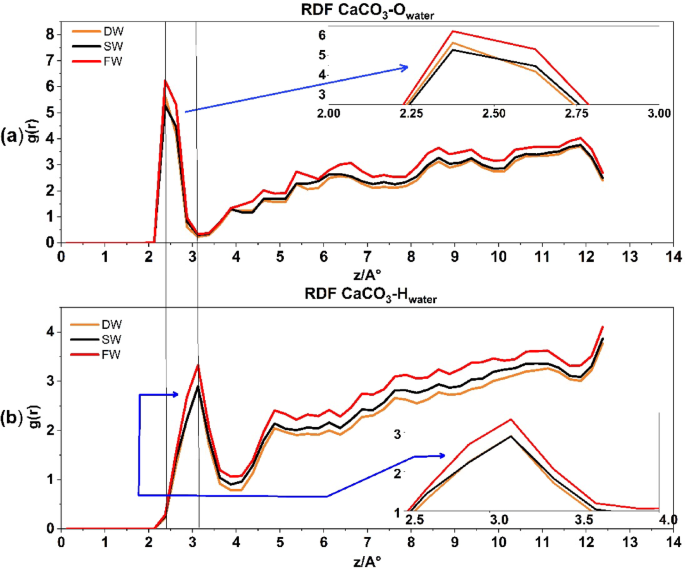
The radial distribution function for CaCO3–O water interaction in above and CaCO3–H water interaction at the down.
The RDF CaCO3–O–H of water in Fig. 6b show that the calcite surface is hydrated by a well-organized layer of water molecules. The density peaks at distances of (:approx:) 2.3 and 3.1 Å from the surface, which are marked by two horizontal black lines along Fig. 6. These consist of a highly condensed, solid-like layer of water that directly covers the calcite tissue, followed by a less dense and slightly less organized layer of hydration in all levels of salinity. In all salinities, the densities and thicknesses of these hydration layers are nearly identical. The monolayer of water directly above the calcite is almost solid, supporting the mineral’s continued wetness57. The X-ray reflectivity results published by Fenter et al.55 are consistent with the formation of two water mono-layers on a calcite surface. Furthermore, it was recently proven that calcite’s highly ordered crystal structure initiates the creation of these well-structured hydration layers58.
Figure 6b depicts the pairing between Hwater atoms and Cacalcite rock. The initial peak indicates a 50% decrease ((:text{g}left(text{r}right)approx:) 3.12) in the Hwater atoms pairing with Cacalcite rock compared to Owater atoms ((:text{g}left(text{r}right)approx:) 6.25) in Fig. 6a. Furthermore, it signifies that the peak of water Hwater atoms is present at a greater distance, i.e. 3.2 Å, which supports the findings of Ghatee and Koleini 2017 study59 and indicates that water is adsorbed to the outermost calcium atoms of calcite through the oxygen atoms.
Figure 7a represents the RDF of SiO2-Owater for three systems. The first peak, recorded at g(r) ≈ 1.5, is situated at a distance of ≈ 3.1 Å. The increase in salinity encourages atom pairing with quartz rock. However, Fig. 7b displays the RDF SiO2-H water, which produces the first peak at a greater distance, i.e. 3.3, suggesting the connection of quartz rock and water from the oxygen edge. Previous investigation36 support these findings.
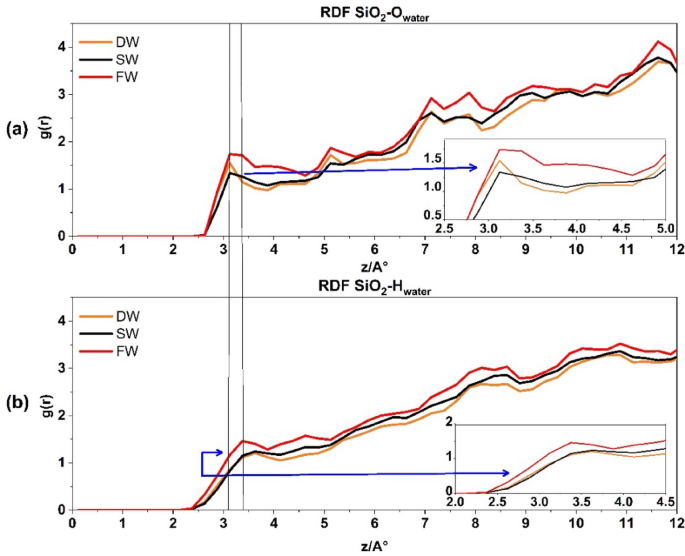
The radial distribution function for SiO2_Owater interaction in above (a) and SiO2_Hwater interaction at the down (b).
A distinct variation has been seen when comparing the interaction between water’s hydrogen and oxygen atoms in quartz and calcite. Water molecules (oxygen and hydrogen) exhibit a comparable process of pairing with quartz rock. Regarding the orientation of water molecules (oxygen and hydrogen), the orientation with quartz rock seems nearly identical. However, in contrast to calcite, quartz does not have a clearly defined peak at the beginning of the graph like calcite. This is a significant difference between the two rock composite tissues, which proves that there is no indication or propensity for a hydrated layer to form on the quartz surface. Conversely, Fig. 6 displays the calcite surface, which indicates the propensity to form hydration layers in all salinities.
In Fig. 8A, the RDF of CaCo3–Mg2+ in SW exhibits a strong inner-sphere peak at ≈ 2,8 Å (g(r) ≈ 4.8), followed by well‐defined second and third hydration‐shell peaks at ≈ 4 Å and ≈ 5 Å. This first‐shell distance and magnitude agree closely with MD reports of direct Mg²⁺ coordination to CaCo3 surface60. Under FW conditions RDF of CaCo3–Mg2+ the inner‐sphere peak shifts outward to ≈ 5 Å with markedly lower intensity (g(r) ≈ 1.5), indicating that elevated Ca²⁺ and Na⁺ concentrations compete for adsorption sites and promote Mg²⁺ outer‐sphere, water‐mediated binding60. In Fig. 8B, Mg²⁺ in RDF of SiO2–Mg2+ interacts far more weakly with quartz: the primary g(r) peak appears at ≈ 9 Å in SW and shifts slightly to ≈ 10 Å in FW, with peak heights of ~ 3.5 SW and ~ 2.2 FW, confirm that increased ionic strength in FW significantly screens electrostatic interactions, thereby reducing the affinity of Mg²⁺ for the hydrophilic SiO2 surface.
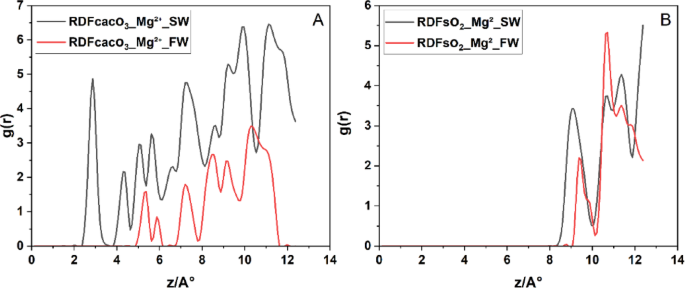
Radial distribution functions (g(r)) of Mg²⁺ relative to surface oxygen atoms on (A) calcite surface and (B) quartz surface under (SW, black) and (FW, red) systems.
Hence, in composite calcite–quartz systems, Mg²⁺ exhibits a salinity-dependent, ion‐specific adsorption behavior: under SW, Mg²⁺ preferentially forms inner‐sphere complexes at calcite’s specific binding sites, while on quartz it remains entirely in outer‐sphere hydration shells. However, in FW, elevated ionic strength and competitive adsorption by monovalent ions disrupt Mg²⁺ inner‐sphere coordination on calcite, shifting it into outer‐sphere configurations on both minerals. This dual influence of mineral heterogeneity and ionic competition critically shapes the electric double layer in carbonate reservoir rocks.
In Fig. 9A, the RDF of CaCo3–Ca2+, Ca²⁺ ions in SW exhibit a weak interaction with the surface, with the first RDF peak appearing at ~ 7.5 Å and an intensity of 0.2. In FW, this peak shifts to g(r) ≈ 9 Å and increases to g(r) ≈ 0.6. These low-intensity peaks in both cases suggest that Ca²⁺ does not strongly bind to the calcite surface, resulting in a relatively diffuse and unstable EDL, with limited impact on wettility alteration under both brine types. In contrast, near the quartz surface, Ca²⁺ shows a much stronger interaction. In sw, the first peak occurs at g(r) ≈ 7.5 Å with a high intensity of g(r) ≈ 1.75, suggesting strong adsorption onto the negatively charged quartz surface. In FW the peak shifts to a longer distance ~ 11 Å, indicating more distant accumulation. This behavior confirms that Ca²⁺ ions preferentially interact with quartz, especially under SW conditions.
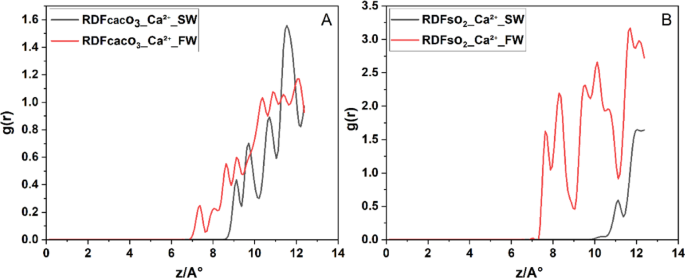
Radial distribution functions g(r) of Ca²⁺ relative to surface oxygens on (A) calcite and (B) quartz facets under (SW, black) and (FW, red) salinities.
From a practical standpoint, these findings indicate that in quartz-dominated rocks, the presence of divalent cations like Ca²⁺ (especially in FW) can lead to EDL disruption and stronger charge inversion, which may drive wettability alteration toward oil-wet conditions. These insights are crucial when designing low-salinity waterflooding strategies or interpreting ion-specific effects in carbonate reservoirs.
Figure 10 presents the RDF between the carbon atoms of the oil molecules and the oxygen atoms of the carbonate rock surface, evaluated at a cut-off radius of 12 Å from the rock. This analysis aimed to assess the adhesion behavior of oil molecules to the rock surface under three different brine conditions. The results reveal that increasing salinity leads to a greater number of oil molecules interacting with the carbonate surface, which is consistent with previous studie18,61 the DW system exhibited the fewest interactions with the rock from the beginning. This suggests that DW injecting in carbonate rock exhibits the highest and most persistent degree of surface hydrophilicity.
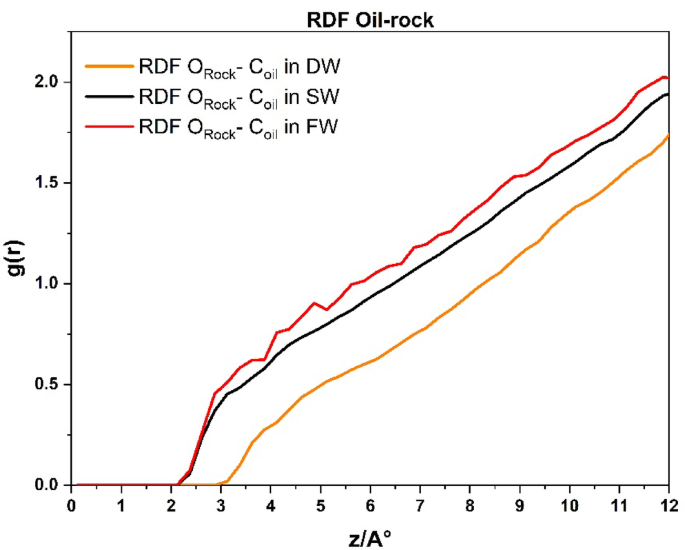
Radial distribution function plots between the carbon of the oil molecules and the oxygen of the carbonate reservoir rock in the cut-off radius of 12 Å for DW, SW, and FW systems.
MSD analysis in Fig. 11a was also used to check the movement of atoms during the simulation, which showed that Na + ions are the most mobile in the case of the SW system due to the most significant number of ions that interacted with the oxygen atoms of the rock surface at the beginning (approximately the first third) of the simulation. However, in the case of FW, due to the increase in the number of atoms in the porous medium, the movement of Na+ ions was reduced by half, which is due to the occupation of the oxygen atoms of the rock surface in a faster time frame and at the very beginning of the simulation, which is due to the increase in the number of sodium atoms. In the case of the DW system, its mobility was the least due to the stable distribution of the limited number of Na+ ions in the position of the oxygen atoms of the rock surface. Figure 11b, related to the MSD of Cl− ions, provides that in all systems, Cl− ions first show a small mobility, which is due to the adsorption of Cl− into the quartz tissue; then, after the occupation of Silicon of quartz atoms by Cl− ions, other Cl− ions begin to move more freely (approximately in three-quarters of the simulation interval). An increase in salinity leads to a decrease in the movement of Cl− ions because by interacting with each other, they create a mass of atoms of the same type, which play the role of a bridge between the oil and the reservoir rock, which, in turn, increases the adhesion of oil to the carbonate rock and reduces the EOR. The MSD diagram of the oil in Fig. 11c clearly shows that the decrease in salinity reduces the mobility of the oil and, as a result, reduces the adhesion of the oil to the carbonate rock surface and improves the EOR.
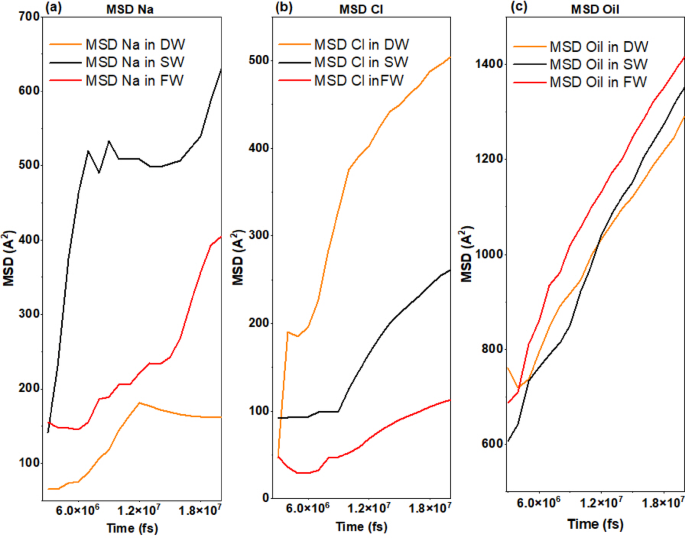
Mean Squared Displacement for each (a) Na + ions, (b) Cl- ions and (c) oil atoms for DW, SW, and FW systems.
Figure 12A, corresponding to the DW system, shows the upward migration of the oil phase away from the surface of the composite rock by the end of the simulation. This behavior is attributed to the disruption of ionic bridges between the oil and brine phases, which facilitates the detachment of oil from the rock surface and its movement toward production wells. Such detachment indicates a reduction in oil-wet, a condition favorable for EOR mechanism.
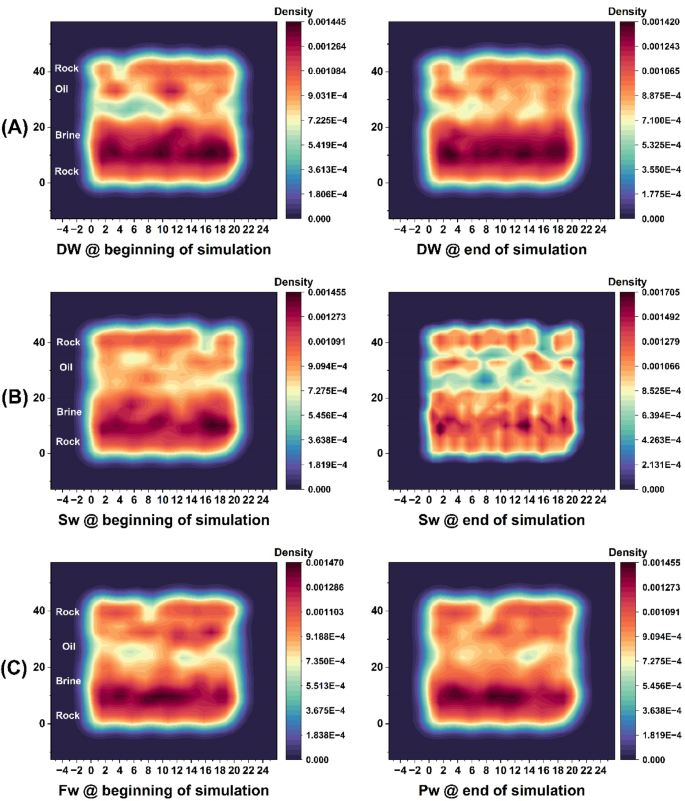
Two-dimensional density maps in the two-layer plane (ZY) for composite rock composed of calcite and quartz for three system states at the beginning of the simulation (left) and at the end of the simulation (right) from the production stage of the simulations.
Figure 12B shows the SW system, with the morphology of oil and brine clearly distinguished at the final simulation stage. Here, ion clusters—particularly divalent cations (Ca²⁺-Mg²⁺) form bridging structures that interconnect oil masses with the carbonate surface. These cation-mediated bridges promote oil adhesion to the rock, which is unfavorable for EOR mechanism.
Similarly, Fig. 12C depicts the FW system, where abundant divalent ions in the high-salinity brine create strong ionic bridges at the oil–rock interface. This results in enhanced adhesion of oil to the carbonate reservoir rock and reduced oil mobility. The dominant role of Ca²⁺ and Mg²⁺ ions in governing electrostatic interactions and wettability alteration is thus clearly demonstrated across the different brine compositions. To provide further clarification, the initial and final atomic configurations for all systems are presented in figure.S9 of the Supplementary Information.