Plant growth
A. thaliana seeds were plated on plates containing half-strength Murashige and Skoog (MS) basal salt mixture along with 10 g l−1 sucrose and stratified at 4 °C for 10 days to promote a high rate and synchrony of germination. Seedlings were then transplanted to soil (Metro-Mix 360 SC and Sunshine Mix #1, mix at 1:1, Sun Gro) in trays (21″ × 10.5″ × 2.5″, Thunder Acres; 40 seedlings per tray).
For apoplastic fluid collection, A. thaliana plants were grown in a growth chamber with 8 h/16 h day/night light cycles at a white light intensity of 125 µmol m−2 s−1. Plants were watered once a week. A. thaliana used for stomatal bioassays in response to red light were grown in a growth chamber with an 8 h/16 h day/night light cycle at a white light intensity of 300 µmol m−2 s−1 and 22 °C/20 °C day/night temperature cycles and relative humidity of 50–60%. Plants were watered twice a week. Fully expanded leaves from ~4-week-old plants were used.
V. faba plants were grown individually in pots (4″ × 4″ × 3.5″; Greenhouse Megastore) filled with soil (Metro-Mix 360, Sun Gro). For apoplastic fluid collection and red-light stomatal assays, V. faba plants were grown in a growth chamber with 8 h/16 h day/night light cycles at a white light intensity of 125 µmol m−2 s−1 and 22 °C/20 °C day/night temperature cycles. Plants were watered once a week. Fully expanded leaves from ~3-week-old plants were used.
Stomatal bioassays in response to red light
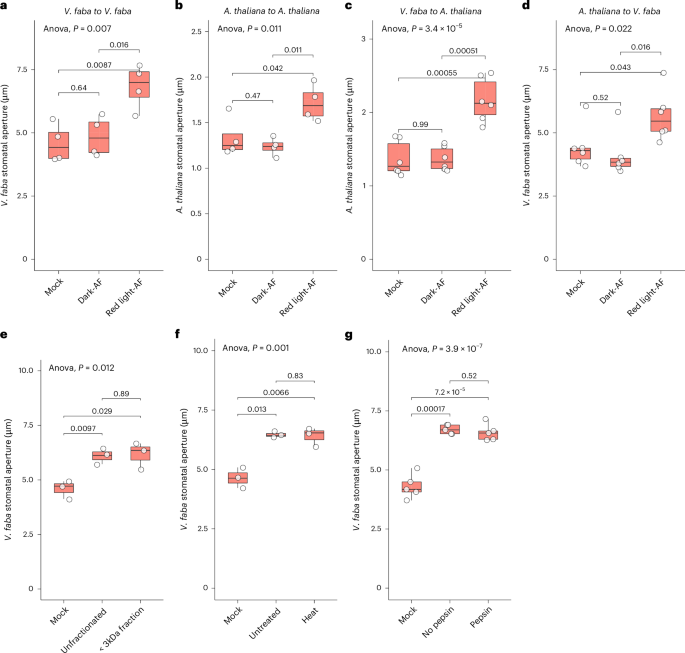
Leaves were excised before lights turned on in the chamber. Epidermal peels were prepared following the method of ref. 74. Epidermal peels were incubated in 5 mM KCl, 1 mM CaCl2 and 10 mM MES-KOH at pH 6.15 in the dark for 1.5–2 h to ensure stomatal closure. Then peels were transferred to a solution containing 5 mM KCl, 0.1 mM CaCl2 (as mock control) or tested sample (for example, red-light-induced apoplastic fluid or fractions from apoplastic fluid; Fig. 1 and Extended Data Fig. 1a).
For tests of selected metabolites, epidermal peels were transferred to a solution containing 5 mM KCl, 0.1 mM CaCl2, 10 mM MES-KOH at pH 6.15 as mock opening solution, apoplastic fluid obtained from plants treated with red light as control, or to the solutions containing metabolites being tested. The metabolites were dissoved at various concentrations in a buffer containing 5 mM KCl, 0.1 mM CaCl2 and 10 mM MES-KOH at pH 6.15.
Peels were placed under red light provided by an ABI LED red light bulb (JacobsParts) at an intensity of 125 μmol m−2 s−1. The emission spectrum of this red-light source is given in Extended Data Fig. 5. Stomata were imaged after 3 h red-light treatment or over the indicated time course (Extended Data Fig. 3c) by light microscopy (Nikon Diaphot 300 or Revolve ECHO Microscope, Model R4 with attached camera (Nikon E990)). Stomatal aperture measurements were performed using Fiji (ImageJ2 v.2.14.0; https://fiji.sc). Image acquisition and analysis were performed blinded. At least three independent biological replicates were performed for each treatment.
Metabolites that were tested were: fructose (Sigma-Aldrich, 57-48-7), malic acid (Sigma-Aldrich, 97-67-6), sorbose (Sigma-Aldrich, 87-79-6), threonic acid (Sigma-Aldrich, 7306-96-9), methyl indole acetate (Sigma-Aldrich, 1912-48-7), 5′-deoxy-5′methylthio-adenosine (Sigma-Aldrich, 2457-80-9), maleic acid (Sigma-Aldrich, 110-16-7), fructose, glucose and sucrose.
Gas exchange measurements were conducted using an LI-6800 portable gas-exchange system (LI-COR) on petiole-fed leaves of 5-week-old plants. Petioles were immersed in buffer solutions containing 0, 1 or 100 mM of either sucrose or mannitol, and excised in-solution to prevent embolism formation. Leaves were kept in the buffer with only the petioles submerged for 1 h in the dark to acclimate. Afterwards, they were clamped in the LI-6800 chamber with a 2 cm2 leaf chamber, CO2 concentration of 420 µmol mol−1, leaf temperature of 25 °C for V. faba and 22 °C for Arabidopsis, relative humidity maintained at 60% and a flow rate of 500 μmol s⁻¹. Following 30 min in the dark, leaves were exposed to 400 μmol m⁻² s⁻¹ of 100% red light (λ 620–750 nm) for 1 h. Stomatal conductance (gsw) was recorded every minute using the LI-COR autologging mode.
Apoplastic fluid preparation from A. thaliana and V. faba
Apoplastic fluids were prepared as previously described27, with modifications. Plants were placed under red light at an intensity of 125 μmol m−2 s−1 for 3 h. Meanwhile, another set of plants was placed in the dark for 3 h, from which the control apoplastic fluids were collected. Leaves were detached immediately after either dark or red-light treatment and briefly rinsed with deionized water. After immersing leaves in infiltration solution containing 5 mM KCl and 0.1 mM CaCl2, vacuum was applied for 75 s and then slowly released. Excess fluid on the infiltrated leaves was then removed using Kimwipes (Kimberly-Clark). Apoplastic fluids were collected from leaves by centrifugation for 10 min at room temperature using a speed setting of 3 (~1,400 rotations per minute (r.p.m.), corresponding to ~200 g) on an IEC clinical tabletop centrifuge (International Equipment) with #215 4-place central rotor. Previous research utilizing V. faba and other species confirmed that at g forces <1,000, there is negligible cytoplasmic contamination of the apoplastic fluid28. For A. thaliana, 700 g has been used to collect symplast-free extracellular vesicles29, and 1,000 g was recently reported to be appropriate for collection of apoplastic fluid from this species30, confirming the suitability of our protocol. Our yield of apoplastic fluid was ~0.4 ml g−1 A. thaliana leaves (fresh weight) and ~1.0 ml g−1 of V. faba leaves (fresh weight).
Ion content measurement
Ion contents of apoplastic fluids from V. faba incubated in darkness or under red light were measured using inductively coupled plasma-atomic emission spectrometry (XSERIES 2ICP-AES, Thermo Fisher) at the Laboratory for Isotopes and Metals in the Environment, Department of Geosciences at Pennsylvania State University.
Treatment of apoplastic fluid
To characterize the features of the effective components in apoplastic fluid that promote red-light-induced stomatal opening, heat and pepsin (Sigma-Aldrich, P6887) treatments were performed on red-light-treated apoplastic fluid samples from V. faba. Heat treatment consisted of heating samples at 95 °C in a water bath for 5 min. Pepsin digestion (final pepsin concentration 4 mg ml−1) was performed at 37 °C for 1 h. Treated apoplastic fluids were immediately used for stomatal responses to red light, with untreated apoplastic fluid as control.
Fractionation of apoplastic fluid using centrifugal filter, solid-phase extraction and HPLC
To separate apoplastic fluid samples into macromolecular and small-metabolite fractions, centrifugation using an Amicon Ultra filter (4 ml or 15 ml) with a 3-kD-cut-off membrane (EMD Millipore) was performed at 4 °C. Flow-through from the centrifugal filter contains small molecules (<3-kD fraction), whereas sample remaining above the filter membrane (>3 kD) contains macromolecules.
To further identify hydrophobicity of mesophyll messenger(s), HyperSep Retain PEP cartridge (Thermo Fisher) was used for fractionation. Briefly, the column was conditioned using methanol once, then deionized water twice. Red-light-induced apoplastic fluid (5 ml) from V. faba was then applied onto the column. Flow-through was collected. Methanol (5% methanol, 95% water) was used to wash the column and was collected. Then 25%, 50%, 75% and 100% methanol were applied onto the column and fractions (1 ml for each) were collected. All samples (original, flow-through, wash and all fractions) were lyophilised (Labconco). One ml of 5 mM KCl and 0.1 mM CaCl2 was used to reconstitute each sample for stomatal aperture assays.
Reverse-phase chromatography (RP-HPLC) uses water and organic solvent (for example, methanol) as the solvent system, and a column embedded with resins containing small hydrophobic groups, which efficiently separates analytes with varying degree of hydrophobicity. An UltiMate 3000 HPLC system (Thermo Fisher) was used to collect fine fractions of V. faba or A. thaliana apoplastic fluid. Lyophilised apoplastic fluid was first reconstituted with solvent A (0.1% trifluoride acid (TFA) in 10% methanol). Then 80 µl was injected and separated on a Gemini C18 column (particle size 5 µm, pore size 110 Å, 250 mm length, 4.6 mm diameter, Phenomenex) using a gradient with solvent B (0.1% TFA in 90% methanol) at a flow rate of 0.5 ml min−1. The HPLC gradient started at 100% A for 5 min, followed by ramping from 0% B to 30% B over 40 min, then ramping to 100% B over 5 min, holding at 100% B for 5 min, and then returning to 0% B and holding at 0% B for 5 min. HPLC fractions were collected, lyophilised and reconsititued using a solution containing 5 mM KCl and 0.1 mM CaCl2. Reconstitued fractions were then tested for enhancement of red-light-induced stomatal opening in V. faba epidermal peels as described above. Eluates between 6.5–9 min for A. thaliana apoplastic fluid and 6.5–10 min for V. faba apoplastic fluid were effective in promoting stomatal opening under red light (Extended Data Fig. 1d) and were thus collected for metabolomics analysis.
Metabolomics analysis of effective HPLC fractions of A. thaliana and V. faba apoplastic fluid
Effective HPLC fractions of red-light-induced A. thaliana and V. faba apoplastic fluids were prepared as above. Parallel fractions from dark-treated apoplastic fluids that eluted in the identical time windows were taken as controls. Five biological replicates of each sample (that is, dark-treated A. thaliana (AtD), red-light-treated A. thaliana (AtRL), dark-treated V. faba (VfD) and red-light-treated V. faba (VfRL)) fractions were analysed on three different metabolomics platforms: GC–MS (targeted, GCMS-TQ8040, Shimadzu) at the RIKEN Center for Sustainable Resource Science (Japan), GC–MS (untargeted, Pegasus IV GC–TOFMS, LECO) at the University of California Davis, and LC–MS (targeted, QTRAP4000, Sciex) at the University of Florida. The data are summarized in Supplementary Tables 2–4.
For targeted analysis on the GCMS-TQ8040, adonitol was first added to each sample as an internal standard, then all samples were lyophilised. Methoxamine reagent (MOX, 100 µl; Thermo Fisher) was then added to each lyophilised sample, followed by overnight incubation at 30 °C on a shaker (1,200 r.p.m.). Then, 50 µl of N-methyl-N-trimethylsilyltrifluoroacetamide plus 1% trimethylchlorosilane (Thermo Fisher) was added to each sample, followed by shaking at 1,200 r.p.m. at 37 °C for 30 min. After spin-down, the supernatant of each sample was transferred to a glass vial. One microlitre of each sample was then injected into a Shimadzu GCMS-TQ8040 with a temperature gradient: 60 °C for 2 min, ramping to 330 °C at 15 °C min−1, followed by 330 °C for 3 min.
For targeted analysis on the QTRAP4000, effective fractions were lyophilised, redissolved in 10% methanol (with lidocaine as internal standard) and vortexed for 15 min at room temperature. After centrifugation (4 °C, 13,000 g) for 15 min, supernatants were transferred to glass vials for HPLC–MRM–MS analysis. Samples were separated on an Eclipse XDB-C18 column (diameter 4.6 mm, length 250 mm, particle size 5 μm) with 0.1% formic acid in water as solvent A and 0.1% formic acid in acetonitrile as solvent B. The HPLC gradient started at 1% solvent B for 5 min, followed by ramping from 1% B to 99.5% B over 41.5 min, holding at 99.5% B for 4.5 min, and then returning to 1% B over 0.3 min and holding at 1% B for 8.7 min. The flow rate was 0.5 ml min−1. The mass spectrometer conditions were: 30 psi curtain gas, 50 psi GS1, 55 psi GS2, ion source voltage 4,500 V, with a TurboIon electrospray ionization interface temperature of 350 °C. Multiple reaction monitoring (MRM) transitions were distributed into different periods on the basis of the compounds’ retention time to increase the number of compounds detected in a single run75.
For untargeted analysis on the Pegasus IV GC–TOFMS, samples were derivatized as previously described76 and then injected (0.5 µl of each sample) into an Agilent 6890 gas chromatograph (Agilent). Separation was performed on an Rtx-5Sil MS column (length 30 m, internal diameter 0.25 mm, 0.25 µm film made of 95% dimethyl/5% diphenylpolysiloxane; Restek) with a 20-min temperature gradient: 50 °C for 1 min, ramping to 330 °C at 20 °C min−1, followed by 330 °C for 5 min. The transfer line temperature between the gas chromatograph and the mass spectrometer (Pegasus IV GC–TOFMS, LECO) was set to 230 °C. Mass spectra were acquired at a mass range of 80–500 Da (17 spectra per second, −70 eV ionization energy and 1,800 V detector voltage) with ion source at 250 °C. Data processing and metabolite identification were performed as previously described76.
Metabolomics data analysis
For analyses on targeted metabolomics platforms (QTRAP4000 and GCMS-TQ8040), metabolites were identified by paired mass/charge (m/z) ratios of the precursor ion and a selected product ion along with the chromatographic retention time, as acquired from analysis of authentic compounds (standards). For quantification of QTRAP4000 data, the peak area of each metabolite from each sample was first normalized to the internal standard. For quantification of GCMS-TQ8040 data, the peak area of each metabolite from each sample was first normalized by the LOWESS/Spline normalization algorithm with a pooled QC sample using MRMPROBS77. For analysis on the untargeted metabolomics platform (Pegasus IV GC–TOFMS), peak height was reported because peak heights are more precise for low-abundance metabolites than peak areas, due to the larger influence of baseline determinations on areas compared with peak heights78. Peak heights were log2 transformed for statistical analysis. Fold change was calculated using the average value of each group (dark and red light) and Student’s t-test was performed to assess the statistical significance of the difference between the two groups. Metabolites with a fold change >1.2 or <0.8 are defined as significantly changed metabolites between dark and red-light treatments. According to the Metabolomics Standards Initiative64,65, our targeted LC–MS analyses are at confidence ‘level 1’ identification based on fragmentation spectra from authentic standards. Our GCMS-TQ8040 and GC–TOFMS identifications are based on fragmentation pattern-matching against the Smart Metabolites Database V2 (Shimadzu, https://www.shimadzu.com/an/products/gas-chromatograph-mass-spectrometry/gc-ms-software/smart-metabolites-database/index.html) and in-house mass spectral libraries at the West Coast Metabolomics Center, respectively, and can thus be considered as ‘level 2’ identification.
Quantification of apoplastic sugar concentrations
Apoplastic fluid of V. fabia leaves was collected as previously described79 using indigo carmine (Thermo Scientific, 860-22-0) to calculate the dilution factor. Analysis of sugars in the apoplastic fluid was carried out using a GC–MS/MS system that consisted of a gas chromatograph Trace 1300 coupled with a triple-quadrupole mass spectrometer TSQ 9000 (Thermo Scientific). The sample was spiked with a mixture of internal standards (glucose-13C6, fructose-13C6, sorbitol-13C6), followed by evaporation with dry nitrogen and chemical derivatization, namely, conversion to oximes with hydroxylamine and afterwards, trimethylsilylation. The derivatized samples were separated on a BPX5 capillary column (30 m × 0.22 mm, 0.25 µm, SGE) using hydrogen as a carrier gas. The mass spectrometer was operated in positive electron impact ionization and SRM mode. Nitrogen (>99.999% purity) was used as a collision gas. Analytes were quantified against calibration curves of the internal standards of the corresponding carbohydrates. The acquisition was controlled using Xcalibur 4.0, and the data were analysed using TraceFinder software v.5.1 SP1 (Thermo Scientific).
Immunohistochemical analyses of guard-cell plasma membrane H+-ATPase phosphorylation status
Immunohistochemical analyses using Arabidopsis epidermal fragments were conducted as described previously with slight modifications47,80. A. thaliana Col-0 plants were grown as previously described49. Plants 4–6-weeks of age were used for the experiments. In brief, the epidermal fragments were kept in the basal buffer (5 mM MES-1,3-bis[tris(hydroxymethyl)methylamino] propane, 50 mM KCl and 0.1 mM CaCl2) and treated with sucrose or mannitol at the indicated concentration in the dark. The buffer pH was adjusted to 5.5 or 6.5 with bis-tris propane. The phosphorylation level of the guard-cell plasma membrane H+-ATPase was estimated as described previously49 using an antibody that recognizes phosphorylated H+-ATPase Thr-948, at a dilution of 1:1,000. Three or more experiments were performed, with at least 30 stomata analysed at each measured timepoint. The specimens were observed under a fluorescence microscope (BX50, Olympus) with a narrow excitation band-pass filter set: BP460–480HQ, BA495–540HQ (U-MGFPHQ, Olympus) for Alexa Fluor 488 using an Hg arc lamp as a source of excitation light. Fluorescence images were collected using a CCD camera system (DP72, Olympus) and processed using DP2-BSW software (Olympus). For estimation of fluorescence intensities, all images were taken at identical exposure times (334.79 ms).
Preparation of V. faba guard-cell protoplasts
V. faba guard-cell protoplasts were prepared largely as we previously described74. Briefly, per preparation, 5 healthy, young and fully expanded leaflets were excised into 2 cm × 0.5 cm pieces using a scalpel. Major veins were removed using a razor blade, and leaf pieces were then blended in cold distilled H2O with an Osterizer blender (Sunbeam) for 45 s to isolate epidermal fragments. Epidermal fragments were then collected by filtration on a 100-μm nylon mesh and washed thoroughly with distilled H2O to remove damaged mesophyll cells. Washed epidermal peels were incubated in 10 ml of Enzyme Solution 1 for 40 min under darkness at 29 °C, with shaking at 140 excursions per minute. Next, the osmolality of the solution was adjusted to 510 mOsmol kg−1 by adding 30 ml basic solution, followed by shaking for 5 additional minutes. After collecting the partially digested epidermal tissue on a 100-μm nylon mesh and washing with basic solution, the peels were treated with 10 ml of Enzyme Solution 2 for 1.5–2 h at 20 °C in darkness, with shaking at 40 excursions per minute. Once approximately half of the guard-cell protoplasts had started to round up, the epidermal fragments were collected on a 30-μm nylon mesh and washed gently with basic solution into 50 ml volume. The filtrate was centrifuged at 150 × g for 5 min and the small pellet of guard-cell protoplasts concentrated at the bottom was carefully preserved during removal of the supernatant. The pellet was washed again in 50 ml basic solution and re-centrifuged before collecting the purified guard-cell protoplasts in 3–5 ml final volume of solution. The protoplasts were kept on ice in darkness for 1 h to recover before electrophysiological recording.
The basic solution consisted of 0.45 M mannitol, 0.5 mM CaCl2, 0.5 mM MgCl2, 0.5 mM ascorbic acid, 10 µM KH2PO4 and 5 mM MES, pH 5.5 (adjusted with KOH). Enzyme Solution 1 was made in basic solution/water 55/45 (v/v) and contained 0.7% (w/v) Cellulysin cellulase Trichoderma viride (Thermo Fisher), 0.1% PVP40, 0.25% BSA (bovine serum albumin) and 0.5 mM ascorbic acid, pH 5.5 (KOH). Enzyme Solution 2 was made in 100% basic solution and contained 1.5% Onozuka Cellulase RS (Yakult), 0.03% Pectolyase Y-23 (Thermo Fisher), 0.25% BSA and 0.5 mM ascorbic acid, pH 5.5 (KOH).
Electrophysiology of V. faba guard-cell protoplasts and Xenopus oocytes
We followed a previously established protocol to record anion channel currents of V. faba guard-cell protoplasts81. A 100 μl aliquot of protoplasts was transferred into 1.9 ml of external control solution containing 30 mM CsCl, 1 mM CaCl2, 2 mM MgCl2 and 10 mM MES, pH 5.6 (adjusted with Tris base) at a final osmolality of 490 mOsmol kg−1 (adjusted with d-sorbitol). The pipette solution consisted of 150 mM CsCl, 5.864 mM CaCl2, 2 mM MgCl2, 6.7 mM EGTA, 10 mM HEPES and 2 mM Mg-ATP, pH 7.1 (adjusted with Tris-HCl) at a final osmolality of 510 mOsmol kg−1 (adjusted with d-sorbitol). This combination of divalent cations and EGTA yields 2 μM cytosolic free Ca2+. Recording electrodes made from capillary glass tubes (34500, Kimble) were pulled with two-stage puller PP-83 (Narishige) and fire polished with micro-forge MF-900 (Narishige) before coating with melted wax (Kerr). Such electrodes filled with the abovementioned pipette solution gave an average pipette resistance of 6–8 MOhms in the external control solution. A 1 M KCl agarose bridge was used to connect the bath to an Ag-AgCl ground wire placed in 1 M KCl solution. Liquid junction potential was corrected and the slow/fast capacitance transients were compensated by the functions of Axon pClamp software (Molecular Devices). Recordings were conducted using Multiclamp 700A amplifier (Axon Instruments). Data were sampled at 10 kHz and filtered at 1.4 kHz.
After the whole-cell configuration was formed, protoplasts were incubated for 5 min to equilibrate the cytosol with the pipette solution. The holding potential for recordings was 40 mV and 6-s voltage sweeps were applied from 80 mV to −160 mV at −40-mV intervals. The first voltage family, applied 5 min after achieving the whole-cell configuration, was designated as the initial condition (T0). Subsequent voltage family recordings (T1, T2.) were initiated 3 min after solution changes. The seal resistance of each protoplast was checked before and after every voltage-step protocol to confirm stability. Average values of steady-state currents for I–V curves were taken within the 10-ms interval just before the end of each voltage step. Data from each protoplast were normalized relative to current amplitude at −160 mV.
Xenopus oocyte recordings were performed as previously described82,83,84,85,86,87,88,89,90,91, with methodological details provided in Extended Data Fig. 4.
Statistics and data visualization
Statistical analyses and data visualization were performed using R statistical software (v.4.4.3; https://cran.r-project.org), with the packages ggplot2, dplyr and ggpubr.
Reporting summary
Further information on research design is available in the Nature Portfolio Reporting Summary linked to this article.