Study population
The study population for this analysis was prospectively recruited, as previously described [15]. In brief, the cohort consisted of 901 individuals with T2D but free of previous CVD and without any symptoms of CVD. Eligible individuals were identified using electronic health records and recruited via advertisements in local newspapers. Potential participants attended a screening visit at the Steno Diabetes Center Copenhagen, Zealand University Hospital, or Holbaek Hospital, Denmark. Participants were aged 40–85 years and had to be able to understand and provide informed consent. Participants between 40 and 50 years were required to have at least two cardiovascular risk factors in addition to T2D (current smoking, hypertension, dyslipidemia, or a family history of CVD). Exclusion criteria included a history of stroke, CAD, or other cardiovascular diseases; non-diabetic kidney disease; and contraindications for cardiac 82Rb PET/CT. Peripheral arterial disease was not considered an exclusion criterion. Depending on the site, participants either attended three separate visits for consent, cardiac 82Rb PET/CT, and transthoracic echocardiography, or completed both imaging procedures in a single visit after providing consent and clinical data locally [15].
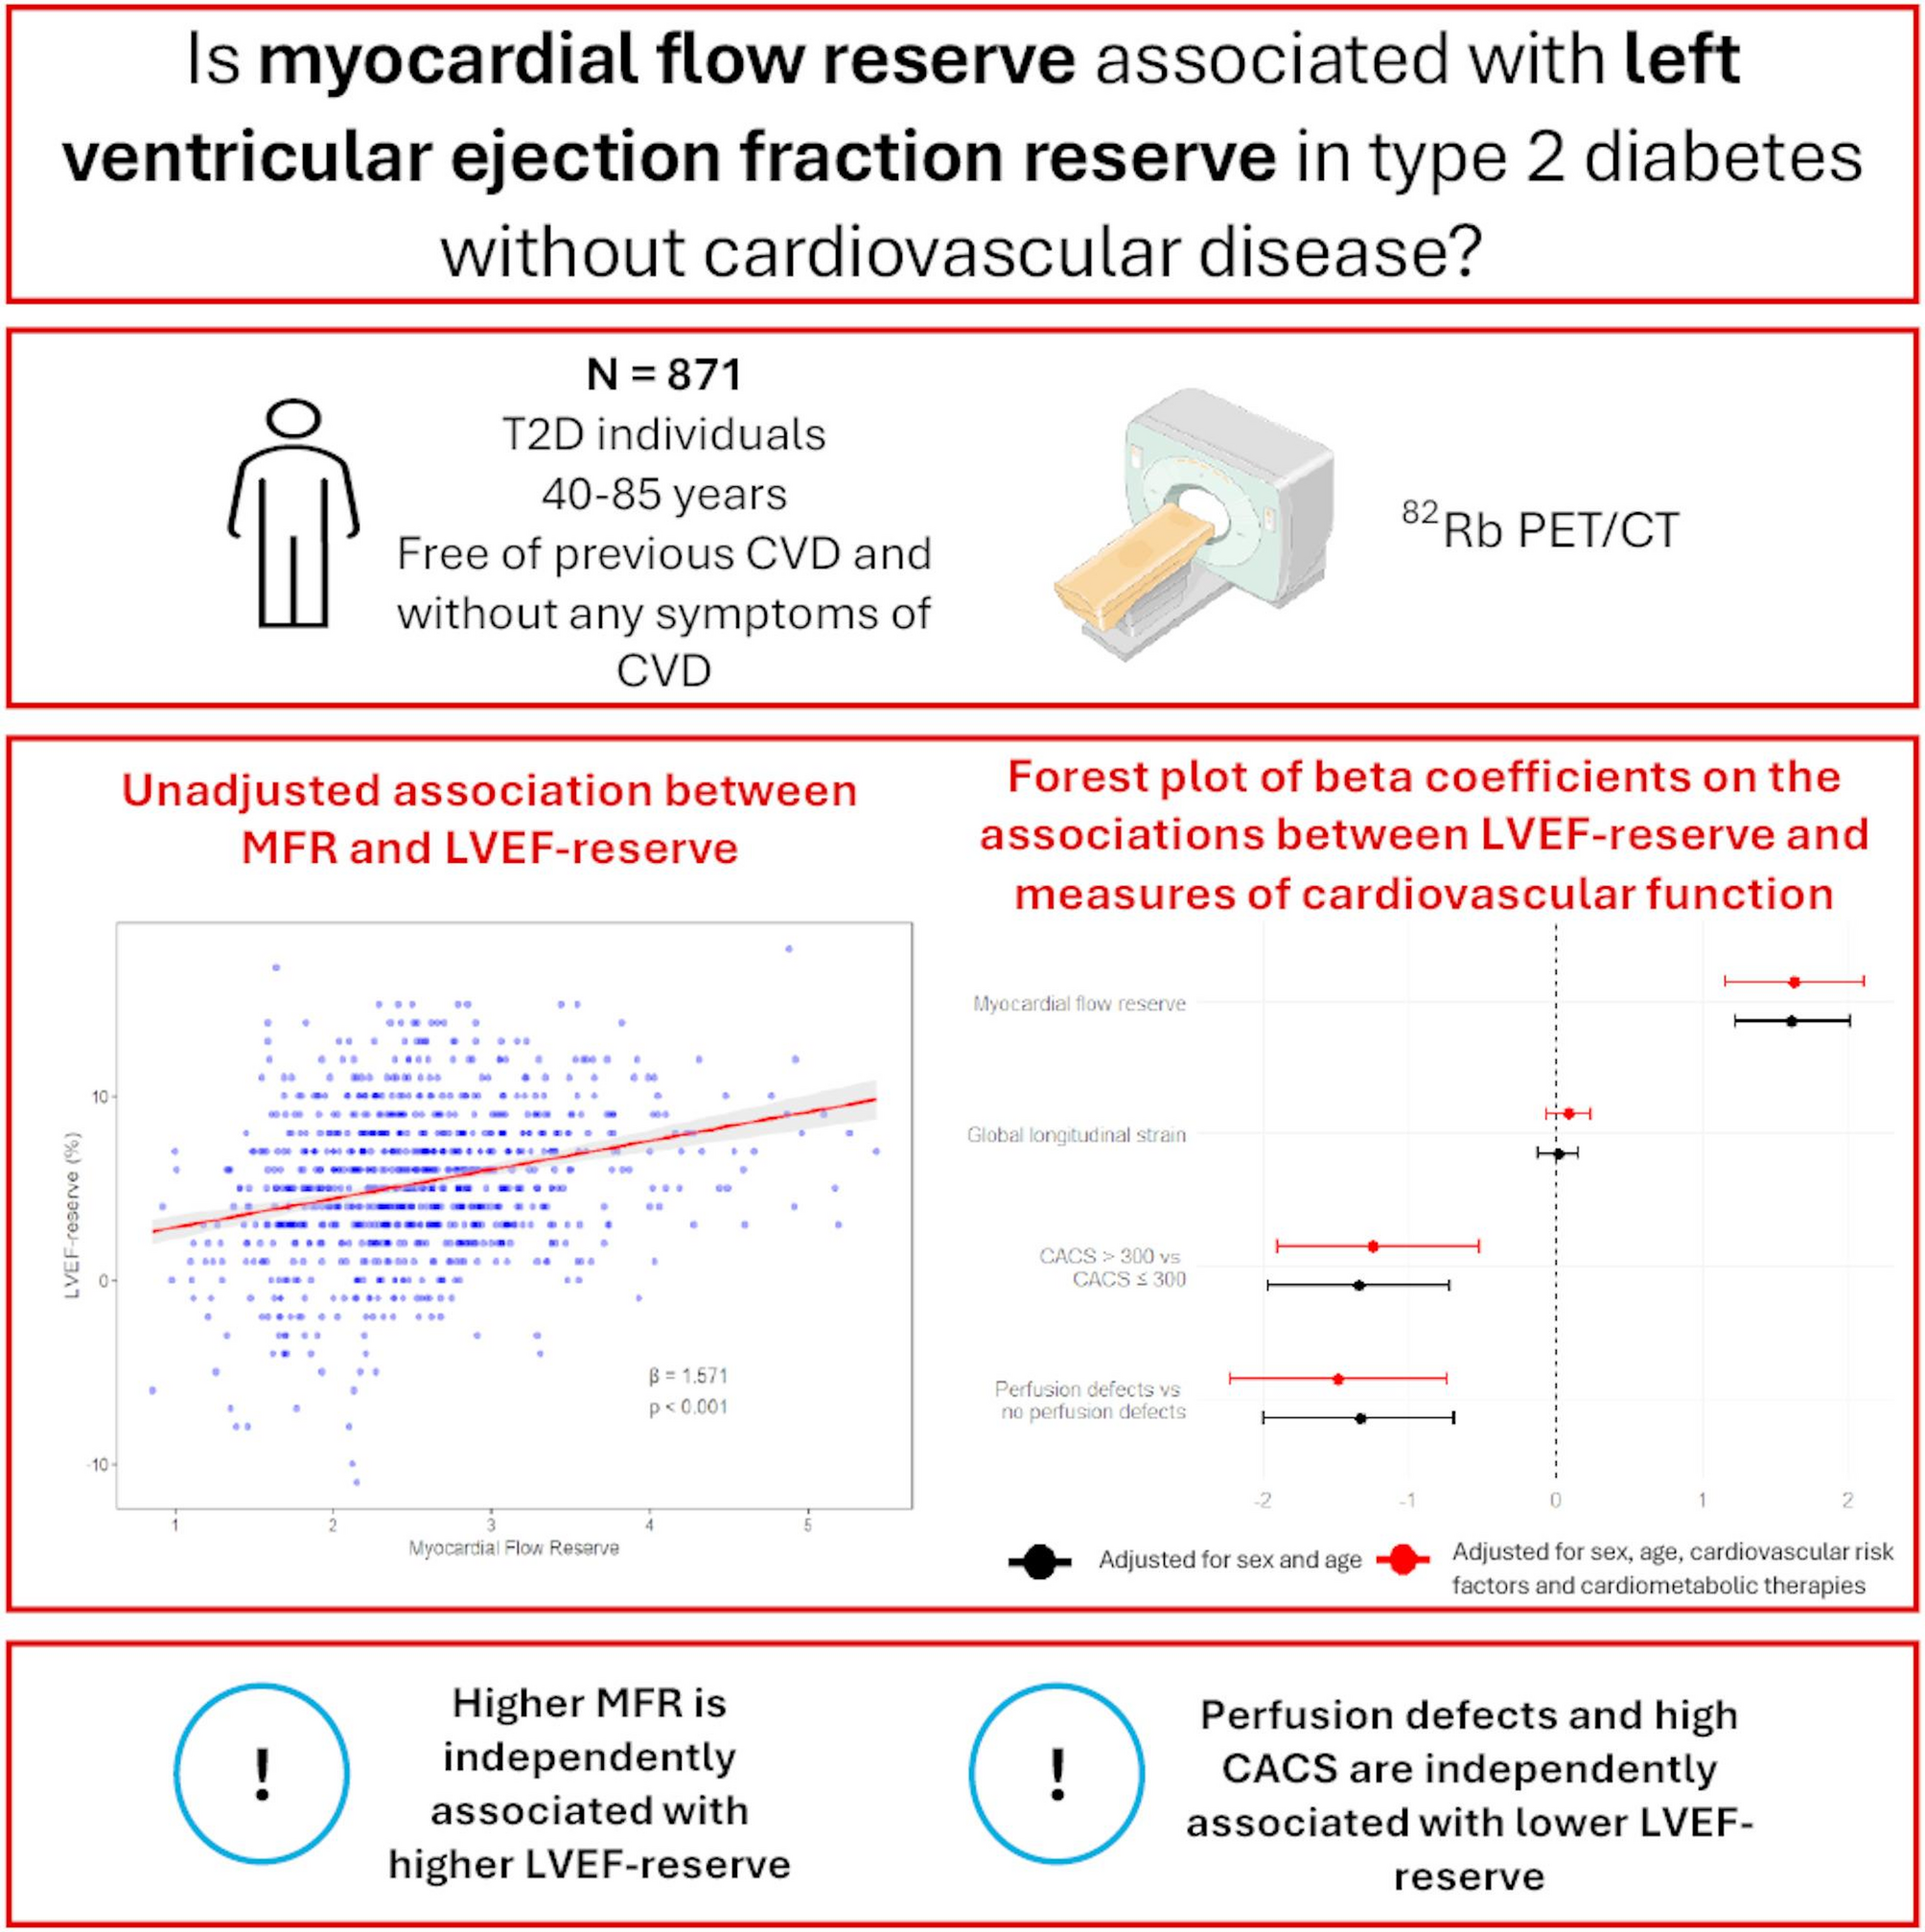
Thirty individuals were excluded due to suboptimal image quality for assessment of LVEF-reserve on the cardiac 82Rb PET/CT scan, resulting in a final sample of 871 subjects. The study was performed from January 2020 to August 2023 and conducted in accordance with the Declaration of Helsinki. All participants provided written consent, and the protocol was approved by the Danish National Committee on Health Research Ethics (H-19063311).
Demography and clinical characteristics
Information on demographics, medical history, and current medical treatment was collected through structured interviews and cross-referenced with electronic medical records. Current smoking was defined as the daily use of at least one cigarette, pipe, or cigar. Height and weight were measured to calculate body mass index (BMI). Lipid profile, HbA1c, and plasma creatinine, were measured using standardized procedures immediately after each participant’s visit.
The estimated glomerular filtration rate (eGFR) was calculated using the CKD-EPI equation [16]. The urine albumin-to-creatinine ratio (UACR) was assessed as the geometric mean of three consecutive morning urine samples analyzed via enzyme immunoassay. Albuminuria was classified as normal (UACR: < 30 mg/g), moderately increased (UACR: 30–300 mg/g) or severely increased (UACR > 300 mg/g). Office blood pressure was measured after five minutes of rest, with the mean of three readings recorded.
82Rb-PET/CT imaging
After administering 1,100 MBq of 82Rb, cardiac PET/CT imaging was obtained using a hybrid PET/CT scanner in 3D mode (Siemens Biograph mCT 128, Siemens, Munich, Germany). Scans were performed under both rest and stress conditions, with stress induced by adenosine infusion at 140 µg/kg/min for 6 min to achieve maximal myocardial hyperemia.
Myocardial blood flow was quantified using Siemens Syngo MBF 2.3 software (Siemens Medical Solutions, Malvern, PA, USA), employing a one-compartment tracer kinetic model for 82Rb and a non-linear extraction function developed by Lortie et al. [17]. The MFR, calculated as the ratio of stress to rest myocardial blood flow, was assessed globally across the myocardium. MFR is considered reduced when ≤ 2 [18].
Systolic LVEF was evaluated from ECG-gated PET data at both rest and stress, where gated images were acquired using 8-frame gating. The LVEF-reserve was calculated as the difference between stress and rest LVEF. CACS was evaluated using the method outlined by Agatston et al. [19], summing calcium scores within the three main coronary arteries, analyzed with Syngo.via software (Siemens Healthineers, Germany). CACS was categorized into two groups: >300 and ≤ 300, in accordance with established clinical guidelines [20].
Echocardiography
All echocardiographic examinations were conducted according to a standardized research protocol by trained investigators using the GE Vingmed Ultrasound Vivid IQ (Horten, Norway). Echocardiographic analyses were performed by experienced investigators blinded to study details, utilizing post-processing analysis software (EchoPac version 206).
Resting LVEF was assessed from the apical 4- and 2-chamber views using a semi-automatic tool that tracks myocardial deformation and volume changes throughout the cardiac cycle. GLS was measured using Automated Function Imaging, a novel semi-automatic speckle-tracking algorithm, incorporating apical 4-, 2-, and 3-chamber views for comprehensive strain analysis [21].
Statistical analysis
Continuous variables with a normal distribution are presented as the mean with standard deviation (SD), while those with a non-normal distribution are reported as the median with interquartile range (IQR). The normality of the data distributions was formally evaluated using quantile-quantile (Q-Q) plots and the Shapiro-Wilk test. Categorical variables are presented as frequencies and percentages and compared between tertiles of the LVEF-reserve using the Chi-squared test. Continuous variables were compared between tertiles using analysis of variance (ANOVA) for normally distributed data and the Kruskal-Wallis test for non-normally distributed data.
Associations between the LVEF-reserve and MFR, GLS, perfusion defects (reversible and irreversible), and CACS were evaluated using multiple linear regression models. Model 1 included sex and age, and Model 2 additionally included diabetes duration, BMI, LDL cholesterol, smoking, systolic blood pressure, HbA1c, eGFR, and UACR, based on established clinical confounders. Furthermore, given the potential influence of diabetes and cardiovascular medications on MFR and GLS, Model 2 also incorporated use of sodium-glucose cotransporter-2 inhibitors, glucagon-like peptide-1 receptor agonists, acetylsalicylic acid and antihypertensive agents, including renin-angiotensin-aldosterone system inhibitors and beta-blockers. The model fit was assessed through visual inspection of the residuals’ distribution, and variables that violated model assumptions were log-transformed prior to analysis.
For perfusion defects, participants with no reversible or irreversible perfusion defects (< 5%) served as the reference group in the regression analyses. Similarly, CACS was analyzed in the two groups (> and ≤ 300), with the latter serving as the reference group in the regression analyses.
Results for MFR and GLS are presented as unstandardized and standardized beta-coefficients (for direct comparison) with 95% confidence intervals (95% CI). Supplementary analyses were performed to assess possible effects of perfusion defects in the association between MFR and the LVEF-reserve.
Additionally, we performed Bonferroni correction to further adjust for multiple comparisons and reduce the risk of type I error when evaluating the significance of multiple remodeling parameters.
A two-sided P-value of < 0.05 was considered statistically significant. Statistical analyses were performed using the statistical software R (version 4.4.2, R Foundation for Statistical Computing, Vienna, Austria) within the RStudio environment (version 2024.12.0 + 467, Posit Software, PBC, Boston, MA, USA).