Near-field ptychography is a scanning phase-contrast imaging technique, which recovers the illumination and the sample transmission function from overlapping scan positions. Multi-slice reconstructions extend the capabilities of ptychography to the imaging of optically thick specimens. It was initially used in FFP27 and has recently been introduced for the near-field regime24. Multi-slice ptychography enables multiple layers of a 3D sample to be recovered.
The minimum thickness of layers distinguishable in multi-slice ptychography is described by the depth of field of the imaging system. In general, the depth of field (DOF) in ptychography is defined as:
$$begin{aligned} {DOF} = c cdot frac{delta _r^2}{lambda } end{aligned},$$
(1)
where (delta _r) is the lateral resolution, (lambda) the wavelength of the illumination, and c a constant reported to be between 1.0 and 5.228,29,30. Stockmar et al. defined (c:=1.0) for NFP28. Hu et al. define the depth resolution for near-field multi-slice ptychography based on raytracing as:
$$begin{aligned} {DOF} = frac{delta _r cdot (z_1+z_2)}{D} end{aligned},$$
(2)
where (z_1+z_2) is the propagation distance between the focus of the cone beam and the detector and D is the beam diameter on the detector24. For small angles, as generally valid for X-ray optics, one can rewrite Eq. (2) with the numerical aperture as (textit{NA}approx 0.5cdot D/(z_1+z_2)). Defining (NA) in terms of the Abbe criterion is identical to Eq. (1) with (c=1.0), so this again matches the definition by Stockmar et al.28. The achievable resolution in NFP is slice dependent since the pixel size of each slice depends on the individual focus-to-slice distance. Therefore, the DOF in NFP, as defined by Eqs. (1) and (2), is also slice dependent.
Although NFP is a lensless imaging technique that does not use an objective lens, the achievable depth resolution as described in Eq. (2) is directly related to the numerical aperture of the lens placed upstream of the sample. To achieve superior lateral and depth resolution, high-NA lenses should be used.
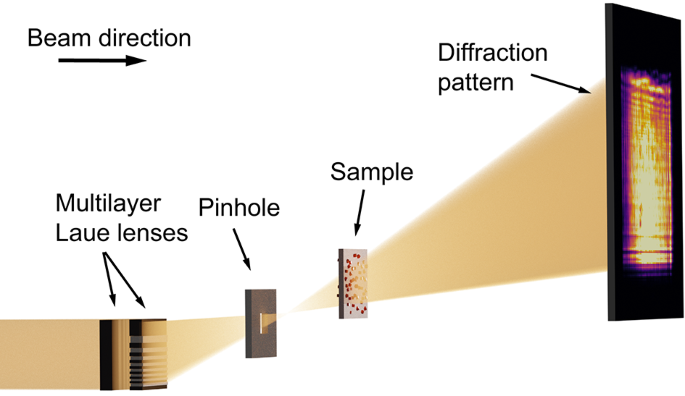
Many in-situ studies require bulky reaction environments. For this reason, a high penetration depth of the illuminating beam is required, which can be achieved by using hard X-rays. MLLs are the optics type with the highest NA in the hard X-ray range and were therefore utilized for this setup. In our experiment, we set the photon energy to (E =) 18 keV. A set of MLLs for horizontal and vertical focusing created a focal spot of 30 nm (times) 24 nm (see supplementary material Fig. S10). The MLLs were illuminated fully coherently for the in-situ series shown in Fig. 3. For the other measurements prefocusing compound reflective lenses located 54 m upstream of the MLLs were used. These reduced the spatial coherence length at the MLL position to 15 µm in the horizontal and 85 µm in the vertical direction and led to a partially coherent illumination. In near-field imaging, coherence over the first Fresnel zone width would be sufficient31 and the coherence length for all measurements is well above this limit. As shown schematically in Fig. 1, the focused beam was cleaned from other diffraction orders by a rectangular pinhole. The sample was positioned on a piezo scanner between 0.63 and 3.00 mm downstream of the focal plane and diffraction patterns were recorded at a distance of 3.29 m behind the sample by an Eiger X 4M in-vacuum detector. Further details of the setup can be found in the Methods.
The scans were reconstructed using the ePIE32 algorithm for the single-slice case and the 3PIE27 algorithm for the multi-slice case. In the reconstruction, the wavefield is propagated between the slices and between the sample and the detector using a Fresnel propagator. Details of the reconstruction parameters for each scan are tabulated in the supplementary material. In contrast to FFP, NFP is modeled with a cone beam geometry. For efficient image reconstruction, the cone beam must be converted to a parallel-beam geometry, which is done by applying the Fresnel scaling theorem33. The pixel size and the propagation distance of each slice are scaled accordingly. This step requires the knowledge of the distance between the focus and the sample, measured during the experiment. In this work, the focus-to-sample distance and the distances between slices were refined interactively by performing reconstructions with the aforementioned distances varied by (pm 10%) around the expected value. The values that produced a flat phase profile for the illumination and visually good results for the slices were chosen for the final reconstruction. The adjustments in the 3PIE algorithm can be found in the supplementary material. In our experiment, the divergent MLL-beam had a size of 11.3 mm (times) 12.6 mm on the detector, with a propagation distance of 3.29 m between sample and detector. Using Eq. (2), it is found that the depth resolution is (DOFapprox 275 cdot delta _r). At a source-size-limited lateral resolution of (delta _r=) 30 nm the achievable depth resolution with our setup is therefore (DOF=) 8 µm.
Schematic of the experimental setup. The X-ray beam is focused by a set of two MLLs to a focal spot of 30 nm (h) (times) 24 nm (v) (FWHM) in horizontal and vertical direction, respectively. A pinhole between the lenses and the focal spot acts as an order sorting aperture and cleans the beam. The sample is positioned at a distance between 0.63 mm and 3.00 mm downstream of the focus and scanned laterally across the beam. For each scan point, a diffraction pattern is recorded on a photon-counting detector at a distance of 3290 mm behind the sample. Image is not to scale.
Capabilities for ex-situ imaging
We first characterize our method by imaging cuprous oxide nanoparticles synthesized ex situ on both sides of a 225 µm-thick polyimide foil, as conceptually illustrated in Fig. 2a. Details of the image acquisition are described in the Methods—Scanning parameters section. The reconstructed illuminating beam (Fig. 2b) shows a relatively flat phase profile (indicated by the colors), as it is expected in near-field imaging without a diffuser10. The grid-like structure visible in the amplitude of the illumination (indicated by the brightness) is caused by the layered structure of the multilayer Laue lenses. Structure in the illumination is in general beneficial for a robust reconstruction in ptychography34,35 and even more important in NFP. For efficient phase retrieval, NFP relies on a structured illumination10,15. The structure is conventionally realized with a diffuser, such as sand paper, positioned in front of the lens. The use of MLLs, whose slight imperfections produce an inherently structured wavefield, made a diffuser unnecessary in our work.
For the multi-slice reconstruction, the polyimide foil is a model specimen with two distinct planes of cuprous oxide cubes on either side of the foil, slice 1 and slice 2, as shown in Fig. 2a. A conventional NFP reconstruction of the foil, treating the object as optically thin, is shown in Fig. 2c. The features on the upstream side of the foil are well resolved and sharp, while the cuprous oxide cubes on the back side appear blurred (see blue arrow in the figure). This indicates that the single-slice approximation for the object is not sufficient to model the thicker sample. To resolve both sides of the foil, beam propagation effects between the different layers must be taken into account. With multi-slice NFP, the individual slices can be sharply recovered. Slice 1 (Fig. 2e) shows the particles located on the upstream side of the foil and slice 2 (Fig. 2f) the nanocubes on the downstream side. The pixelwise sum of the two slices, shown in Fig. 2d, exhibits sharp edges for all features of both layers. Due to the cone-beam geometry, the effective pixel sizes are not the same for the two object slices. The pixel size for slice 1, which is closer to the focus, is 64.7nm and for slice 2 it is 69.8nm. To create the pixelwise slice sum in Fig. 2d as a parallel projection, we scaled the pixel size of slice 2 to match the pixel size of slice 1 using the scikit-image36 resize function.
Background fluctuations (brighter and darker areas without any sharp edges) are apparent in the reconstructions of the slices and cancel out in the sum of the two. These low-frequency image artifacts are often present in multi-slice ptychography30,37, typically caused by the short propagation distance between the slices. The maximum width between two points in one plane, for which interference effects can be observed after propagation over an effective distance (z_textrm{eff}), can be estimated by the first Fresnel zone radius (r_F)38:
$$begin{aligned} r_F=sqrt{lambda cdot z_textrm{eff}} end{aligned},$$
(3)
where (lambda) denotes the X-ray wavelength. This effectively limits the lowest spatial frequency that can be recovered for a given propagation distance.
In the multi-slice reconstructions, the scattering of the polyimide foil was neglected, and the wavefield propagated between the two slices. In reality, though, the polyimide foil introduces a phase shift. However, this effect is negligible at the used photon energy for a homogeneous foil of the given thickness. Applying Eq. (2) with a lateral resolution of (delta _r=) 102.6 nm, the DOF for this scan was equal to 27.5 µm while the reconstructed slices were separated by 225 µm, which is well above the DOF limit. Here, we demonstrated multi-slice NFP on an ex-situ model sample; in the next step we show its capabilities for in-situ imaging of chemical reactions.
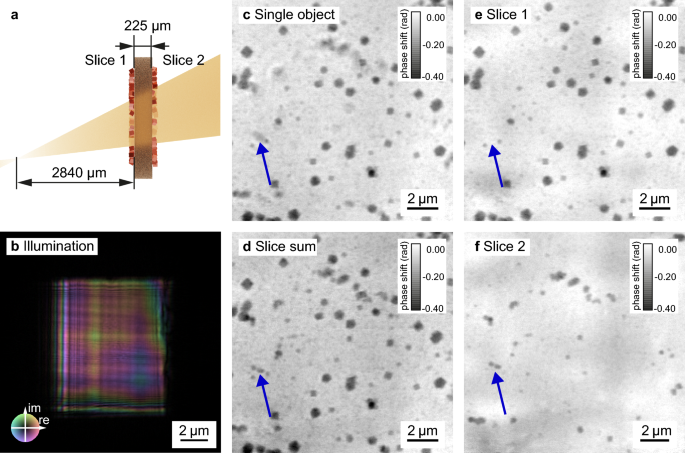
Near-field multi-slice ptychography of ex-situ cuprous oxide nanoparticles deposited on both sides of a polyimide foil. (a) schematic of the sample placed 2840 µm downstream of the focus of the X-ray beam with the two particle layers separated by a 225 µm-thick polyimide foil. (b) shows the corresponding reconstructed illumination with a size of 8.5 µm (times) 10 µm. (c) reconstruction of the scan assuming a single optically thin object. (d) summed phase of the multi-slice reconstruction shown in (e) first slice (upstream) and (f) second slice (downstream). The particles on the downstream side of the foil (slice 2) appear blurred in the single slice reconstruction (see e. g. the blue arrow), while they are well resolved in the reconstruction of the second slice and in the sum of the slices.
In-situ imaging of the galvanic replacement reaction of cuprous oxide nanocubes with gold
The galvanic replacement reaction of cuprous oxide nanocubes with gold acts as a model reaction for in-situ multi-slice NFP. We mounted our reaction cell for in-situ imaging of nanoparticle growth39 at a distance of 3.0 mm behind the focal plane. The polyimide foil with the cuprous oxide cubes is placed on the upstream side of the reaction container. The downstream window is an empty polyimide foil, which is separated by 1 mm from the upstream window using a PTFE-frame between them. The resulting reaction container is enclosed in a metal casing (for photographs of the cell see supplementary material Fig. S5). The reaction solution containing the gold precursor is injected between the two polyimide windows. The pre-synthesized cuprous oxide nanocubes are attached to a polyimide foil and, over the course of the reaction, the cuprous oxide is replaced by gold, as schematically shown in Fig. 3a,b. The reaction conditions are described in the Methods—Synthesis procedure and details can be found in Grote et al.39.
The in-situ series of the galvanic replacement reaction of (hbox {Cu}_2 hbox {O}) with Au was measured over 4.2h. A single ptychographic scan spanned a field of view of 10 µm (times) 10 µm and required a total scan time of 9.6 min. The reconstruction parameters can be found in the supplementary material Table S2.
For this in-situ series, the DOF was 21 µm and the two reconstructed slices were separated by 1 mm. Scattering by the reaction solution was neglected and the distance between the two windows was modeled with a free-space propagator. In the post-processing step, a high-pass filter was applied to the reconstructed phase images of the upstream window to reduce low-frequency artifacts. We used the scikit-image36 Butterworth filter with a cutoff frequency ratio of 0.018.
At the beginning of the reaction at 0.0 h (Fig. 3c), the upstream polyimide foil was covered with (hbox {Cu}_2 hbox {O}) cubes with an edge length of 150 nm to 250 nm (see Supplementary Fig. S7). The reaction solution containing the gold precursor (20 mM (hbox {HAuCl}_4)) was slowly injected into the cell with a syringe pump. In the first phase of the reaction, Au particles formed on the surface of the nanocubes. In the second phase, the Au particles grew larger and fused together, (hbox {Cu}_2 hbox{O}) was further oxidized and dissolved, and the cubes became less dense in their centers. The final stage of the reaction was the formation of hollow Au nanocages, similar like observed in our FFP experiments reported previously.39
Between 0.0 h and 2.8 h (Fig. 3c–f), a growth of the particles could be observed. A beam dump between 3.0 h and 3.8 h after the start of the reaction did not allow data acquisition during this period. In the first scan after the beam dump (at 3.8 h, Fig. 3g), the particles appeared hollow and in the subsequent scans the hollow structures seemed to connect. The growth in the first phase can be attributed to Au particles forming on the (hbox {Cu}_2 hbox {O}) surface. The galvanic replacement reaction progressed during the beam dump and at 3.8 h after the start of the reaction the hollow cages resembled the expected final result. The later Au deposition (Fig. 3h) can be attributed to beam damage. This is also evidenced by Au deposition on the downstream window of the reaction container (see Fig. S8 in the supplementary material), which is not the case in comparable ex-situ laboratory experiments.
For this in-situ series, the spatial resolution determined by Fourier-ring correlation was between 88 nm and 129 nm (see supplementary material Fig. S2), which is comparable to the spatial resolution achieved in a similar experiment with FFP39. The average dose per projection was 0.36 MGy with a dose rate of 1.28 kGy/s, which corresponds to a reduction in dose by a factor of 2.5 for a given field of view and a reduction of the dose rate by more than two orders of magnitude compared to the FFP results. The dose and dose rate were calculated according to the procedure reported by Grote et al.39. The significantly reduced dose rate is a result of the large illumination. However, the cumulative dose is comparable and, therefore, so is the spatial resolution.
The growth and formation of the hollow cages was clearly observed. This study demonstrates the competitiveness of NFP for in-situ imaging with reduced dose rate and improved temporal resolution while maintaining high spatial resolution. NFP is an excellent method for radiation sensitive samples. However, beam damage is a complex process with many experimental parameters to consider, such as beam size, photon energy and more. Björling et al. describe comprehensively the interplay between experimental parameters and free-radical formation in aqueous solutions17.
The spatial resolution of the scans was between 129 nm for the early scans, without significant beam damage, and 88 nm for the later scans, with significant beam damage, where we observe additionally to galvanic replacement a deposition of gold in the exposed areas of the sample. The increased size and thickness of the gold particles leads to an increased phase shift and thus an increased X-ray optical contrast, thereby improving the spatial resolution of the reconstructions of later scans. The resolution of all scans was close to or below the size of two pixels. Therefore, they can be described as pixel size limited when the resolution is considered in terms of the Nyquist-Shannon limit. In future experiments, the use of a detector with a smaller pixel size could improve the spatial resolution for similar temporal resolution and dose. Alternatively, an improved resolution could potentially be achieved by reducing the demagnified pixel size using a two-stage Fresnel propagator as described by Witte et al.40.
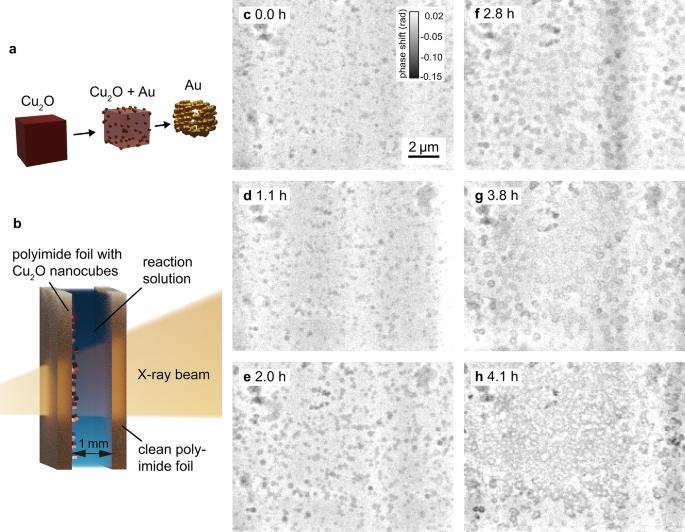
In-situ near-field multislicing ptychography of cuprous oxide nanocubes undergoing a galvanic replacement reaction. (a) Schematic of the galvanic replacement reaction. Gold particles form on the surface of the cuprous oxide cubes, (hbox {Cu}^{2+}) dissolves over the course of the reaction and hollow gold nanocages form (adapted from39). (b) Schematic of the reaction container. A polyimide foil with pre-synthesized cuprous oxide and a clean foil encapsulate the reaction solution with the gold precursor. (c)–(h) In-situ galvanic replacement reaction over 4.2 h. Multi-slice near-field reconstructions of the upstream window (phase shift).
In-situ imaging at highest spatial resolution
In a second in-situ series of the same reaction, our aim was to achieve imaging with an even higher spatial resolution. The reaction cell was moved to a position 630 µm downstream of the focal plane of the MLLs. By moving the sample closer to the focal plane, the magnification was increased by a factor of 4.75 to (M=5223) and the pixel size in the first slice was reduced by the same factor to 14.4 nm. The reaction was running for 1.0 h when the scan shown in Fig. 4 was recorded. The distance between the upstream and downstream window was 1.2 mm, slightly larger than in the previous experiment. However, this is within the assembly tolerances of the reaction container.
Figure 4b shows a single-slice reconstruction, where the sample was treated as a single, optically thin object. A big inclusion in the polyimide foil is clearly visible in the background in the lower left corner. The polyimide foils often contain inclusions from additives used as slipping agents in the production process41,42 (see supplementary material Fig. S6), which compromise the reconstruction of the layer of interest containing the nanoparticles.
To optimize the resolution of the plane of interest and to remove any inclusions obscuring the view on the nanoparticles, we recovered four distinct slices (Fig. 4c–f) in a multi-slice reconstruction (see Table S2 in the supplementary material for specific reconstruction parameters). The two slices of the upstream window of the reaction cell (slice 1 and slice 2) are separated by 125 µm. The exit window is located 1200 µm downstream of the second slice and divided into two slices separated by 62.5 µm.
A distance of 630 µm between focal plane and sample may seem small to consider this measurement in the near-field imaging regime. The effective Fresnel number F for this scan is given by Eq. (4)10:
$$begin{aligned} F=frac{W^2}{lambda z_textrm{eff}}=126.5 end{aligned}$$
(4)
with the extent of the illumination (W^2={2.2},upmu textrm{m}times {2.5},upmu textrm{m}), the wavelength (lambda =) 0.69 Å and the effective propagation distance (z_textrm{eff}=) 630 µm. Even though the effective Fresnel number for this measurement is considerably larger than unity, the scan can still be reconstructed with a far-field propagator between the last slice and the detector. However, the slice separation achieved with the near-field multi-slice reconstruction is superior to that of the far-field reconstruction (see supplementary material Fig. S4). The contribution from other slices remaining in the plane of interest is significantly smaller, showing that the Fresnel approximation models the measurement more accurately in this case. The plane with the nanoparticles (slice 2, Fig. 4d) shows only a weak shadow of the large inclusion from slice 1 compared to the single slice reconstruction. In order to correctly evaluate the reaction process, it is of great importance to obtain an undisturbed, quantitative image of the plane of interest, which we have achieved here in the multi-slice reconstruction. The large inclusions in slices 1, 3, and 4 are surrounded by a halo. This is a well-known artifact for strongly phase-shifting features in phase-contrast imaging43,44,45,46, resulting from the small modulation transfer of the low spatial frequencies.
The spatial resolution for slice 2, determined with Fourier ring correlation47,48, is 30 nm. This is close to the theoretical limit given by the focal spot size of the MLLs and below the resolution limit of two times the pixel size, given by the Nyquist criterion. The reconstruction can therefore be described as pixel size limited. The resolution for the other slices was 48 nm for the first slice, 84 nm for the third slice, and 130 nm for the fourth slice. The resolution of slice 1 is lower than slice 2 despite a smaller pixel size. This can be explained by a sparse sample plane for slice 1 with more than half of the scan points containing only little structural diversity and, hence, being more challenging to reconstruct. Details of the Fourier ring correlation analysis can be found in the supplementary material Fig. S3. For these spatial resolutions the slice thicknesses are all greater than the depth of field limit given by Eq. (2) (slice 1: 13 µm, slice 2: 8 µm, slice 3: 23 µm). Nevertheless, the separation of slice 3 and 4 does not appear to be perfect. The dark particle in the center of slice 3 appears as a white shadow in slice 4. The slice thickness seems to be close to the practical reconstruction limit. Hu et al. already describe that the actual thickness of the slices in X-ray NFP often has to be significantly larger than the theoretical limit given by Eq. (2)24. However, applying Eq. (1) with the constant (c=1) seems to overestimate the limit for slice separation ((DOF=) 102.6 µm).
We found that in the case of hard X-ray NFP, the experiment geometry must be well known at the time of measurement, to a much better degree than in the case of FFP experiments. The reconstruction is very sensitive to inaccuracies in defocus and interslice distance, as these have a strong impact on the effective Fresnel number.
In the scans following the one shown in Fig. 2, beam damage overshadows the reaction progress (see supplementary material Fig. S9). Again, in-situ imaging is a balancing act between spatial resolution and tolerable beam damage. Nevertheless, we have shown that NFP is competitive with FFP. Multi-slice NFP extends the capabilities of the method to the imaging of optically thick specimens, making it attractive for in-situ imaging.
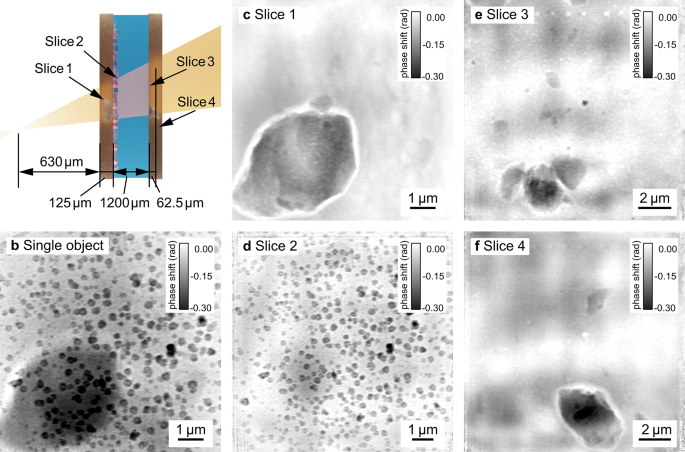
Imaging of nanoparticles growing in solution. (a) shows a schematic longitudinal cross-section of the chemical reactor with four distinct object planes (slices) in the direction of the X-ray beam. (b) A conventional single-slice reconstruction of the chemical reactor with nanoparticles. Applying the multi-slice approach allows to isolate four object planes corresponding to: (c) the upstream reactor’s window, (d) the inner side of the upstream window with nanoparticles, (e) the inner side of the downstream reactor’s window, and (f) the outer side of the downstream reactor’s window. (c), (e), and (f) show inclusions present in polyimide foils that otherwise obscure the view on the nanoparticles.