Clinical data collection
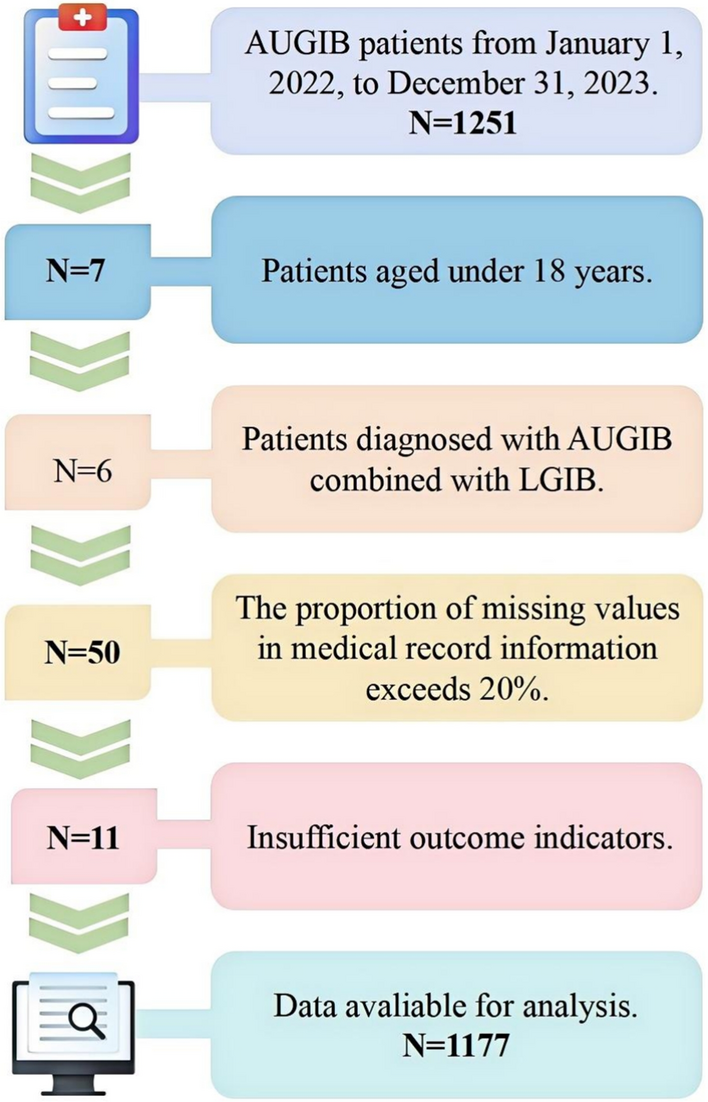
This study is a single-center retrospective observational cohort study approved by the Ethics Review Committee of the First Hospital of Shanxi Medical University and adheres strictly to the ethical principles outlined in the Declaration of Helsinki [12]. This study collected data from the electronic medical records of 1251 patients who presented to the emergency department with AUGIB between January 2022 and December 2023. After screening, 1177 patients were included in the final analysis. For external validation, 209 patients meeting identical criteria were sourced from Fenyang Hospital, Shanxi Province, from January 2022 to December 2023. The inclusion criteria were as follows- patients aged 18 years or older, a diagnosis of AUGIB confirmed by endoscopy or characteristic clinical manifestations (such as hematemesis, melena, or coffee-ground emesis), and provision of informed consent. Patients were excluded if they were under 18 years of age, had concurrent lower gastrointestinal bleeding (LGIB), lacked outcome indicators, or had more than 20% missing data for key variables. The complete case screening process is illustrated in Fig. 1.
Flowchart of data preprocessing and MTL architecture
The original data set included 67 clinical features categorized into four groups. The first group includes patient demographic information, such as gender, age, comorbidities (e.g., hypertension, liver cirrhosis), and medication history (e.g., anticoagulants, non-steroidal anti-inflammatory drugs). The second group includes vital signs upon admission, such as systolic blood pressure, pulse, shock index, and Glasgow Coma Scale score. The third group comprises emergency laboratory indicators, such as Hb, coagulation markers (INR, APTT), and liver and kidney function markers (e.g., AST, creatinine), all recorded at the time of the first result before transfusion. The fourth group includes time-related parameters, such as the time from hospital arrival to intravenous access establishment and blood collection. Non-structured text data, such as emergency records, were extracted using natural language processing techniques to capture key diagnostic information. The outcome variables included whether blood transfusion was administered (a binary variable, with the transfusion group accounting for 40.4% of cases) and the infusion volumes of PRBC (units), FFP (mL), platelets (PLT; units), and cryoprecipitate (Cryo; units).
Data preprocessing
Categorical variables were processed using One-Hot Encoding to convert them into numerical vectors. For example, gender was coded as 1 for male and 0 for female, disease presence as 1 for having a disease, 0 for not having a disease, and drug use as 1 for using a drug and 0 for not using a drug. Missing values were handled using a multimodal imputation strategy for mixed data types. For categorical variables, such as drug use, Multivariate Imputation by Chained Equations (MICE) with multiple logistic regression was applied to maintain logical consistency between categories, ensuring that the imputed values reflected clinical medication patterns [29]. For integer variables, such as pulse (P) and respiratory rate (R), median imputation was used to minimize bias. For continuous laboratory indicators, such as Hb and prothrombin time (PT), random forest regression imputation was employed to capture nonlinear relationships between variables while preserving the original data distribution.
To address the class imbalance between the transfusion group (n = 475, 40.4%) and the non-transfusion group (n = 702, 59.6%), Synthetic Minority Over-sampling Technique (SMOTE) was applied to the training set to balance the sample distribution. A hard threshold constraint was imposed to ensure the predicted transfusion volume for non-transfusion samples was zero, adhering to clinical physiological constraints [28]. Additionally, to correct the right-skewed distribution of transfusion volume variables such as PRBC and FFP, log1p transformation was applied, followed by Min-Max normalization, to retain data variation while improving model convergence efficiency [30]. All data preprocessing operations were implemented using Python 3.8 (scikit-learn 1.3.2). To support reproducibility and further research, we have also made the code publicly available at https://github.com/glchen777/AUGIB-tranfusion.git.
Statistical analysis
Categorical data are presented as counts and percentages, and differences between groups are evaluated using the (chi )-square test or Fisher’s exact test. Depending on the data distribution, continuous data are expressed as means with standard deviations (SDs) or medians with interquartile ranges (IQRs), and group differences were analyzed using analysis of variance or the Mann–Whitney U test. All statistical tests were considered statistically significant at (p < 0.05).
Model construction
This study proposes a hierarchical ensemble model based on MTL that simultaneously addresses the classification task of determining whether a transfusion is needed and the regression task of predicting transfusion volume. The model incorporates hierarchical feature selection and task-level collaborative optimization to mirror clinical decision-making. By applying a structured feature selection strategy, the model enhances interpretability, and through a hybrid ensemble architecture, it improves predictive robustness. The methodological innovations focus on three key components, which include hierarchical feature selection, hierarchical ensemble learning, and multi-task collaborative optimization. See Fig. 2 for details.
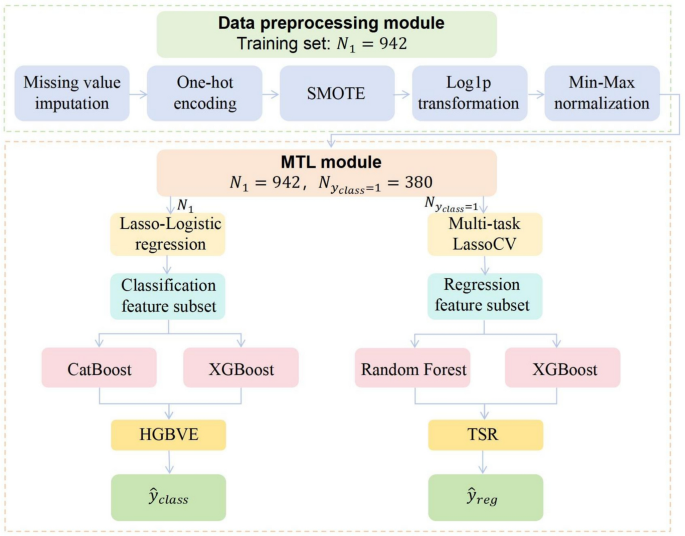
Flowchart of data preprocessing and MTL architecture
To enhance model interpretability and mitigate the curse of dimensionality, MTL employs a two-stage hierarchical feature selection strategy. For the classification task, (L_{1})-regularized logistic regression (Lasso-Logistic) is applied to construct a sparse classifier [31], with feature space compression controlled by the penalty factor (lambda ). Feature subsets are automatically selected using SelectFromModel. For the regression task, joint feature selection is performed on the classification-positive subgroup using Multi-Task Lasso Cross-Validation (MultiTaskLassoCV). The optimization objective minimizes
$$begin{aligned} min limits _{W} frac{1}{2N}Vert Y-XWVert _{F}+alpha Vert WVert _{2,1}, end{aligned}$$
where
$$begin{aligned} Vert WVert _{2,1}=sum limits _{i=1}^{p}sqrt{sum limits _{j=1}^{T}omega _{ij}^{2}} end{aligned}$$
induces cross-task feature sharing, N represents the number of transfusion-requiring patient samples in classification tasks, and (alpha ) denotes the regularization coefficient. The matrix (W in {mathbb {R}}^{p times T}) contains regression coefficients, with p being the number of features retained after selection and T representing the number of blood component types.
The proposed MTL framework integrates a hybrid gradient boosting classifier with a two-stage stacked regressor to achieve task synergy through differentiated feature mappings. For the classification task, we introduce the Hybrid Gradient Boosting Voting Ensemble (HGBVE), which combines the strengths of CatBoost and XGBoost. CatBoost uses the Ordered Boosting algorithm with symmetric trees to effectively handle categorical features. XGBoost applies second-order Taylor expansion to optimize the objective function and better model continuous variables [16]. This ensemble strategy is specifically designed to address the heterogeneous feature landscape in AUGIB data, which contains both high-cardinality categorical variables and complex continuous parameters. These two models are integrated using a Bayesian-optimized dynamic soft voting mechanism, where the final decision function is defined as
$$begin{aligned} {hat{y}}_{class}=arg max lfloor alpha P_{cat}(y|x)+(1-alpha )P_{xgb}(y|x)rfloor , end{aligned}$$
where (alpha ) represents the weight parameter balancing the conditional probability outputs from CatBoost and XGBoost models.
For regression tasks, we design a Two-Stage Stacked Regressor (TSR). In the first stage, meta-features are extracted in parallel using RF and XGBoost regressors. RF provides robustness against outliers in skewed laboratory values (PLT, Cryo volumes), while XGBoost captures nonlinear dose-response relationships in frequently transfused components (PRBC, FFP). The stacked architecture specifically addresses the sparse distribution of low-frequency blood products (PLT, Cryo) through hierarchical feature abstraction, where meta-features compress high-dimensional patterns into robust latent representations. The second stage applies the meta-learner (ElasticNet) to perform feature shrinkage and nonlinear combination. ElasticNet introduces sparsity constraints to eliminate redundant meta-features while preserving cross-component dosage correlations essential for modeling transfusion synergy in coagulopathy management [32]. The decision function is formulated as
$$begin{aligned} {hat{y}}_{reg}=beta f_{rf}(x)+(1-beta )f_{xgb}(x)+varepsilon g(Phi (x)), end{aligned}$$
where (beta ) denotes the credibility weight of base models, (epsilon ) represents the combination penalty factor, (g(cdot )) signifies the ElasticNet mapping function, and the feature space (Phi (x) in {mathbb {R}}^{d}) undergoes a dimensional transformation. ( f_{rf}(x) ) and ( f_{xgb}(x) ) correspond to the prediction output of RF and XGBoost regressors for input features ( x ).
To balance the optimization objectives of classification and regression tasks, we propose a dual-task joint loss function
$$begin{aligned} {mathcal {L}}_{text {total}} = gamma cdot {mathcal {L}}_{text {class}} + sum _{i=1}^{4} w_i cdot {mathcal {L}}_{text {reg},i}+lambda Vert Omega Vert _{2}^{2} end{aligned}$$
where (gamma ) is the classification loss weight, (w_i) denotes the weight assigned to each regression loss and (Omega ) represents the model complexity penalty term. A dynamic task activation mechanism is introduced, where the regression task for capacity prediction is activated only when the output probability of the classification task satisfies (P(y=1|x) ge tau ) with the threshold (tau = 0.5). Otherwise, the system directly outputs “no transfusion require”.
Model evaluation
We employ stratified sampling to partition the dataset into a training cohort (n = 942) and a testing cohort (n = 235) at an 8:2 ratio, followed by validation through 5-fold cross-validation. The external cohort (n = 209) was reserved for independent validation. Bayesian optimization tunes hyperparameters of the multi-task framework. Use of cross-validation and hyperparameter tuning for internal validation is considered a robust method for model evaluation before external validation on a separate data set and maximizes the potential performance of the ML model [33]. The ElasticNet mixing coefficient (alpha =0.7), and the penalty factor (lambda =0.05). The joint loss function evaluates overall performance, with classification task weight (gamma = 2) and regression tasks weighted with (omega _i) at (1:1:0.5:0.5) to reflect clinical priorities.
Model evaluation adopts multi-dimensional metrics. Classification performance is measured using accuracy, precision, recall, F1-score, area under the receiver operating characteristic curve (AUCROC), five-fold Cross-Validation, and decision curve analysis (DCA) [34]. For regression tasks, performance is evaluated using the mean squared error (MSE) and mean absolute error (MAE). The MSE highlights extreme prediction deviations, while MAE captures clinically acceptable absolute error thresholds [35]. All regression errors are computed after an inverse transformation to reflect actual transfusion volume deviations in clinical practice. The weighted loss function ({mathcal {L}}_{text {total}}) allows for direct comparison between our MTL framework and traditional machine learning models (RF, XGBoost, MLP, BP), all of which were adapted to perform the same classification and regression tasks. To ensure a fair comparison, all models were evaluated using identical loss components and weighting schemes. Missing values in the external validation cohort were processed using the same method as in the primary dataset. Following standardization, the pre-constructed MTL model was applied for comprehensive validation, with performance metrics evaluated using the same criteria as the internal validation set. Lastly, the interpretability of the MTL model is enhanced through SHAP (SHapley Additive exPlanations) visualization, illustrated by individualized clinical cases, thus increasing its potential utility in clinical practice.