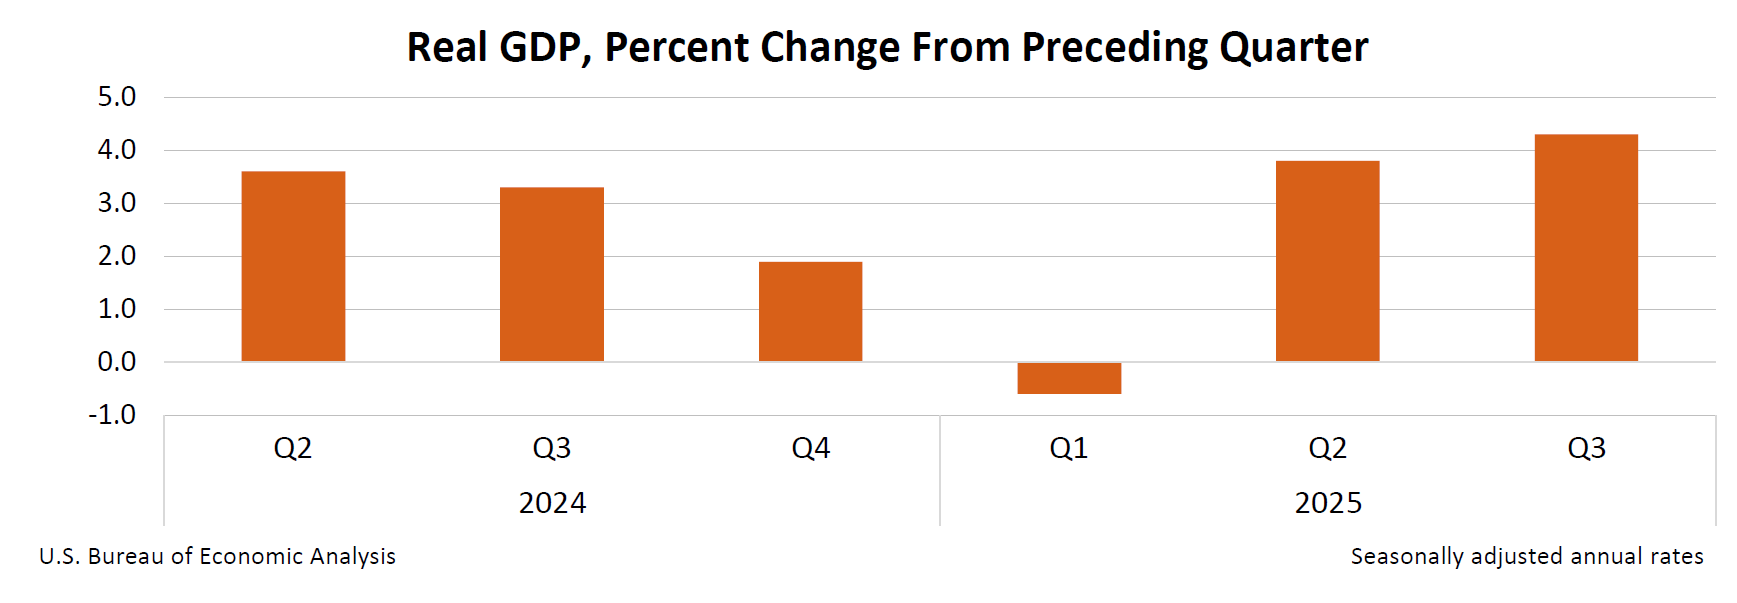
Real gross domestic product (GDP) increased at an annual rate of 4.3 percent in the third quarter of 2025 (July, August, and September), according to the initial estimate released by the U.S. Bureau of Economic Analysis. In the second quarter, real GDP increased 3.8 percent.
Due to the recent government shutdown, this initial report for the third quarter of 2025 replaces the release of the advance estimate originally scheduled for October 30 and the second estimate originally scheduled for November 26.
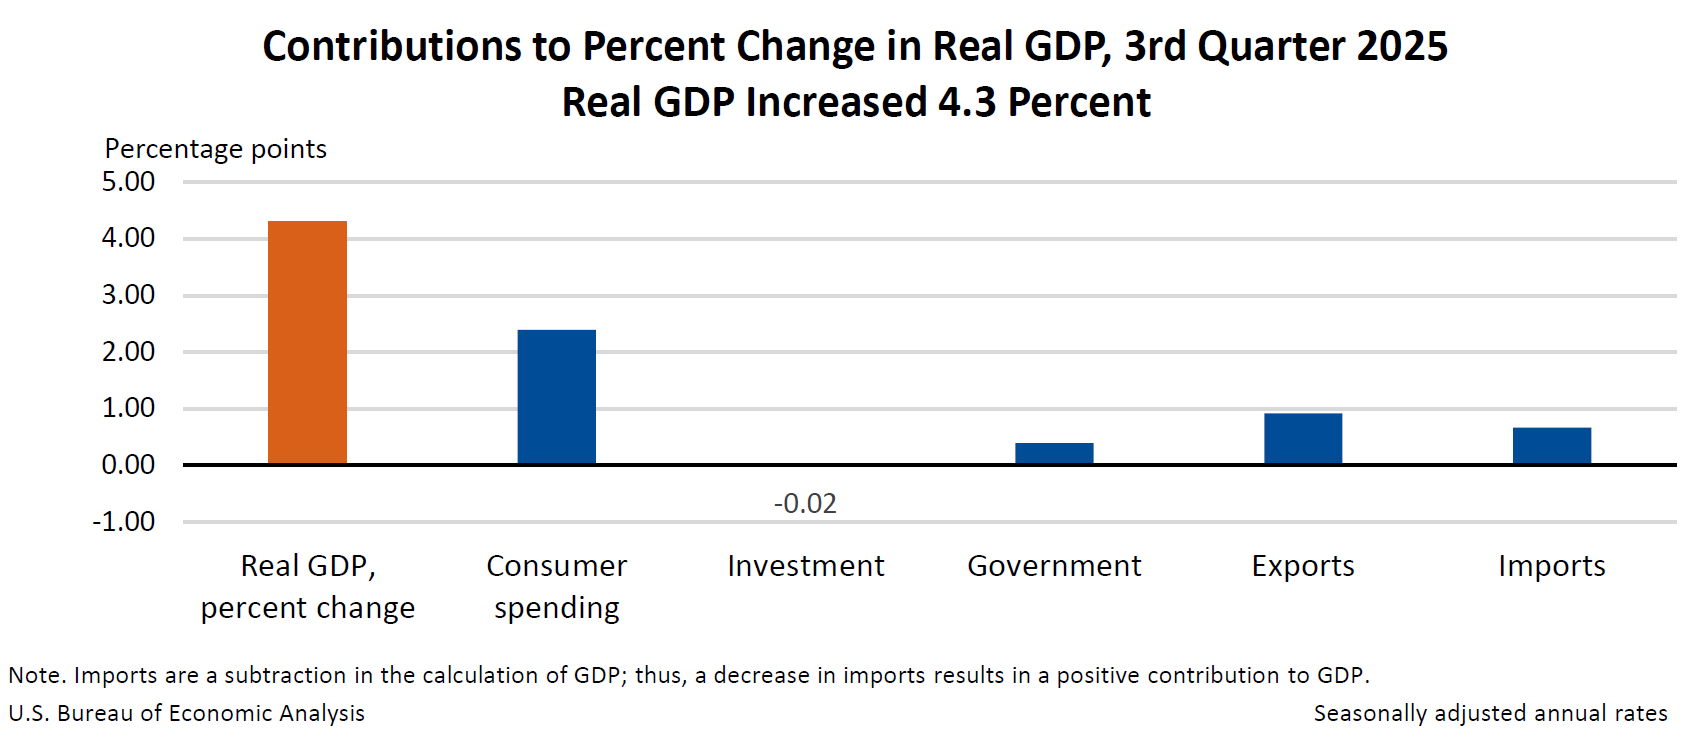
The increase in real GDP in the third quarter reflected increases in consumer spending, exports, and government spending that were partly offset by a decrease in investment. Imports, which are a subtraction in the calculation of GDP, decreased. For more information, refer to the “Technical Notes” below.
Compared to the second quarter, the acceleration in real GDP in the third quarter reflected a smaller decrease in investment, an acceleration in consumer spending, and upturns in exports and government spending. Imports decreased less in the third quarter.
Real final sales to private domestic purchasers, the sum of consumer spending and gross private fixed investment, increased 3.0 percent in the third quarter, compared with an increase of 2.9 percent in the second quarter.
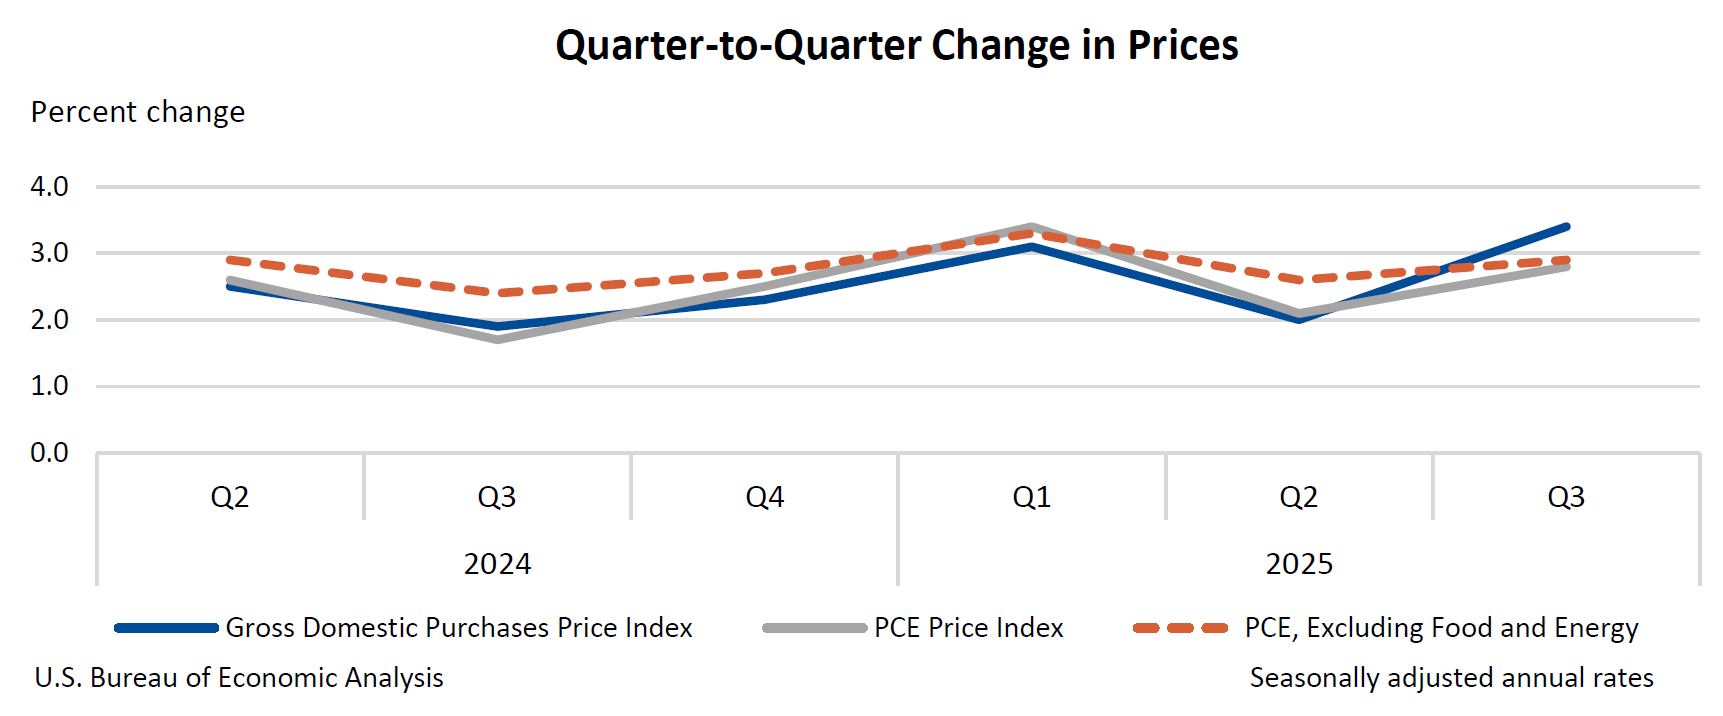
The price index for gross domestic purchases increased 3.4 percent in the third quarter, compared with an increase of 2.0 percent in the second quarter. The personal consumption expenditures (PCE) price index increased 2.8 percent, compared with an increase of 2.1 percent. Excluding food and energy prices, the PCE price index increased 2.9 percent, compared with an increase of 2.6 percent.
Real gross domestic income (GDI) increased 2.4 percent in the third quarter, compared with an increase of 2.6 percent (revised) in the second quarter. The average of real GDP and real GDI increased 3.4 percent in the third quarter, compared with an increase of 3.2 percent (revised) in the second quarter.
Profits from current production (corporate profits with inventory valuation and capital consumption adjustments) increased $166.1 billion in the third quarter, compared with an increase of $6.8 billion in the second quarter.
| Real GDP and Related Measures | |||
|---|---|---|---|
| [Percent change from 2025 Q2 to Q3] | |||
| Initial Estimate | |||
| Real GDP | 4.3 | ||
| Current-dollar GDP | 8.2 | ||
| Real final sales to private domestic purchasers | 3.0 | ||
| Real GDI | 2.4 | ||
| Average of Real GDP and Real GDI | 3.4 | ||
| Gross domestic purchases price index | 3.4 | ||
| PCE price index | 2.8 | ||
| PCE price index excluding food and energy | 2.9 | ||
Today’s release includes updated monthly data for April through September for personal income as well as updated monthly data for July through September for personal outlays and consumer spending. The updated statistics, reflecting newly available source data, are available in BEA’s iTables and API.
* * *
Next release: January 22, 2026, at 8:30 a.m. EST
Gross Domestic Product, 3rd Quarter 2025 (Updated Estimate),
GDP by Industry, and Corporate Profits (Revised)
* * *
Technical Notes
Lapse in federal government appropriations
The federal government shutdown that occurred in October and November resulted in delays in many of the principal source data that are used to produce estimates of GDP. This initial estimate of GDP for the third quarter of 2025 reflects a combination of data and methods that are typically used for the advance and second current quarterly estimates. More information on the source data and BEA assumptions that underlie the third-quarter estimate is shown in the key source data and assumptions table.
Sources of change for real GDP
Real GDP increased at an annual rate of 4.3 percent (1.1 percent at a quarterly rate1) in the third quarter, reflecting increases in consumer spending, exports, and government spending that were partly offset by a decrease in investment. Imports, which are a subtraction in the calculation of GDP, decreased.
- The increase in consumer spending reflected increases in both services and goods. Within services, the leading contributors were health care and other services. Within goods, the leading contributors were recreational goods and vehicles as well as other nondurable goods.
- Within health care, both outpatient services as well as hospital and nursing home services increased, based primarily on newly available third-quarter Census Bureau Quarterly Services Survey (QSS) data.
- Within other services, the leading contributors to the increase were international travel, based on data from BEA’s International Transactions Accounts (ITAs), as well as professional and other services (mainly legal services), based on Census Bureau QSS data.
- The increase in recreational goods and vehicles primarily reflected an increase in information processing equipment, based primarily on Census Bureau Monthly Retail Trade Survey (MRTS) data for all three months of the quarter.
- The increase in other nondurable goods was mainly in prescription drugs reflecting Census Bureau MRTS data.
- For both exports and imports, the estimates primarily reflected data from BEA’s ITAs, including updated information that will be publicly available with the U.S. International Transactions, 3rd Quarter 2025 release on January 14, 2026.
- Within exports, both goods and services increased. The increase in goods was led by capital goods except automotive, as well as nondurable consumer goods. The increase in services was led by other business services, which includes professional and management consulting services.
- Within imports, a decrease in goods (led by nondurable consumer goods) was partly offset by an increase in services (led by other business services).
- The increase in government spending reflected increases in both state and local government spending (led by consumption expenditures) as well as federal government spending (led by defense consumption expenditures).
- The decrease in investment primarily reflected a decrease in private inventory investment (led by wholesale trade and manufacturing), based primarily on Census Bureau inventory book value data and BEA’s inventory valuation adjustment.
Settlements recorded in the third quarter
Estimates of corporate profits were reduced by several settlements that were finalized in the third quarter. Settlements are recorded in the National Income and Product Accounts (NIPAs) on an accrual basis in the quarter when the settlement is finalized, regardless of when they are recorded on a company’s financial statement. Notably, in the third quarter:
- A domestic health insurance provider reached a settlement with multiple sectors totaling $2.8 billion ($11.2 billion at an annual rate), over allegations of antitrust violations.
- A domestic e-commerce company reached a settlement with the U.S. government in the amount of $2.5 billion ($10.0 billion at an annual rate), over allegations of deceptive enrollment practices.
The estimate of GDI was not impacted because these settlements were recorded in the NIPAs as business current transfer payments, which offset the reduction to corporate profits.