What does responsible planning look like as San Antonio becomes a growing hub for data centers?
Councilmember Ric Galvan, whose Westside District 6 contains most of the city’s existing facilities, has calledfor a broad policy discussion on how data centers interact with neighborhood development, utilities and long-term infrastructure.
He says his request stems from questions he’s hearing from residents about energy, water and long-term economic planning.
Galvan has made transparency and resident engagement key parts of his approach since taking office, and he described his Council Consideration Request on data centers as a first step toward understanding what information the city receives from data center operators and what tools it has under state law.
He spoke with the San Antonio Report about the concerns residents are raising, how he’s thinking about the next phase of data center growth and what he hopes the city examines as the issue moves through committee.
This interview has been edited for length and clarity.
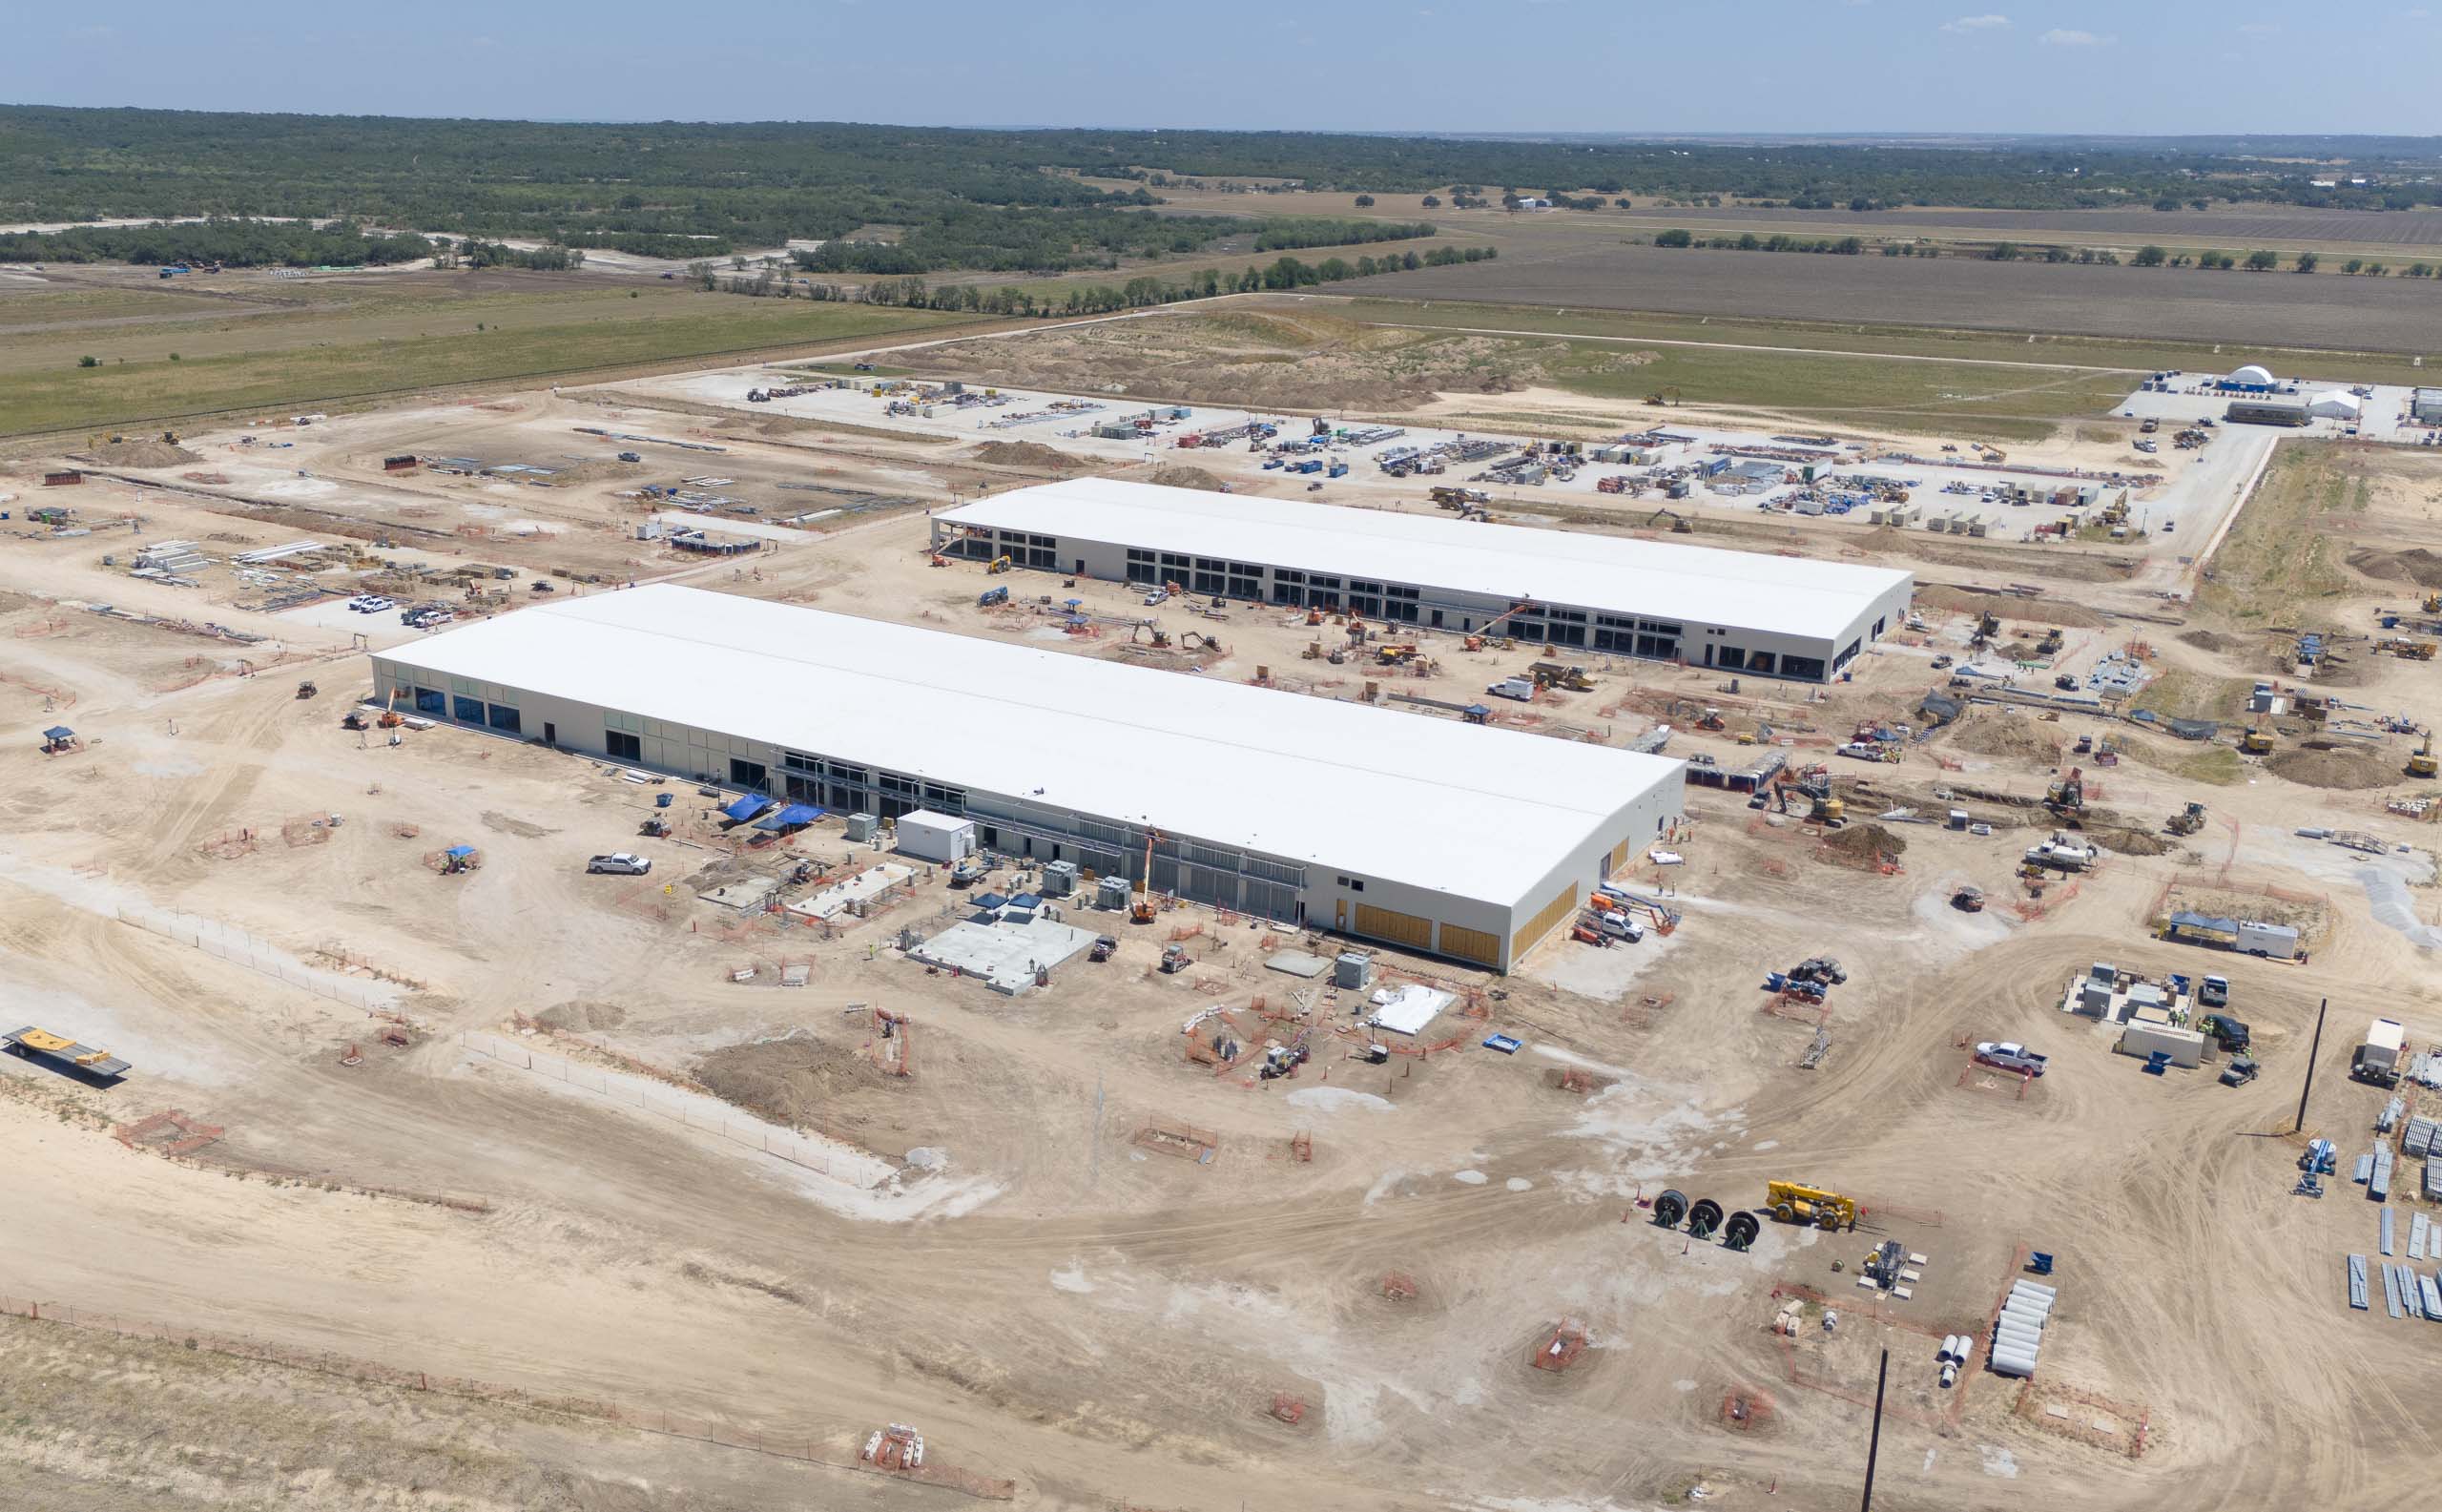
District 6 covers much of San Antonio’s inner to far West Side, some of the city’s fastest-growing areas, and it now contains the majority of San Antonio’s data centers. What does that look like on the ground?
Some of the neighborhood concerns include preserving the landscape, but also questions about workforce opportunities, right? How are these centers providing jobs for residents here in our city? One of the original ones that came through District 6 was Microsoft, one of the first, I believe, that received a significant tax abatement from the City of San Antonio.
They haven’t received any since. I’m almost sure there haven’t been any more tax abatements for data center development. There was a lot of criticism for that because of the low amount of jobs it provided and the significant request for energy that these industries require.
Day-to-day, neighborhoods have concerns about lighting and trees, but also larger concerns about the environment and the impacts on the economic development of our city. At the time when data centers were first coming around, they were a bit more secretive in terms of what they were doing.
But as the industry has grown, there’s more understanding of what’s going on here. Some residents have felt left behind because of that lack of communication about what the industry is and what it does — both around their city and for the entire country.
Is the growth of data centers a net positive for your constituents and the citizens of San Antonio — or are there tradeoffs the city hasn’t fully reckoned with yet?
There are definitely some tradeoffs that the city hasn’t reckoned with that our residents are asking about.
We know Texas is a very sensitive state in terms of energy and water, … while those things are getting a bit better due to state action and activity from our own municipal utilities. Including CPS taking actions to shore up infrastructure needs and grid reliability here locally, which has an impact on the entire state since energy that flows between South Texas and North Texas, goes through San Antonio.
Some of the ramifications of increased data center growth are going to impact, and have been impacting, our energy flow here in our city — not only between our customers and residents, but across the state. Weighing that with the idea of economic development is at the crux of the issue.
Residents are asking about CPS requiring more and more funding to build infrastructure that keeps our lights on but also provides energy for businesses beyond data centers.
And now, with data centers, there has been a requirement for massive loads of energy. That’s been the biggest concern. If resident rates keep increasing to pay for subsidies or infrastructure development, is that for our own energy needs, or for an industry where there isn’t clear information — at least publicly — about the return on investment?
What jobs are we getting from it? How is it impacting the broader economy? How is it indirectly supporting other jobs? That’s the discussion we need to have so there’s better understanding of not only what the industry does, but how effective it is in terms of economic development, and what the tradeoff is in terms of water and energy use that may, and likely will, impact residents through their utility bills.
You mentioned Microsoft earlier, they’re expanding their footprint near Wiseman Boulevard and Loop 1604. When a company like Microsoft continues to scale up in our community, what question does that raise for you as a councilmember?
For me, because it’s such a significant energy and water user — and because of the infrastructure needed for it — we want to make sure we’re getting a proper return on investment. While we may not be subsidizing it directly, we want to make sure this industry is supporting a larger economy and isn’t having a significant impact on the environment.
When I see expansions, it’s a little bit of excitement, right? We always want to see new jobs and new opportunities. We want to see these kinds of things happen in our community. We want a robust economy that supports everyone — including our tax base and our residents overall.
But my concern, and some of the questions I’ve had with these data centers, is: What kind of data are you using here, and what is it for? Is it for Microsoft products, Teams, Outlook, so it makes a bit more sense for residents and council that this needs to be somewhere in our city and our countryto be able to provide these resources.
If it’s for data mining or something else, I think there’s a larger question about, what’s the point of this is and how does it really impact our economy?
… As long as it makes sense in terms of indirectly supporting the economy or directly, I think it will be a better tradeoff for residents to understand or wrap their heads around. But currently, I think it hasn’t been that way publicly, and so we’re kind of in this opaque space at the moment.
You filed a Council Consideration Request calling for a broader policy discussion on data centers. What gaps are you trying to close?
One of the biggest things I want to understand is what is the impact on the economy we’re talking about? We’ve identified data centers and AI and this particular technological industry to be a key component of our local economy.
… It is really important, so that when we talk about either tax incentives or we talk about infrastructure development, utilities needs — whether it’s water or energy — there’s at least a better understanding of what we’re getting out of this.
One of the key things is education about what the industry is and is doing for our city.
Another part of it is making sure that as we are investing in this industry we are doing so in a way that doesn’t impact our residents negatively, whether it’s looking at energy bills going up or water bills potentially going up, or even our environment being impacted in terms of significant noise increases around our neighborhoods or reduction in tree coverage. All those things are important to a lot of our residents, and of course, to our health and our daily lives. …
If we can, as a city, better prepare with our land use policies, with our development code, then we should be able to do that. …
And I also think including the state is a good idea.
We know [Texas’s] Public Utilities Commission is looking at this particular industry because of the concerns statewide on water and energy. So I think we should bring that to the table too and see how San Antonio fits into that larger context, not just here locally, but in the state’s infrastructure.
Do you think San Antonio is prepared right now for the pace of data center growth?
We have a lot of opportunities in the city to be this kind of hub, if we want to be that. I think we are fortunate in having CPS and SAWS be municipally owned, so we can do that proactive planning.
It gives some clarity, not only to our residents, to our city council and to our larger planning entities, and to the industries themselves, whether they can work with somebody directly and sure they’re getting a fair deal here, versus working with other businesses that aren’t engaged in the community in that way.
That’s one positive thing here, that if we’re going to go into this industry and make sure that it’s our city prepared for it, we have the tools to do that. And I believe we do. I think it just comes down to: What is the benefit here? If it’s real economic development, and it’s providing more jobs, providing more opportunities for people to thrive, it’s making our lives easier and better in some way, why wouldn’t we have that conversation?
If it’s not going to do those things, I think we have to then address that, too.
Are we putting our eggs in a basket that’s not going to be as effective, given the fact that we’re seeing, in particular, with AI nationally and even internationally, this thought of a potential bubble? Lots of people are investing in it but aren’t seeing some returns, and so we’re seeing some investors pull back out of it.
So understanding if we are going to position our city in that direction, is that a good or bad thing? … I don’t think we as a City Council have had that conversation publicly and with the best information possible.
So to your question about, are we prepared for it: I don’t think in every way that we need to be.
I don’t think we are in terms of policy conversation. I don’t think we are in terms of urban planning. I think there’s been an interest in [data centers] coming into [San Antonio], because we just are a good location in terms of some regulations, energy reliability, proximity to the military as well as the relationship there.
I think that’s made sense for the industry, and now it’s time to make sure that it makes sense for our community overall, too.
Where do you see the biggest gaps between what residents expect the city to regulate and what law allows?
Our state generally has an attitude of having minimal regulations on businesses and large industries. It’s a very much laissez faire attitude. We’re seeing some of that come to a head at the state level, both with the Public Utilities Commission and ERCOT trying to figure out, how do we actually plan for something that may impact our literal energy, grid and water reliability, if we don’t have the tools necessary to regulate these particular industries or even understand them?
There’s been a lot of conversation about getting data from the data centers about how much water and energy they need when they’re coming into this area. So that we can effectively plan and not see scarcity in terms of energy or water and have enough for everybody.
That’s a big component there, what authority our city does have in terms of the current state rules and what doesn’t exist at the moment. Understanding that a little bit is going to be key here.
And if we can engage a little further, a little faster, in the state, then maybe we can serve as a model for the state to look at. Again, I think we have a good opportunity with CPS and SAWS being our utilities that we oversee to maybe answer some of those questions, at least at a local level.
So all to say, it’s really just making sure that we’re moving with the state … and making sure that we’re not overstepping too far. But, I think if we are able to and without getting any kind of legal trouble, let’s take some of those steps and see if we can serve as a model for what we can do here, what a locality in Texas can do to reckon with some of the concerns that the industry presents to the larger community.
What’s your message to residents who are seeing their communities change as data centers continue to pop up?
I want to thank them for bringing this issue to my attention. It’s something that we, of course, have seen a lot of in the national and statewide news, and we knew it was kind of here in a way, but didn’t really take the full jump into it.
So I want to thank a lot of the folks who live in the Westover Hills neighborhoods, District 6, who talked to me about it during my first few months in office and said, “Do we have any information on this? Do we know what’s going to come next? Do we know what our city can do on this?”
That’s what this CCR is looking to explore, really understanding what tools we have in our toolbox, and what’s doable. What things does the public need to know more about? So whether you are a resident who lives nearby them, or you are concerned about them, or you have questions about them, or even supportive of this industry growing, I think it’s all going to be a crucial part of the conversation.
Our residents should feel empowered to talk with us about it, to learn with us at the same time, it’s going to our public council committees to have this engagement. So if you want to watch the conversations, you want to be part of the conversation. Residents can be no matter where they live in our city, it’s going to go to the Planning and Community Development Committee next and City Council.
I think folks can always be engaged and reach out to our offices as they already have been, to let us know what they think about them. Are there concerns about water? Are there no concerns about water? Are there concerns about the growth of the industry? Are there no concerns? Are there growth tools that people really want to look into? Let’s do that.
I’ll just say I think people should feel empowered to engage in this conversation and voice their thoughts on it, and if they do, it helps us shape our policy the same way they did, taking this policy forward at all.