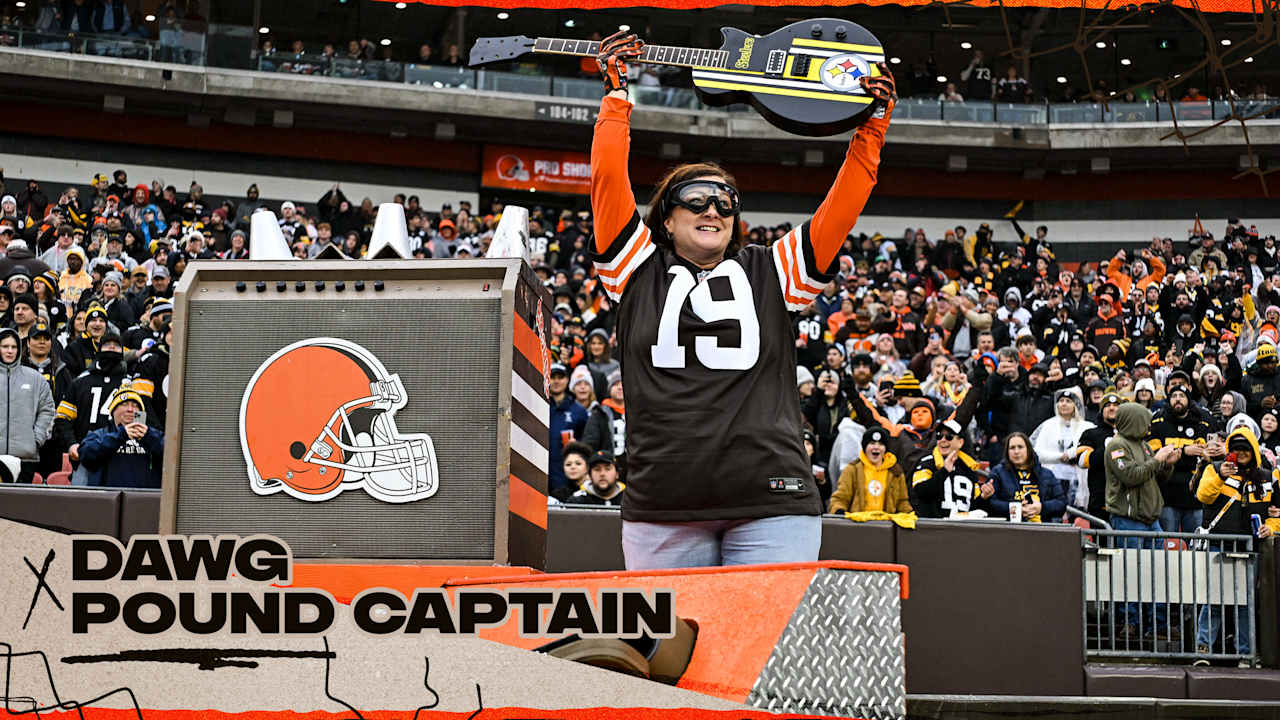
Introduction
In Europe and North America, chronic lymphocytic leukemia (CLL) is the most common leukemia in adults, approximately 25–40% of all leukemia cases.1 Mantle cell lymphoma (MCL), a mature B-cell tumor, is an incurable hematologic neoplasm with a variable clinical course and poor prognosis.2,3 The first generation Bruton’s tyrosine kinase (BTK) inhibitor, ibrutinib, exerts its effects primarily by inhibiting BTK activity in B lymphocytes and is currently used as a first-line treatment for CLL and the treatment of relapsed or refractory disease.4,5 However, ibrutinib has well-known side effects, notably an increased risk of atrial fibrillation, hypertension, and bleeding, thus limiting its use.6 As a second generation BTK inhibitor developed to ensure higher BTK specificity to avoid off-target binding and related side effects, zanubrutinib was approved by the US Food and Drug Administration in November 2019 for treating adult patients with MCL who have received therapies with other drugs.7 Compared with ibrutinib, the exposure coverage of zanubrutinib was above the half-maximal inhibitory concentration throughout the treatment interval.8,9 A variety of B-cell malignancies can be treated with zanubrutinib, including Waldenström’s macroglobulinemia, small lymphocytic lymphoma, MCL and CLL.10 Common post-treatment adverse drug events of zanubrutinib are bleeding, infections (pneumonia, urinary tract infections), neutropenia, thrombocytopenia, diarrhea, and hypertension, most occurring within 12 months of treatment.11
It should be noted that the main metabolism of zanubrutinib is via CYP3A; therefore, dose reductions are advised for patients simultaneously dosing with moderate or potent CYP3A inhibitors, and concomitant administration of moderate or potent CYP3A inducers should be avoided.12–14
Studies have found that taking ibrutinib, a BTK inhibitor, lowers the barrier to fungal infections and increases the likelihood of developing invasive fungal infections.15,16 Invasive fungal infections usually appear early after BTK inhibitor administration.6 Infections secondary to various microorganisms are the most common complication of leukemia, and the fungal infections are known to be one of the most devastating infections that may have a serious impact on patient survival. Posaconazole is an itraconazole-derived triazole antifungal drug.17 With the similar mechanism of other triazole antifungal agents, posaconazole mainly inhibits the synthesis of ergosterol through the inhibition of cytochrome P450-dependent 14α-demethylase, resulting in the biosynthesis of fungal cell membranes and alteration of the permeability of the cell membranes. In terms of drug metabolism, posaconazole is a potent inhibitor of CYP3A4, which can result in a substantial increase in CYP3A4 substrate exposure.18 Several clinically relevant interactions between posaconazole and other drugs have been identified, and the results suggested that the dose of the drug affected by the interaction may need to be significantly reduced, such as cyclosporine A or tacrolimus.19,20
Posaconazole is a potent CYP3A4 inhibitor, and zanubrutinib is primarily metabolized by CYP3A. As the clinical use of zanubrutinib increases, the likelihood of patients developing invasive fungal infections likewise increases, and drug–drug interaction (DDI) between zanubrutinib and the antifungal drug need to be considered.6 There has been a report on the interaction between zanubrutinib and fluconazole/isavuconazole.21 However, the interaction between zanubrutinib and posaconazole has not been published yet. Hence, the aim of the research was to develop and validate a reliable and sensitive ultra performance liquid chromatography tandem mass spectrometry (UPLC-MS/MS) approach to quantify zanubrutinib and posaconazole in rat plasma. Finally, the pharmacokinetics of zanubrutinib and posaconazole were determined in Sprague-Dawley (SD) rats to evaluate the interactions between these two medications.
Materials and Methods
Chemicals and Reagents
Zanubrutinib (Figure 1A, over 98% purity), posaconazole (Figure 1B, over 98% purity), orelabrutinib (Internal standard 1, IS-1, over 98% purity, Figure 1C) and fluconazole (used as IS-2, over 98% purity, Figure 1D,) were purchased from Beijing Sunflower and Technology Development Co., Ltd. (Beijing, China). Methanol and acetonitrile of chromatographic grade were purchased from Merck (Darmstadt, Germany). For the preparation of solutions and mobile phases, ultrapure water was produced by the Milli-Q purification process of Millipore Corporation (Millipore, Bedford, USA). All other solvents and chemicals employed in the investigations were of analytical grade.
Figure 1 Structures of zanubrutinib (A), posaconazole (B), orelabrutinib (C) and fluconazole (D) in this study.
|
Experimental Apparatus and Conditions
Analytes were quantified using a Waters XEVO TQS triple quadrupole mass spectrometer equipped with multiple reaction monitoring (MRM) in positive ion mode. The separation process was conducted at 40°C using a Waters Acquity UPLC BEH C18 column (2.1 mm × 50 mm, 1.7-μm particle size; Waters Corp., Millipore, Bedford, MA, USA). Throughout the analytical process, 0.1% formic acid aqueous solution (A) and acetonitrile (B) were applied, and a gradient elution mode was employed, with the process as follows: initially stayed at 90% A for 0–0.5 min, then linearly decreased to 10% A for the next 0.5–1.0 min, stayed at 10% A for 1.0–1.4 min, then linearly increased to 90% A for 1.4–1.5 min, and finally stayed at 90% A for 1.5–2.0 min. During the analysis, the temperature of the autosampler rack was adjusted to 10°C and the flow rate of the mobile phase was kept at 0.4 mL/min. Moreover, the parameters optimized for mass spectrometry of zanubrutinib, posaconazole, orelabrutinib, and fluconazole included cone voltages of 30 V, 80 V, 20 V, and 6 V, and collision energies of 35 eV, 30 eV, 18 eV, and 16 eV, respectively. The parent and daughter ions of zanubrutinib, posaconazole, orelabrutinib, and fluconazole were m/z 472.20→ 289.97, m/z 701.30→ 683.40, m/z 428.30→ 411.10 and m/z 307.14→ 220.12, respectively (as indicated in Table 1).
![]() |
Table 1 Specific Mass Spectrometric Parameters and Retention Times (RTs) for Posaconazole, Zanubrutinib and IS, Including Cone Voltage (CV), and Collision Energy (CE)
|
Calibration Solution and Quality Control Samples Preparation
Stock solutions of the four substances (1 mg/mL) were obtained by dissolving the respective standards in methanol. Multi-stage dilution of the stock solution with methanol was performed to obtain working solutions of different concentrations. Each sample of the calibration curve points was made by mixing 90 µL of blank rat plasma with 10 µL of the corresponding working solution. The calibration curves for zanubrutinib and posaconazole contained 8 points with concentrations ranging from 1.0–1000 ng/mL and 1.0–2000 ng/mL, respectively. Four quality control samples (QCs) of zanubrutinib (1, 2, 400, and 800 ng/mL) and posaconazole (1, 2, 800, and 1600 ng/mL) were prepared in the same manner. The concentration of IS (orelabrutinib and fluconazole) was 200 ng/mL.
Sample Treatment
Prior to preparation, samples of rat plasma were thawed by transferring them from −80°C to room temperature. Then, the protein precipitation was carried out by mixing 100 µL of plasma and 20 µL of IS working solution in a 1.5 mL centrifuge tube and adding 300 µL of acetonitrile. The tube was vortexed for 1 min to obtain complete mixing. After the mixture had been centrifuged at 13,000 g for 10 min at 4°C, the supernatant was collected in a new centrifuge tube for analysis.
Methodological Validation
The method was validated for selectivity, linearity, recovery, stability, matrix effect, accuracy, and precision in accordance with the US Food and Drug Administration Guidelines for Method Validation.22
Selectivity
Specificity refers to the ability of an analytical method to correctly determine the target compound when other components may be present. By examining three chromatograms of blank plasma, standard solution, and post-oral rat plasma samples from six different rats, the selectivity of the quantification was determined.
Sensitivity and Linearity
The weighted least squares (1/x2) regression model was used to plot the calibration curve using the ratio of peak area of analyte to IS as the Y-axis and the nominal concentration as the X-axis. The low limit of quantification (LLOQ) is the lowest concentration that can be measured and is also the minimum concentration for the calibration curve, with accuracy between 80% and 120% and precision ≤20%.
Accuracy and Precision
QCs of rat plasma with four different concentrations (posaconazole: 1, 2, 800 and 1600 ng/mL, and zanubrutinib: 1, 2, 400 and 800 ng/mL) were determined for one day and three consecutive days to assess the intra-day and inter-day accuracy and precision, respectively. Relative error (RE%) and relative standard deviation (RSD%) were calculated to determine accuracy and precision, respectively. The RE% was in the range of 85–115%, and the RSD% was less than 15% for the three QCs except LLOQ.
Matrix Effect and Extraction Recovery
Assessments of extraction recovery and matrix effect (ME) were performed using blank plasma from five different rats and three different concentrations of QCs (posaconazole: 2, 800 and 1600 ng/mL; zanubrutinib: 2, 400 and 800 ng/mL). For the evaluation of the recovery of zanubrutinib and posaconazole from rat plasma, the peak areas of the pre-spiked QCs from blank plasma were compared with the peak areas of the spiked samples from blank plasma after extraction. The ME was evaluated by measuring the analytes in the treated plasma samples and in the neat solutions.
Stability
The stability of the method was studied by repeating the assay five times under different storage conditions for three rat plasma QCs (posaconazole: 2, 800 and 1600 ng/mL, and zanubrutinib: 2, 400 and 800 ng/mL). The stability study conditions included stability in the analyzer (4 h, 10°C), short-term storage (3 h, room temperature), long-term storage (−80°C, 3 weeks), and freeze–thaw cycles (three times). Values with RSD% less than 15% and RE% between ±15% were considered stable.
DDI Study
Posaconazole and zanubrutinib were, respectively, dissolved in 0.5% sodium carboxymethyl cellulose solution. All the fifteen SD rats (weight 190 ± 10 g) were kept in the experimental environment with free food and water for 7 days to fully acclimatize and were fasted for 12 h before formal administration. The dose of zanubrutinib was determined to be 16 mg/kg based on the human dose, converted by body surface area.23 The dose of posaconazole was determined to be 40 mg/kg based on prior literature.24 Rats were then randomized into three groups (n = 5, Group A, B and C). Group A was orally given 40 mg/kg posaconazole, while group B was administered 16 mg/kg zanubrutinib by gavage and group C was simultaneously provided orally with posaconazole and zanubrutinib. Post-dosing, rat tail vein blood (0.3 mL) was taken at different time points (0.25, 0.5, 0.75, 1, 1.5, 2, 3, 4, 6, 8, 12 and 24 h) and collected into a heparin-containing polyethylene tube. Blood samples were centrifuged at 8,000 × g for 5 min at 4°C, then the plasma was separated and stored at −80°C.
Euthanasia of experimental animals was performed using the anesthesia method according to the AVMA Guidelines for the Euthanasia of Animals. After completion of the experiment, all experimental animals were euthanized by intravenous pentobarbital (150 mg/kg). After ensuring that the animals were free of vital signs, they were packaged and cremated. The entire experimental process of the animals strictly adhered to the regulations for the care and use of laboratory animals as reviewed and approved by the Ethics Committee of The First Affiliated Hospital of Wenzhou Medical University (Wenzhou, China).
Statistical Analysis
The pharmacokinetic parameters were obtained by non-compartmental analysis of the data using Drug and Statistical Software 3.0 (DAS 3.0). The average plasma concentration–time curves were generated using Origin 8.0, and statistical analysis of the parameters were carried out using independent samples t-test using SPSS 24.0.
Results and Discussion
Selectivity
It was observed that the relative retention times of zanubrutinib, posaconazole, orelabrutinib and fluconazole were 1.34 min, 1.40 min, 1.34 min and 1.17 min, respectively, as shown in Figure 2. There were no interferences by endogenous substances or other impurities in the method.
![]() |
Figure 2 Representative chromatograms of zanubrutinib, posaconazole and IS in rat plasma: (A) blank plasma; (B) blank plasma spiked with standard solutions; (C) sample obtained from a rat at 1.0 h after oral administration of 16 mg/kg zanubrutinib and 40 mg/kg posaconazole.
|
Linearity and Sensitivity
The regression analysis based on the least squares method suggested a linear relationship between the relative peak area (analyte/IS) and its corresponding plasma concentration. The resulting regression equations were Y = 0.00975326*X + 0.000628893 (r2 = 0.999) for zanubrutinib with a concentration range of 1.0–1000 ng/mL and Y = 0.0005829366*X + 0.00196414 (r2=0.997) for posaconazole with that of 1.0–2000 ng/mL. In this method, LLOQ for both zanubrutinib and posaconazole was 1 ng/mL, which showed an accuracy of less than ± 20% and a precision of less than 20% (as listed in Table 2).25
![]() |
Table 2 Intra- and Inter-Day Accuracies and Precisions of Posaconazole and Zanubrutinib in Rat Plasma (n = 5)
|
Precision and Accuracy
Except LLOQ, three levels of QCs (posaconazole: 2, 800 and 1600 ng/mL, and zanubrutinib: 2, 400 and 800 ng/mL) were analyzed on three consecutive days to assess accuracy and precision. The inter and intra-day accuracies of zanubrutinib were between −7.5% and 4.2%, with precisions under 5.4% (Table 2). The intra- and inter-day accuracies of posaconazole were between −1.6% and 3.7%, with precisions smaller than 7.0% (Table 2). The experimental data demonstrated an excellent reproducibility and accuracy of the analytical method.
Matrix Effect and Recovery
The results of the recovery and ME of QCs were summarized in Table 3. The mean recoveries of zanubrutinib ranged from 94.9% to 95.8%, with ME values of 110.9–113.5%, and the mean recoveries of posaconazole ranged from 95.4% to 110.5%, with ME values of 95.1–103.6%. These results showed that the recoveries of the approach were excellent and the effects of ME could be negligible in routine assays.
![]() |
Table 3 Recovery and Matrix Effect of Posaconazole and Zanubrutinib in Rat Plasma (n = 5)
|
Stability
The stability experiments included long-term, short-term, autosampler and freeze–thaw studies. Evaluation of stability was undertaken by calculating the RE% and RSD% of QCs under four different conditions as shown in Table 4. The RSD% and RE% were satisfied the requirement, indicating that zanubrutinib and posaconazole in rat plasma were stable under four conditions of this experiment.
![]() |
Table 4 Stability Results of Posaconazole and Zanubrutinib in Rat Plasma in Different Conditions (n = 5)
|
DDI Between Zanubrutinib and Posaconazole
Newly constructed UPLC-MS/MS method was applied successfully to investigate the DDI after oral given of 16 mg/kg zanubrutinib and 40 mg/kg posaconazole in SD rats. Figures 3 and 4 displayed the average concentration–time curve of zanubrutinib and posaconazole. The main parameters of pharmacokinetics are summarized in Tables 5 and 6.
![]() |
Table 5 The Main Pharmacokinetic Parameters of Zanubrutinib in Two SD Rat Groups (16 mg/kg Zanubrutinib Dosed Orally Alone; 16 mg/kg Zanubrutinib and 40 mg/kg Posaconazole Dosed Orally Together) (n = 5, Mean ± SD)
|
![]() |
Table 6 The Main Pharmacokinetic Parameters of Posaconazole in Two SD Rat Groups (40 mg/kg Posaconazole Dosed Orally Alone; 16 mg/kg Zanubrutinib and 40 mg/kg Posaconazole Dosed Orally Together) (n = 5, Mean ± SD)
|
![]() |
Figure 3 Mean plasma concentration–time curves of zanubrutinib in two rat groups (16 mg/kg zanubrutinib dosed orally alone; 16 mg/kg zanubrutinib and 40 mg/kg posaconazole dosed orally together). (n = 5, Mean ± SD).
|
![]() |
Figure 4 Mean plasma concentration–time curves of posaconazole in two rat groups (40 mg/kg posaconazole dosed orally alone; 16 mg/kg zanubrutinib and 40 mg/kg posaconazole dosed orally together). (n = 5, Mean ± SD).
|
As the results were shown, there were significant increases in AUC0-t and AUC0-∞ for zanubrutinib when it was administered concomitantly with posaconazole in rats. Zanubrutinib is primarily metabolized by CYP3A4, while posaconazole is an inhibitor of CYP3A4. Posaconazole may increase plasma exposure by inhibiting the activity of the primary metabolic enzyme of zanubrutinib.26,27 Previous study indicated that the antifungal drugs voriconazole and fluconazole significantly increase the plasma exposure of another BTK inhibitor, tirabrutinib.28 The results of a randomized controlled trial showed that when the BTK inhibitor ibrutinib was used in combination with itraconazole, the plasma exposure of ibrutinib was ten times higher than that in the group using ibrutinib alone.29 Inhibition of CYP3A4 activity by antifungal drugs may increase BTK exposure. When zanubrutinib and posaconazole were used in combination, there were also significant differences in the main pharmacokinetic parameters of posaconazole, such as significant increases in AUC0-t, AUC0-∞, Tmax and Cmax, and a remarkable decrease in CLz/F. Posaconazole circulates in plasma primarily as the parent compound, with most of it forming glucuronide conjugates through UDP glucuronidation.30 Zanubrutinib and posaconazole are both potential substrates of the efflux transporter P-glycoprotein (P-gp).31,32 Based on P-gp, zanubrutinib may significantly increase the Tmax and Cmax of posaconazole by affecting its excretion. However, there is currently no clear explanation for this phenomenon, and further research is needed in the future. A significant inhibitory effect of posaconazole on the metabolism of zanubrutinib was demonstrated by these results, leading to a significant increase in the systemic exposure of zanubrutinib. Concurrently, zanubrutinib inhibited the metabolism of posaconazole in rats, resulting in a slower clearance and increased exposure in vivo. Due to the increased systemic exposure of zanubrutinib and posaconazole and the higher peak plasma concentration of posaconazole, this was more likely to result in adverse events.
Thus, if co-administration of zanubrutinib and posaconazole is unavoidable, it is advisable to reduce the dosage of the drugs or to monitor plasma levels. The limitations of this animal study are that the sample size used was limited, and direct extrapolation to humans may not be possible given the interspecies variability. Our results provide some data to support the rational use of medication in clinical settings, and future clinical studies are needed to clarify the possibility of DDI. Another limitation of this study is that the maximum duration of the animal experiments was determined to be only 24 h, when posaconazole was still not completely eliminated in the co-administration group, making it impossible to effectively assess the t1/2 of posaconazole.
Conclusion
In summary, when posaconazole and zanubrutinib were used together, their respective pharmacokinetic parameters would be changed. The AUC of zanubrutinib was significantly elevated, and the pharmacokinetic parameters of posaconazole were also significantly altered. Such interactions may lead to increased systemic exposure of each drug and increased incidence of adverse drug events even cause serious adverse events. It is suggested clinically to avoid the combination of the two drugs as much as possible. Given the influence of plasma drug concentrations on efficacy and toxicity, therapeutic drug monitoring (TDM) is recommended for posaconazole and zanubrutinib during the co-administration. The dosage should be adjusted in time by the results of TDM, and the occurrence of adverse drug events should be closely observed during the treatment.
Abbreviations
BTK, Bruton’s tyrosine kinase; CLL, chronic lymphocytic leukemia; MCL, mantle cell lymphoma; DDI, drug–drug interactions; UPLC-MS/MS, ultra performance liquid chromatography tandem mass spectrometry; IS, internal standards; SD, Sprague-Dawley; LLOQ, low limit of quantification; MRM, multiple reaction monitoring; QCs, quality control samples; LLOQ, low limit of quantification; RE%, relative error; RSD%, relative standard deviation; ME, matrix effect; TDM, therapeutic drug monitoring; AUC, area under the plasma concentration–time curve; MRT, mean residence time; t1/2, elimination half time; Tmax, peak time; CLz/F, plasma clearance; Cmax, maximum plasma concentration.
Data Sharing Statement
The raw data supporting the conclusion of this article will be made available by the authors, without undue reservation.
Ethics Approval and Consent to Participate
Animal experiments were demonstrated to be ethically acceptable and were carried out according to the Guidelines of the Experimental Animal Care and Use of Laboratory Animals of The First Affiliated Hospital of Wenzhou Medical University. All animal procedures and experimental protocols were approved by the Laboratory Animal Ethics Committee of The First Affiliated Hospital of Wenzhou Medical University (Ethics approval number: WYYY-IACUC-AEC-2023-035).
Acknowledgement
The authors thank Ren-ai Xu for his assistance with this research.
Author Contributions
All authors made a significant contribution to the work reported, whether that is in the conception, study design, execution, acquisition of data, analysis and interpretation, or in all these areas; Xiaoxiang Du and Hailun Xia took part in drafting, revising or critically reviewing the article; all other authors took part in revising the article; all authors gave final approval of the version to be published; have agreed on the journal to which the article has been submitted; and agree to be accountable for all aspects of the work.
Funding
This work was supported by the Bethune Charitable Foundation.
Disclosure
The authors declare that they have no known competing financial interests or personal relationships that could influence the work reported in this study.
References
1. Siegel RL, Miller KD, Fuchs HE, Jemal A. Cancer statistics, 2022. CA Cancer J Clin. 2022;72(1):7–33. doi:10.3322/caac.21708
2. Kumar A, Sha F, Toure A, et al. Patterns of survival in patients with recurrent mantle cell lymphoma in the modern era: progressive shortening in response duration and survival after each relapse. Blood Cancer Journal. 2019;9(6). doi:10.1038/s41408-019-0209-5.
3. Bond DA, Martin P, Maddocks KJ. Relapsed Mantle Cell Lymphoma: current Management, Recent Progress, and Future Directions. J Clin Med. 2021;10(6):1207. doi:10.3390/jcm10061207
4. Wierda WG, Brown J, Abramson JS, et al. NCCN Guidelines(R) Insights: chronic Lymphocytic Leukemia/Small Lymphocytic Lymphoma, Version 3.2022. J Natl Compr Canc Netw. 2022;20(6):622–634. doi:10.6004/jnccn.2022.0031
5. Eichhorst B, Robak T, Montserrat E, et al. Chronic lymphocytic leukaemia: ESMO Clinical Practice Guidelines for diagnosis, treatment and follow-up. Ann Oncol. 2021;32(1):23–33. doi:10.1016/j.annonc.2020.09.019
6. Estupiñán HY, Berglöf A, Zain R, Smith CIE. Comparative Analysis of BTK Inhibitors and Mechanisms Underlying Adverse Effects. Front Cell Dev Biol. 2021;9:630942. doi:10.3389/fcell.2021.630942
7. Guo Y, Liu Y, Hu N, et al. Discovery of Zanubrutinib (BGB-3111), a Novel, Potent, and Selective Covalent Inhibitor of Bruton’s Tyrosine Kinase. J Med Chem. 2019;62(17):7923–7940. doi:10.1021/acs.jmedchem.9b00687
8. Marostica E, Sukbuntherng J, Loury D, et al. Population pharmacokinetic model of ibrutinib, a Bruton tyrosine kinase inhibitor, in patients with B cell malignancies. Cancer Chemotherapy and Pharmacology. 2015;75(1):111–121. doi:10.1007/s00280-014-2617-3
9. Ou YC, Tang Z, Novotny W, Cohen A, Sahasranaman SJL. Rationale for once-daily or twice-daily dosing of zanubrutinib in patients with mantle cell lymphoma. Leukemia Lymphoma. 2021;2021(12):1–13.
10. Munoz J, Wang Y, Jain P, Wang M. Zanubrutinib in lymphoproliferative disorders: a comprehensive review. Ther Adv Hematol. 2022;13:20406207221093980. doi:10.1177/20406207221093980
11. Trotman J, Tedeschi A, Linton K, Mckay P, Opat SJHO. Safety And Efficacy Of Zanubrutinib In Patients With Relapsed/Refractory Marginal Zone Lymphoma (Magnolia Phase 2 Study). Hematological Oncology. 2021;39(S2):1. doi:10.1002/hon.19_2880
12. Ou YC, Preston RA, Marbury TC, Tang Z, Sahasranaman SJL. A Phase 1, open-label, single-dose study of the pharmacokinetics of zanubrutinib in subjects with varying degrees of hepatic impairment. Lymphoma. 2020;61(2):1–9.
13. Mu S, Tang Z, Novotny W, Tawashi M, Sahasranaman SJCC. Effect of rifampin and itraconazole on the pharmacokinetics of zanubrutinib (a Bruton’s tyrosine kinase inhibitor) in Asian and non-Asian healthy subjects. Pharmacology. 2019;2019(17):1.
14. Wang K, Yao X, Zhang M, et al. Comprehensive PBPK model to predict drug interaction potential of Zanubrutinib as a victim or perpetrator. Clin Cosmet Invest Dermatol. 2021;10(5):2.
15. Maffei R, Maccaferri M, Arletti L, et al. Immunomodulatory effect of ibrutinib: reducing the barrier against fungal infections. Blood Rev. 2020;40:100635. doi:10.1016/j.blre.2019.100635
16. Zarakas MA, Desai JV, Chamilos G, Lionakis MS. Fungal Infections with Ibrutinib and Other Small-Molecule Kinase Inhibitors. Curr Fungal Infect Rep. 2019;13(3):86–98. doi:10.1007/s12281-019-00343-9
17. Hof HJM. A new, broad-spectrum azole antifungal: posaconazole – mechanisms of action and resistance, spectrum of activity. Mycoses. 2006;49:3.
18. Chen L, Krekels EHJ, Verweij PE, Buil JB, Knibbe CAJ, Bruggemann RJM. Pharmacokinetics and Pharmacodynamics of Posaconazole. Drugs. 2020;80(7):671–695. doi:10.1007/s40265-020-01306-y
19. Azanza JR, Mensa J, Barberan J, et al. Recommendations on the use of azole antifungals in hematology-oncology patients. Rev Esp Quimioter. 2023;36(3):236–258. doi:10.37201/req/013.2023
20. Mcclelland J, Wong E, Grigg A. Optimizing the oral dose of cyclosporine with concomitant posaconazole post stem cell allograft. Leukemia Lymphoma. 2022;2022:1–5.
21. Tang PF, Bao SS, Xiao ZX, et al. A novel UHPLC‒MS/MS method for quantitative analysis of zanubrutinib in rat plasma: application to an in vivo interaction study between zanubrutinib and triazole antifungal. BMC Chem. 2023;17(1):107. doi:10.1186/s13065-023-01017-x
22. Tang PF, Bao SS, Gao NY, et al. Development and Validation of a UHPLC-MS/MS Method for Quantitation of Almonertinib in Rat Plasma: application to an in vivo Interaction Study Between Paxlovid and Almonertinib. Front Pharmacol. 2022;13:960311. doi:10.3389/fphar.2022.960311
23. Brown JR, Eichhorst B, Lamanna N, et al. Sustained benefit of zanubrutinib vs ibrutinib in patients with R/R CLL/SLL: final comparative analysis of ALPINE. Blood. 2024;144(26):2706–2717. doi:10.1182/blood.2024024667
24. Khalil HA, El-Yazbi AF, Belal TS, Hamdy DA. High Performance Liquid Chromatographic Assay for the Simultaneous Determination of Posaconazole and Vincristine in Rat Plasma. Int J Anal Chem. 2015;2015:743915. doi:10.1155/2015/743915
25. Guidance for industry. Bioanalytical Method Validation August 2. 2018.
26. Podoll T, Pearson PG, Kaptein A, et al. Identification and Characterization of ACP-5862, the Major Circulating Active Metabolite of Acalabrutinib: both Are Potent and Selective Covalent Bruton Tyrosine Kinase Inhibitors. J Pharmacol Exp Ther. 2023;384(1):173–186. doi:10.1124/jpet.122.001116
27. Nemunaitis J, Young A, Ejadi S, et al. Effects of posaconazole (a strong CYP3A4 inhibitor), two new tablet formulations, and food on the pharmacokinetics of idasanutlin, an MDM2 antagonist, in patients with advanced solid tumors. Cancer Chemother Pharmacol. 2018;81(3):529–537. doi:10.1007/s00280-018-3521-z
28. Xia M, Liu YN, Chen J, Xu RA, Dai G. The Pharmacokinetic Interaction of Tirabrutinib with Voriconazole, Itraconazole, and Fluconazole in SD Rats by UPLC-MS/MS. Curr Med Chem. 2024;31(34):5612–5619. doi:10.2174/0109298673268883231108062655
29. Tapaninen T, Olkkola AM, Tornio A, et al. Itraconazole Increases Ibrutinib Exposure 10-Fold and Reduces Interindividual Variation-A Potentially Beneficial Drug-Drug Interaction. Clin Transl Sci. 2020;13(2):345–351. doi:10.1111/cts.12716
30. Li Y, Theuretzbacher U, Clancy CJ, Nguyen MH, Derendorf H. Pharmacokinetic/pharmacodynamic profile of posaconazole. Clin Pharmacokinet. 2010;49(6):379–396. doi:10.2165/11319340-000000000-00000
31. Zhang H, Ou YC, Su D, et al. In vitro investigations into the roles of CYP450 enzymes and drug transporters in the drug interactions of zanubrutinib, a covalent Bruton’s tyrosine kinase inhibitor. Pharmacol Res Perspect. 2021;9(6):e00870. doi:10.1002/prp2.870
32. Shumaker AC, Bullard HM, Churpek J, Knoebel RW. Posaconazole-digoxin drug-drug interaction mediated by inhibition of P-glycoprotein. J Oncol Pharm Pract. 2019;25(7):1758–1761. doi:10.1177/1078155218801055