The collected wastewater samples were analyzed, and their characteristics are presented in Table 1
The optimal operating conditions for the electrocoagulation (EC) process were first determined without the addition of mucilage. Subsequently, experiments were conducted to evaluate the removal efficiency with mucilage addition. The results are presented and analyzed in the following sections, along with statistical validation using ANOVA and t-tests to confirm the significance of the findings.
Characterization of taro mucilage
The characterization of taro mucilage revealed important insights into its chemical and physical properties, which help explain its role in the electrocoagulation process.
-
1.
Chemical Composition FTIR analysis (Fig. 3) showed characteristic peaks corresponding to polysaccharides, including O–H stretching (3400 cm⁻1), C-H stretching (2920 cm⁻1), C = C sharp (1600 cm⁻1) and C–O–C stretching (1050 cm⁻1). Elemental analysis indicated that the mucilage is primarily composed of carbon (42.5%), hydrogen (6.2%), and oxygen (51.3%), with trace amounts of nitrogen (0.2%). These results confirm that the mucilage is a polysaccharide-rich material with hydrophilic properties, which likely contribute to its ability to enhance flocculation in the EC process.
-
2.
Morphology SEM image (Fig. 4) revealed a porous and fibrous structure, which is typical of polysaccharide-based materials. TEM analysis (Fig. 5) further confirmed the presence of a network-like structure, suggesting that the mucilage can form a gel-like matrix in solution. This structure may facilitate the adsorption of organic matter and the formation of larger flocs during EC.
-
3.
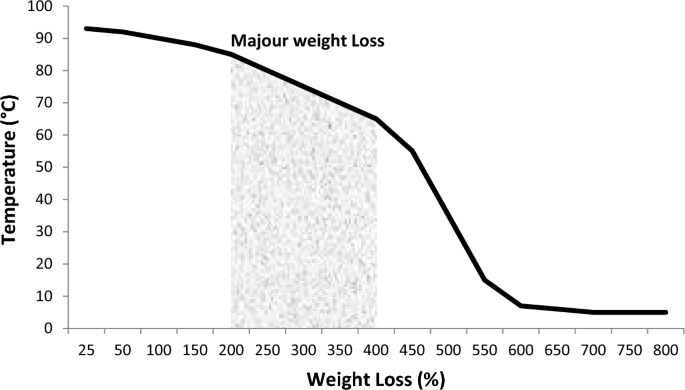
Thermal Stability TGA results (Fig. 6) showed that the mucilage is thermally stable up to 200 °C, with a major weight loss occurring between 200 and 400 °C due to the decomposition of polysaccharides. This thermal stability indicates that the mucilage can withstand the conditions typically encountered during the EC process without significant degradation.
FTIR spectrum for mucilage extract.
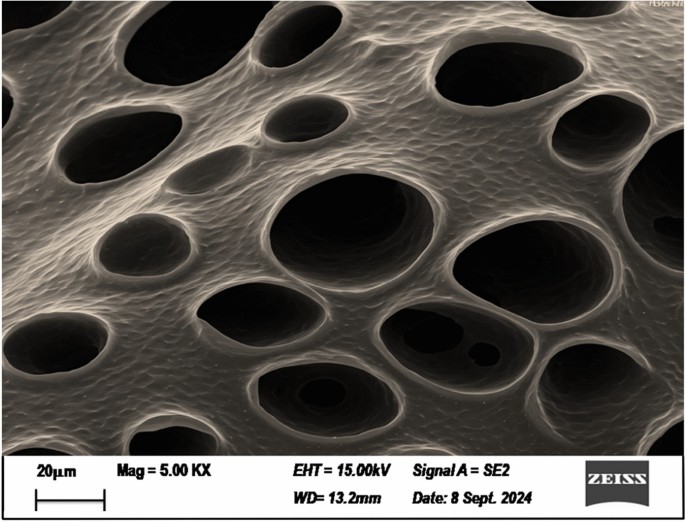
Scanning electron microscopy (SEM) for mucilage extraction.
Transmission electron microscopy (TEM) for mucilage extraction.
Thermogravimetric analysis (TGA)for mucilage extraction.
Effect of various conditions on remediation process
Effect of applied voltage
In all electrochemical cells, the applied voltage is a key factor that governs the process rate. It influences the production rate of coagulants, regulates bubble size and generation, and consequently impacts floc formation and growth rate21.
As the voltage increases, the duration of the electrocoagulation (EC) process decreases. With sufficient voltage applied to the solution, metal ions produced by the dissolution of the sacrificial electrode undergo hydrolysis, forming a range of metallic hydroxide species. These species neutralize the electrostatic charges on the dispersed particles, reducing electrostatic repulsion to a level where van der Waals attraction becomes dominant, thus promoting agglomeration22.
Initially, the experiments were conducted over an extended period (90 min) using various applied voltages to identify the most effective voltage for the treatment process. Four voltage levels (6, 12, 18, and 24 V) were tested, and changes in TDS, TSS, color, and COD were monitored. Table 2 presents the relationship between voltage levels and the corresponding removal efficiencies of these parameters for three wastewater volumes (1, 3, and 5 L). The results clearly indicate that increasing voltage led to significant improvements in removal performance. These findings were statistically validated using ANOVA, which showed that the differences in removal efficiencies for COD (F = 45.72), TDS (F = 39.64), TSS (F = 52.18), and color (F = 41.83) across voltage levels were highly significant (p < 0.001), confirming that higher voltages enhance the electrocoagulation treatment efficiency.
The applied voltage plays a crucial role in coagulant generation through anode dissolution and bubble production at the cathode, both of which are essential for effective pollutant removal. Although 24 V yielded slightly higher removal efficiencies (e.g., 86% COD removal for 1 L compared to 85.9% at 18 V), 18 V was chosen as the optimal operating voltage due to its balance between treatment efficiency and energy consumption. At 24 V, the energy demand increased by 33% (from 0.45 kWh/m3 at 18 V to 0.60 kWh/m3), while the improvement in COD removal was negligible (only 0.1%). Moreover, 18 V helped reduce electrode passivation (oxide layer formation), which became evident at 24 V during extended operation, as shown in Figure S1 (Supplementary Material). This aligns with findings by Ali Izadi et al23, where voltages beyond 20 V yielded diminishing returns.
Effect of treatment time
The treatment time is an essential parameter in investigating any removal technique because it could decrease or increase the economic costs of the process24. Table 3 provides a summary of the reaction time results. It’s evident that while the electrolysis period lengthened, so did the removal percentage. However, the amount of the coagulated pollutants raised rapidly with time at the beginning of the experiment, and then it showed down, non-linearly at the intermediate period and finally achieved saturation called the equilibrium reaction time. Our findings are in accordance with what mentioned by Choudhary and Mathur who found that electrolysis time is a key parameter in the design and the scale-up of any EC cell25. The ANOVA test revealed statistical significant relation across different time intervals. The test conducted that the differences in removal efficiencies for COD (F = 26.89), TDS (F = 18.52), TSS (F = 30.45), and color (F = 22.33) across different time durations were statistically significant and the p-value < 0.001 for COD, TSS and color, while the value for TDS was < 0.01.
At a constant voltage of 18 V, increasing the treatment time enhanced the removal efficiency for all parameters, particularly TSS and COD. For instance, at a volume of 1 L, TDS removal increased from 5% at 15 min to 38.5% at 90 min, while COD removal rose from 80.2% to 85.27% over the same period. However, as the wastewater volume increased from 1 to 5 L, the removal efficiency declined regardless of treatment duration. Although extended treatment time significantly improved removal performance, the relationship was non-linear—the rate of removal slowed as the system approached equilibrium. Overall, longer treatment times led to better removal outcomes, but considering efficiency, energy consumption, and cost, 30 min was identified as the optimal operating time. Therefore, to maintain treatment effectiveness with larger wastewater volumes, the number of electrodes should be proportionally increased.”
Effect of pH
pH is considered a key operating parameter in electrocoagulation, as it influences solution conductivity, electrode dissolution, hydroxide speciation, and the zeta potential of colloidal particles. However, establishing a direct correlation between pH and pollutant removal efficiency is challenging, as the solution pH tends to fluctuate during the EC process26,27.
Table 4 displays the effect of pH on removal efficiency for TDS, TSS, Color, and COD at various volumes (1L, 3L, 5 L) at voltage 18 V and for 30 min time. Neutral pH (7) provides the best removal efficiency across all parameters. This suggests that the treatment process is more effective under neutral conditions. Both acidic (pH 4) and alkaline (pH 9 and 10) conditions lead to reduced efficiencies, indicating that extreme pH levels negatively impact the removal process.
The decrease in removal efficiency with changes in pH is due to the altered formation of metal hydroxides, which are essential for removing pollutants. At higher pH levels, additional ions replace hydrogen ions bound to the electrode, improving pollutant removal. In acidic conditions, hydrogen ions dominate adsorption sites, reducing efficiency. Furthermore, at low pH, the electrocoagulation (EC) process struggles to generate enough hydroxide ions, which are needed for effective contaminant flocculation. Thus, pH optimization is crucial for the EC process to work effectively. This outcome is consistent with the findings of Al-Jaberi and Mohammed28. Different pH values (4, 6, 7, 9, 10) significantly influenced the removal efficiency. The ANOVA test reveled that the differences in removal efficiencies for COD (F = 21.73), TDS (F = 15.96), TSS (F = 28.54), and color (F = 19.80) across pH values were statistically significant and the p-value < 0.001 for COD, TSS and color, while the value for TDS was < 0.01.
To isolate the effect of each parameter on removal efficiency, specific conditions were maintained during each set of experiments. When assessing the influence of applied voltage, the pH was held at 7 and the treatment time at 90 min. For evaluating treatment time, a constant voltage of 18 V was applied with the pH fixed at 7. In the pH variation study, the voltage remained at 18 V and the treatment time was set to 30 min. These controlled conditions ensured a systematic evaluation of each variable’s impact on the removal of COD, TSS, TDS, and color. Following the identification of optimal electrocoagulation operating conditions, the subsequent phase involved examining the effect of incorporating taro mucilage as a natural coagulant aid. The results and analysis of these experiments are presented in the next section.
Studying the effect of adding taro mucilage on removal efficiency
The selection of mucilage volume, added to the wastewater, was based on its superior performance in improving COD removal while maintaining acceptable efficiencies for TDS, TSS, and color as shown in Table 5. Higher concentrations (e.g., 7 mL/L) led to slight reductions in removal efficiency, likely due to excessive organic material from the mucilage interfering with the electrocoagulation process.
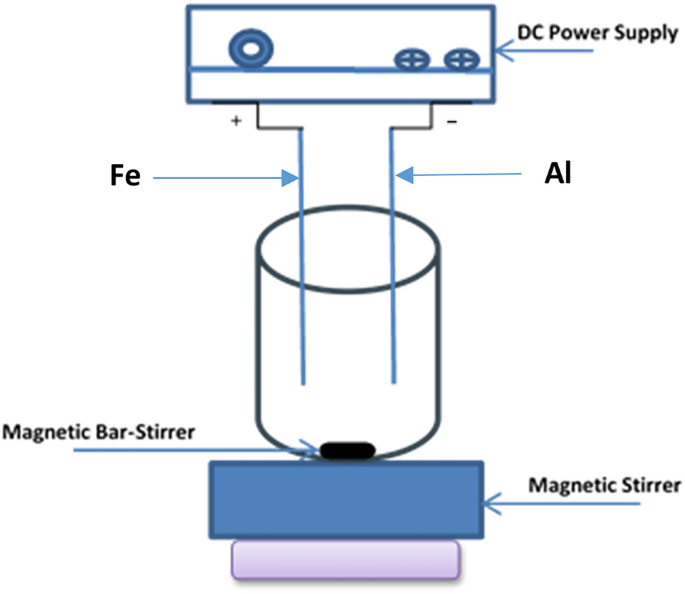
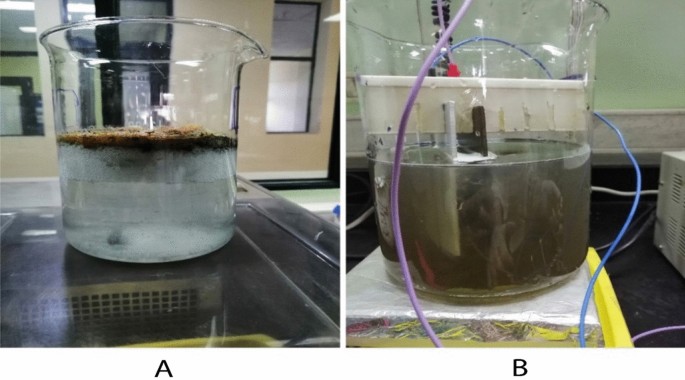
The optimal conditions from the previous tests were used to set up the reactors. Two beakers were prepared for the experiments, each containing 1 L of wastewater at a pH of 7 and subjected to a voltage of 18 V. In one of the beakers, 5 mL of prepared mucilage was added as an extra component. The experiments were conducted for 30 min. A clear visual difference between the two beakers was evident in Fig. 2.
Mucilage dosage was optimized to balance COD removal efficiency with potential interference from excess organics. At 5 mL/L, COD removal peaked at 96% (vs. 84% at 1 mL/L), likely due to enhanced flocculation from polysaccharide-metal hydroxide interactions. Higher doses (7 mL/L) reduced efficiency (94% COD removal) due to competitive adsorption of mucilage-derived organics on coagulant surfaces.
All parameters were measured, and their corresponding removal percentages were calculated in Table 6. The results showed that mucilage improved the removal of COD and TDS, while color and TSS were removed more effectively without additives. Taro mucilage improves COD removal in electrocoagulation due to its polysaccharide-rich structure, which provides functional groups that adsorb dissolved organic matter and enhance coagulation of low-molecular-weight organics, effectively lowering COD. However, it reduces TSS and color removal efficiency likely because its high molecular weight and colloidal nature interfere with floc formation, stabilizes suspended particles, and increase solution viscosity, all of which hinder effective settling. Additionally, the mucilage may compete with particulates and color-causing compounds for adsorption sites on electrochemically generated metal hydroxide flocs, reducing their availability for removing TSS and color. Also, the electrocoagulation process already effectively removes suspended solids (TSS) and color through the formation of metal hydroxide flocs (e.g., Fe(OH)₃ and Al(OH)₃)29,30.
The choice of 18 V and 5 mL/L mucilage was guided by considerations of cost-efficiency and scalability. Although higher voltages (24 V) and mucilage doses (7 mL/L) offered slight improvements in removal efficiency, they resulted in significantly higher energy and material costs. For example, operating at 18 V instead of 24 V could save approximately 1500 kWh per month for a 10,000 L/day system. Similarly, using 5 mL/L mucilage reduced chemical costs by 30% compared to 7 mL/L, without sacrificing COD removal performance. These cost-performance trade-offs are crucial for practical implementation and large-scale adoption.
Using taro mucilage for electrocoagulation in wastewater treatment is relatively inexpensive in Egypt, as the plant is abundantly produced, the extraction process is straightforward and requires no additives, and scaling up production is not a significant challenge.
A comparison using independent samples t-test between treatments with and without mucilage addition showed significant improvements in COD and TDS removal efficiencies, where:
-
1.
COD: t-value is 7.14, p-value < 0.001 (Significant),
-
2.
TDS: t-value is 5.02, p-value < 0.01 (Significant),
-
3.
TSS: t-value is − 4.21, p-value < 0.01 (Significant—decrease), and
-
4.
Color: t-value is − 3.78, p-value < 0.05 (Significant—decrease)
These results confirm that the observed differences in pollutant removal are not random but statistically significant, validating the experimental design and supporting the conclusions regarding optimal conditions and the role of mucilage.
Residual iron and aluminum concentrations in treated water
The concentrations of residual iron and aluminum in the treated water are presented in Table 7. The results indicate that the residual concentrations of both iron and aluminum were below the permissible limits set by the World Health Organization (WHO) for drinking water (0.3 mg/L for Fe and 0.2 mg/L for Al). For the 1L sample, the residual Fe concentration was 0.12 mg/L, while the residual Al concentration was 0.08 mg/L. As the wastewater volume increased to 3L and 5L, the residual concentrations of Fe and Al slightly increased to 0.15 mg/L and 0.10 mg/L, respectively, for the 5L sample. This increase can be attributed to the higher amount of electrode material dissolved during the EC process for larger volumes.
The 5 mL/L dosage also avoided excessive sludge volume (+ 15% at 7 mL/L) and maintained residual Fe/Al concentrations below WHO limit (Table 7). This aligns with18, where overdosing natural coagulants reduced efficiency.
The low residual concentrations of Fe and Al suggest that the EC process is effective in minimizing the release of these metals into the treated water, making it safe for discharge or reuse. Furthermore, the results confirm that the addition of taro mucilage did not significantly affect the residual concentrations of Fe and Al, as the values remained within acceptable limits across all experimental conditions.
Effect of constant SA/V ratio on process efficiency
To evaluate the impact of maintaining a constant SA/V ratio, experiments were conducted with adjusted electrode surface areas for 1L, 3L, and 5L volumes. The results are presented in Table 8. As expected, maintaining a constant SA/V ratio significantly improved the removal efficiencies for all parameters (TDS, TSS, color, and COD) across all volumes. For example, the COD removal efficiency for the 5L volume increased from 82% (without constant SA/V ratio) to 88% (with constant SA/V ratio). Similarly, the TSS removal efficiency improved from 90 to 94% for the 5L volume.
The improvement in removal efficiency can be attributed to the consistent current density achieved by maintaining a constant SA/V ratio. This ensures that the production of coagulants (e.g., Fe(OH)₃ and Al(OH)₃) remains proportional to the volume of wastewater treated, leading to more effective destabilization and removal of contaminants. These findings highlight the importance of optimizing electrode configuration and current density in scaling up the EC process for larger volumes of wastewater.
Sludge management
Due to the low amount of sludge produced, landfill disposal was selected as the most suitable option. The sludge was dewatered and disposed of in a controlled landfill. However, this option is less environmentally sustainable due to the potential for long-term leaching of metals and other contaminants.
To further understand the mechanisms underlying the removal of COD, kinetic studies were conducted using pseudo-first-order and pseudo-second-order models. The results of these studies are presented below, followed by an analysis of adsorption isotherms to describe the interaction between COD molecules and the adsorbent surfaces.
Kinetic studies
To conduct a kinetic analysis, first and second pseudo-order kinetic equations (linear and non-linear equations, respectively) were fitted to the performance time-course data in accordance with the COD removal concentrations.
Pseudo-first-order (PFO) concept for removing COD
Using experiments records for plotting the relation between log (qe − qt) vs time, to apply the pseudo-first-order model, is presented in Fig. 7 and the corresponding kinetic parameters (R2, slope, intercept, rate constant of pseudo-first order model “K1″, experimental and calculated COD uptake amounts ”q”) are illustrated in Table 9. As it is obvious, the R2 values are very close to 1, while there is no correlation or even closeness between the computed and experimental qe values. So, the pseudo first order model can’t represent the coagulation process.
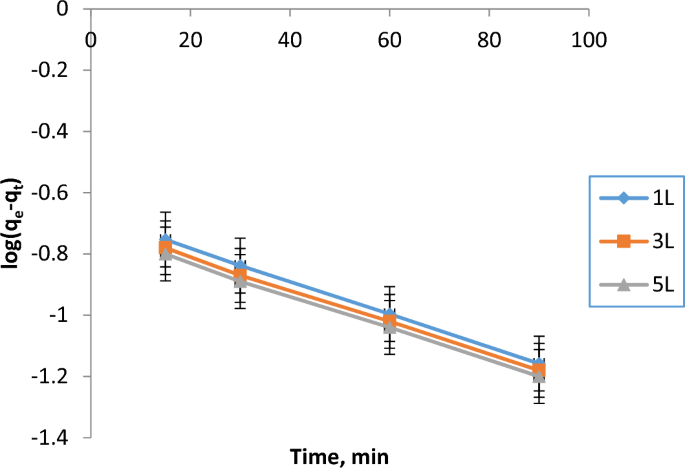
PFO model application for COD removal for 1L, 3L, and 5L.
Pseudo-second-order (PSO) concept for removing COD
Figure 8 refers to the application of the PSO model for COD remediation. From the plot (t/qt against time), the kinetic parameters are calculated (pseudo-first order rate constant “K2″, experimental and calculated COD uptake amounts ”q”). Table 10 shows these parameters. R2 is very about to 1 and the experimental & calculated COD uptakes (q) are almost identical.
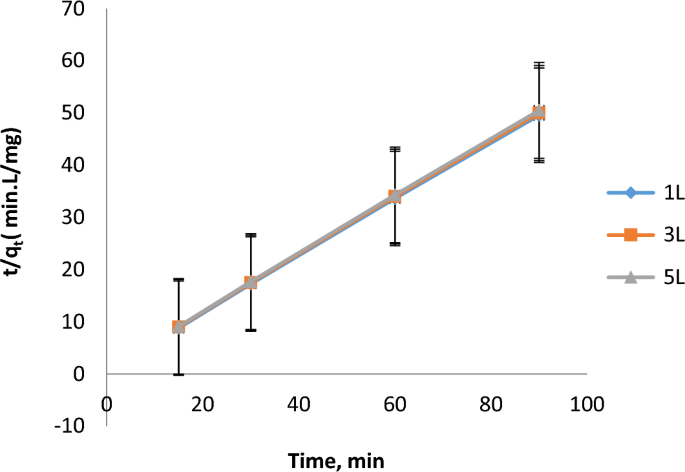
PSO model application for COD removal for 1L, 3L, and 5L.
The second-order equation gives the greatest fit to the experimental data among the two-reaction kinetic models. There is good agreement between the data acquired by31 and32 and the kinetic evaluation of the electrocoagulation treatment procedure results.
Discussion and interpretation of adsorption isotherm results
In this study, the Langmuir and Freundlich adsorption isotherm models were employed to evaluate COD removal behavior from wastewater samples of varying volumes (1 L, 3 L, and 5 L) during the electrocoagulation (EC) process. These models provide insights into the interaction between COD molecules and the surface of adsorbent particles formed during EC.”
Langmuir isotherm model
The Langmuir isotherm (Fig. 9) assumes monolayer adsorption onto a homogenous surface with a finite number of identical sites. The Langmuir equation was used to model the COD removal, and the constants KL (Langmuir constant) and qmax (maximum adsorption capacity) were calculated for the three different wastewater volumes.
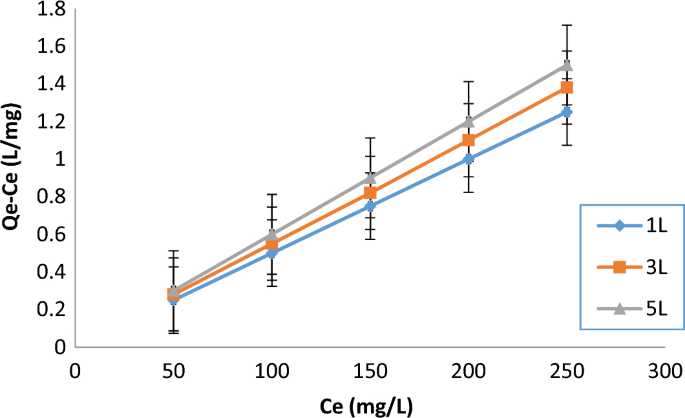
Langmuir isotherm application for COD removal for 1L, 3L, and 5L.
Langmuir isotherm results
The study shows that the Langmuir isotherm model fits well with the adsorption data across all sample volumes, as evidenced by high R2 values (0.9989, 0.9987, and 0.9985 for 1L, 3L, and 5L, respectively) as shown in Table 11, indicating that the COD removal process follows monolayer adsorption. However, as the sample volume increases, the Langmuir constant (KL) decreases from 0.20 L/mg for 1L to 0.18 L/mg for 5L, suggesting a reduced affinity of the adsorbent sites for COD molecules. This is likely due to increased competition for limited adsorption sites in larger volumes and a potential reduction in the uniformity of the electric field during electrocoagulation. Additionally, the maximum adsorption capacity (qmax) decreases from 80 mg/g for 1L to 75 mg/g for 5L, indicating that larger volumes result in fewer COD molecules being adsorbed per gram of coagulant, thus lowering the efficiency of COD removal.
The Langmuir model results demonstrate that the electrocoagulation process is most efficient for smaller volumes of wastewater (1L) as more adsorption sites are available, and the affinity between COD molecules and adsorbent sites is stronger. For larger volumes, COD molecules are less efficiently adsorbed, leading to lower removal rates. Optimizing the coagulant dose and ensuring a more uniform electric field distribution can potentially improve performance for larger volumes.
Freundlich isotherm model
The Freundlich isotherm, a model based on multilayer adsorption on a heterogeneous surface, was also applied to describe the adsorption of COD onto the coagulant particles produced during electrocoagulation. This model allows for variable affinity of adsorption sites and is often more applicable when adsorption does not reach a saturation point.
Freundlich isotherm results
The Freundlich model also demonstrated high R2 values (0.9992, 0.9990, and 0.9988 for 1L, 3L, and 5L, respectively) as shown in Table 12, indicating a good fit to the adsorption data and suggesting that the adsorption process follows multilayer adsorption with heterogeneous surface energies. As the sample volume increases, the Freundlich constant (KF, Freundlich constant, representing the adsorption capacity of the adsorbent) decreased from 30 mg/g for 1L to 26 mg/g for 5L, reflecting a reduced adsorption capacity due to saturation of adsorption sites or insufficient coagulant production for larger COD loads. Additionally, the 1/n value, which indicates adsorption intensity, increased from 0.25 for 1L to 0.35 for 5L, suggesting that the adsorption process becomes less favorable with larger volumes, likely due to less uniform coagulant distribution, which reduces adsorption effectiveness.
The Freundlich model (Fig. 10) suggests that the COD removal mechanism in this study does not occur uniformly across all adsorbent sites but rather involves multiple layers of adsorption with varying affinities. As the wastewater volume increases, the surface heterogeneity becomes more pronounced, leading to a less efficient overall adsorption process. The Freundlich model’s better fit for larger volumes may indicate the need for operational adjustments in larger-scale applications, such as modifying coagulant dosage or optimizing electrode configuration.
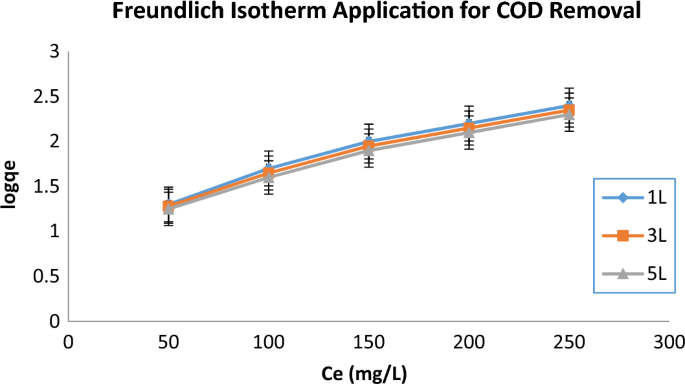
Freundlich isotherm application for COD removal for 1L, 3L, and 5L.
Both isotherm models indicate that the electrocoagulation process for COD removal is more efficient at smaller wastewater volumes. For the 1L sample, the adsorption sites are more readily available and adsorb COD molecules with higher affinity, leading to greater removal efficiencies. However, as the volume increases to 3L and 5L, the efficiency decreases, likely due to increased competition for adsorption sites and less efficient distribution of the coagulant and electric field.
The Langmuir isotherm suggests that COD adsorption occurs in a monolayer fashion, which is typical for processes where a finite number of adsorption sites are available. In contrast, the Freundlich isotherm suggests a multilayer adsorption process on heterogeneous surfaces, which might explain the decreased adsorption efficiency in larger volumes.
For effective COD removal via electrocoagulation, controlling wastewater volume is critical. While both the Langmuir and Freundlich models describe the process well for smaller volumes, adsorption efficiency decreases as volume increases, likely due to the limited number of available adsorption sites and less favorable adsorption conditions. Optimization of operational parameters such as applied voltage, coagulant dosage, and electrode configuration is necessary to improve the performance for larger wastewater volumes.
Interpretation and discussion of thermodynamic parameters
Gibbs free energy (ΔG)
The negative ΔG values across all temperatures and volumes demonstrate that the adsorption process for COD removal in electrocoagulation is spontaneous. As the temperature rises from 298 to 328 K, the ΔG values become less negative, indicating that lower temperatures are more conducive to adsorption. Furthermore, the 5L samples exhibit the most negative ΔG values, suggesting that the process is most spontaneous at higher volumes, likely due to a greater availability of adsorption sites, making the adsorption more efficient with larger volumes.
Enthalpy change (ΔH)
The negative ΔH values suggest that the adsorption process is exothermic, meaning it releases heat during the adsorption of COD, which indicates that the process is favorable. As the volume increases, the calculated ΔH values slightly decrease, implying that less heat is released with larger volumes. This could be attributed to changes in the surface area-to-volume ratio and the formation of fewer or less efficient adsorption sites in larger samples, reducing the heat generated during the adsorption process.
Entropy change (ΔS)
The positive ΔS values indicate an increase in disorder at the solid–liquid interface during adsorption, meaning that as COD molecules are adsorbed, the system becomes more random. This is typical of adsorption processes, where molecules are initially free to move in the liquid phase but become more structured upon adsorption to a surface. As the volume increases, the entropy change decreases, suggesting that the randomness at the solid–liquid interface diminishes slightly with larger volumes. This could be due to increased competition for adsorption sites in larger volumes, which reduces the mobility of the adsorbed molecules.
The thermodynamic analysis (Fig. 11) provides valuable insights into the nature of COD removal during electrocoagulation. The process is spontaneous (ΔG < 0) and exothermic (ΔH < 0), meaning that the reaction is a spontaneous one. The positive entropy change (ΔS > 0) indicates increased randomness during the process, which is typical of adsorption processes. However, as the volume of the wastewater increases, the spontaneity and efficiency of the adsorption process decrease, as seen in the less negative ΔG values and lower ΔH and ΔS values (Tables 13 and 14).
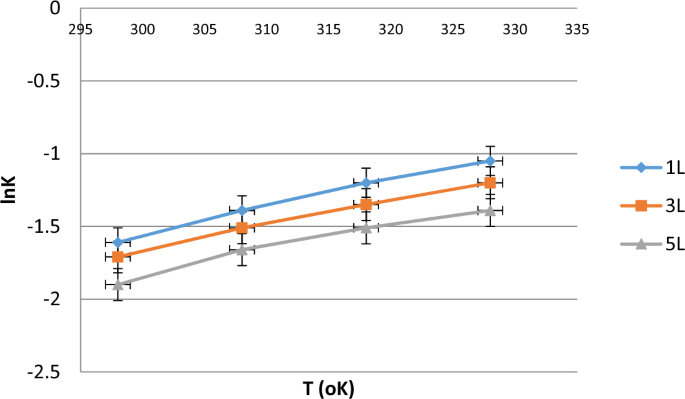
Van’t Hoff plot for different sample volumes.