Design, period and study area
We conducted a retrospective ecological study in metropolitan France for the period of 2008–2019. The data were aggregated into two six-year periods and at a quasi-ZIP code geographic level. More precisely, we chose a specific geographic division (called the PMSI21 code), which corresponds to existing ZIP codes with ≥ 1000 inhabitants in 2021 and to aggregations of neighboring ZIP codes with fewer than 1000 inhabitants [14]. For clarity and consistency, this territorial division is hereafter designated the “ZIP code”.
Data collection
TB cases
TB cases reported in metropolitan France from 2008 to 2019 were extracted from the national notifiable disease surveillance system for analysis. All forms of TB, including both pulmonary and extrapulmonary cases, were retained in the analysis. The case data included the ZIP code of the person’s usual place of residence, age, sex, countries of birth of both the individual and their parents, and whether the person lived in communal housing (yes/no). If the person lived in communal housing, the type of communal housing was specified as prison, residence for elderly people, collective shelter, or other communal housing. A single, simplified ‘housing type’ variable was constructed from these two variables: it was categorized as ‘individual housing’ when cases indicated not living in communal housing, ‘prison’ when the type of communal housing was ‘prison’, and ‘other communal housing’ otherwise. Cases with a missing or incorrect ZIP code were excluded from the analysis.
We classified cases as ‘immigrant’ or ‘native French’, adhering as closely as possible to the definition of immigrants by the French National Institute of Statistics and Economic Studies (INSEE): “An immigrant is a person born as a foreigner abroad and residing in France” [15]. Given that we only had data on the country of birth, individuals were classified as ‘immigrants’ if they were born outside of France and either both parents were foreign-born or data on parental countries of birth were unavailable. All other cases were classified as ‘native French’.
Socioeconomic area-level data
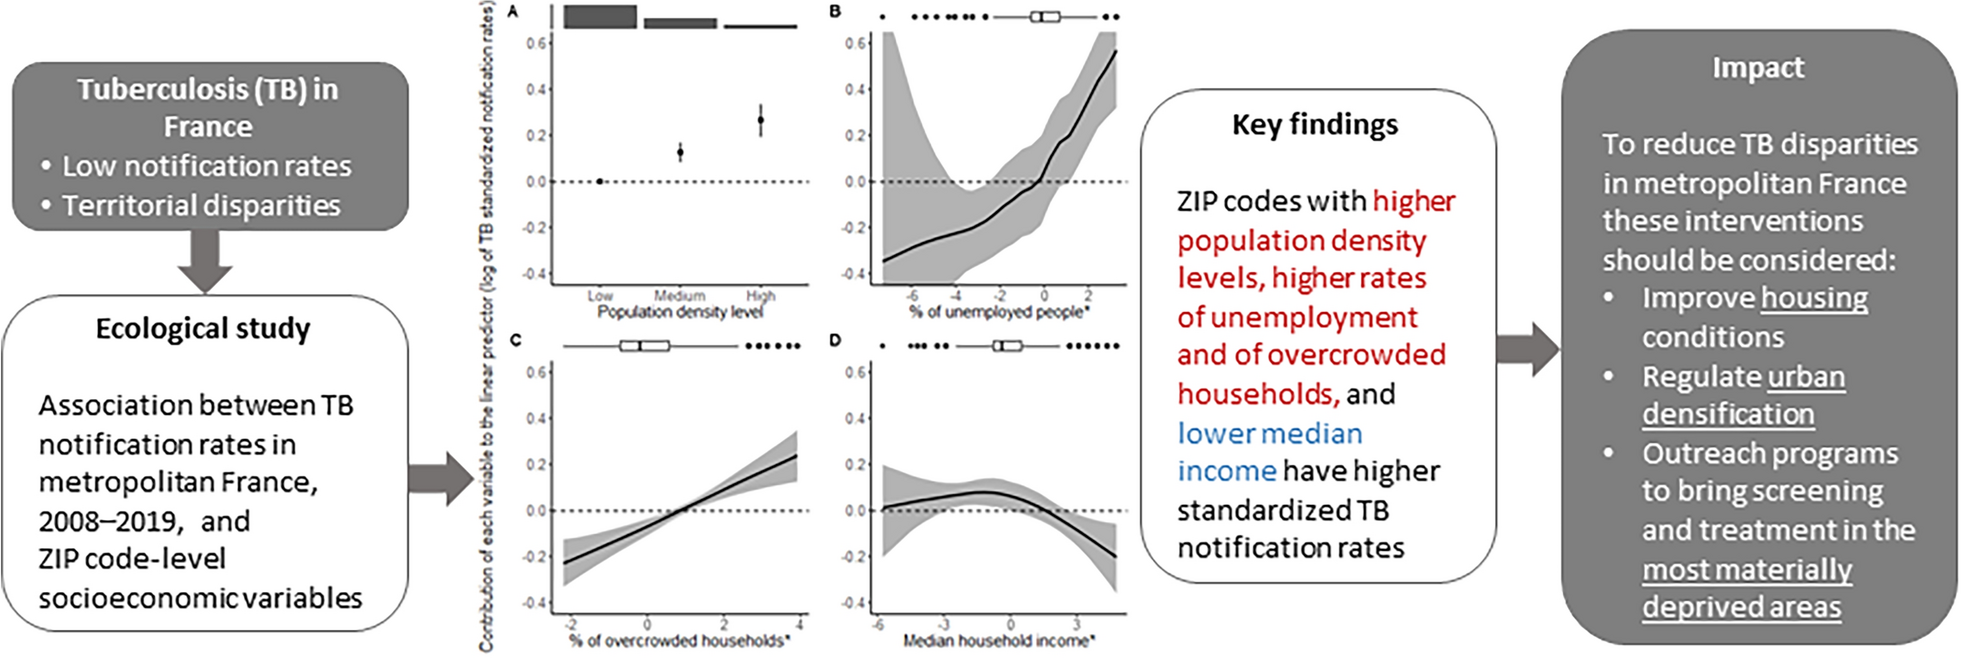
We examined the associations at the ZIP code level between TB notification rates and multiple socioeconomic variables provided by INSEE. These variables were selected based on documented risk factors for TB in low-endemic countries from the literature. Initially, we analyzed the following variables separately: median household income per consumption unit, the proportion of high school graduates in the unschooled population aged 15 years and older, the proportion of manual workers in the active population aged 15–64 years, and the unemployment rate among the active population aged 15–64 years. We then estimated the associations between TB notification rates and a social deprivation indicator that combines these four variables, known as the French Deprivation Index (FDep) [16]. Additionally, we measured the associations between TB notification rates and the proportion of overcrowded households (see definition in the Supplementary Information) [17], as well as the population density level (Low, Medium, or High) [18].
For the first period, continuous variables were derived from municipal or sub-municipal datasets from the 2009 or 2010 censuses, whereas for the second period, they were obtained from the 2015 and 2016 censuses (see Supplementary Table 1). We primarily utilized population-weighted means to calculate ZIP code-level values for most continuous variables. However, for the median household income per consumption unit, we employed population-weighted medians. The population density level of municipalities was consistent across both periods, as data was solely available from the 2010 census. To establish ZIP code population density levels, we computed the cumulative number of inhabitants in 2010 for each density level within the municipalities corresponding to the same ZIP code [19].
Statistical analysis
Standardization
We calculated the notified TB case counts in metropolitan France across all strata defined by each of the two studied periods (2008–2013 and 2014–2019), age group (0–14, 15–24, 25–44, 45–64, and 65 years or older), sex (male, female), immigration status (immigrant, native), and housing category (individual housing, prison, other communal housing). Missing values were present in the last four variables, and were imputed using the k-nearest neighbors (kNN) imputation method implemented in the R package VIM [20]; see the supplementary file for more details. The reference notification rate was calculated in each stratum by dividing the number of notified TB cases by the corresponding population in metropolitan France, derived from the 2010 and 2016 censuses (ad hoc files provided by INSEE).
Finally, the reference notification rates were multiplied by the population of each stratum in each ZIP code (using 2010 and 2016 as reference years for the periods 2008–2013 and 2014–2019, respectively) and summed to obtain the expected number of TB cases by ZIP code and period.
Modeling
The number of TB cases notified in ZIP code i in period t, ({n}_{i,t}), was assumed to follow a Poisson distribution of mean ({E}_{i,t}{lambda }_{i}), with ({E}_{i,t}) being the expected number of TB cases notified in ZIP code i and period t and ({lambda }_{i,t}) a relative risk known as the standardized notification rate (SNR).
$${n}_{i,t}sim Poissonleft({{lambda }_{i,t}E}_{i,t}right)$$
We modeled ({lambda }_{i,t}) via ({alpha }_{0}), a constant, ({b}_{i}), a spatial random effect, and explanatory variables. The median household income per consumption unit, the proportion of high school graduates in the unschooled population aged ≥ 15 years, the proportion of manual workers in the active population aged 15–64 years, the proportion of unemployment rate among the active population aged 15–64 years, and the proportion of overcrowded households were log-transformed to reduce distribution skewness. All the continuous explanatory variables were then standardized by period and entered into the model with smoothed functions:
$$textrm{log}left( {lambda_{i,t} } right); = ,alpha_{0} + b_{i} + f_{k} left( {X_{i,t}^{k} } right),$$
Where ({X}_{i,t}^{k}) is the standardized measure of the ({k}^{th}) explanatory variable in ZIP code i and period t and where ({f}_{k}) is an order 2 random walk function. We opted to standardize the explanatory variables by period due to our primary interest in their spatial contrasts within each period. Additionally, changes in the data collection method occurred between 2010 and 2016, particularly concerning the median household income per consumption unit.
We modeled the effect of the population density level with dummy variables:
$$textrm{log}left( {lambda_{i,t} } right); = ,alpha_{0} + b_{i} + alpha_{1} I_{i}^{Medium} + alpha_{2} I_{i}^{High} ,$$
Where ({I}_{i}^{Medium}) (respectively(, {I}_{i}^{High})) was equal to 1 if the population density level was ‘Medium’ (respectively, ‘High’) in ZIP code i, 0 otherwise.
The spatial random effect, ({b}_{i}), was employed to model spatial autocorrelation and residual variations in the standardized TB notification rates. These residual variations could be linked, for example, to territorial disparities in the completeness of the reporting system. ({b}_{i}) was assigned a BYM2 distribution [21], which includes a spatially structured component, ({u}_{i}), following a standardized intrinsic conditional autoregressive model, and a random component, ({v}_{i}), following a standard normal distribution: ({b}_{i}=frac{1}{sqrt{{tau }_{b}}}left(sqrt{1-phi }{v}_{i}+sqrt{phi }{u}_{i}right)), with (frac{1}{{tau }_{b}}), the marginal variance of ({b}_{i}).
We utilized the deviance information criterion (DIC) to identify the variables most strongly associated with TB notification rates; lower DIC values indicated a better fit. We subsequently tested whether the association between socioeconomic variables and TB notification rates changed between periods by adding a time × period interaction to each univariable model. In practice, we modeled the nonlinear effect of the continuous variables using a second-order random walk model specific to each period, with both models sharing the same hyperparameters. The interaction effect of the population density level with the period was modeled using a factor × factor interaction term. We assessed the relevance of the interaction terms by graphically examining the overlap of the period-specific effects (and their credible intervals).
We ultimately developed a multivariable model incorporating variables with the lowest DIC values and minimal correlation to avoid multicollinearity:
$$textrm{log}left({lambda }_{i,t}right)={alpha }_{0}+{b}_{i}+{f}_{1}left({X}_{i,t}^{1} right)+dots +{f}_{K}({X}_{i,t}^{K})+{alpha }_{1}{I}_{i}^{Medium}+{alpha }_{2}{I}_{i}^{High}$$
Associations with explanatory variables
Based on the multivariable model, we examined the shape of the association between each explanatory variable and the logarithm of the SNR (log-SNR, the linear predictor of the models). To that effect, we plotted the partial contribution of each variable ({X}^{k}) to the linear predictor, ({widehat{f}}_{k}left({X}_{i,t}^{k}right)), along with its 95% credible interval (95% CrI). This approach allowed us to identify which explanatory variables contributed significantly to the predictions.
To assess the extent of the SNR variation across the distribution of each explanatory variable, we calculated the ratio of the SNRs at their 10th and 90th percentiles and labeled it the “inter-decile standardized rate ratio” (IdRR). In this, we adopted an approach proposed by Larsen et al. [22, 23] in the context of multilevel logistic regression models, where they developed the “interval odds ratio” to reflect the variation in the odds ratio due to random effects in the linear predictor. Similarly, Chaix et al. developed the “interquartile spatial odds ratio”, defined as the odds ratio between an individual residing in a location in the first quartile and one from a location in the fourth quartile of spatial risk.
Sensitivity analyses
To assess the robustness of our findings to the chosen distribution of the spatial random effect, we replaced the BYM2 distribution with the Leroux distribution [24] and reran the model without explanatory variables as well as the multivariable model. Like the BYM2 model, the Leroux model comprises both structured and unstructured components but differs in their parameterization (see supplementary file section 4.2.1 for further details).
We also evaluated the sensitivity of the analysis to the chosen imputation method (kNN) by imputing missing values using two alternative approaches. Initially, we utilized the random forest imputation algorithm from the R package missForest [25]. Subsequently, we proportionally distributed the missing values across strata defined by sex, age group, immigration status, and housing type, utilizing information from cases with similar characteristics. Further details are provided in supplementary file section 5.1.
All statistical analyses were performed using R version 4.2.3 [26] and INLA version 22.12.16 [27, 28].