Markets feel like they’ve been stuck in a range for many months now. In fact, after the excitement of reciprocal tariffs in early April and the collapse in the Dollar thereafter, there really wasn’t much further action in 2025. That said, though markets look quiet on the surface, there’s several areas where tensions are building. Today’s post runs through five of these.
-
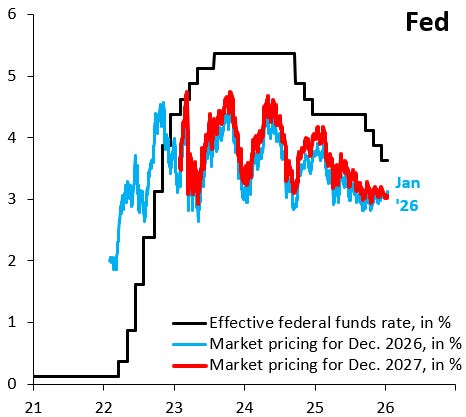
Markets price only two Fed cuts through end-2027: the black line in the chart below shows the Fed’s policy rate alongside what interest rate futures price for end-2026 (blue line) and end-2027 (red line). The White House spent a lot of time in 2025 leaning on the Fed to cut, so I find it completely implausible that we get only two cuts through 2027, especially with a new Trump-appointed Fed Chair. Markets are pricing “business as usual,” when it doesn’t seem like we’ll get that.
-
The Dollar looks vulnerable: I spent much of 2025 pushing back on all the apocalyptic Dollar talk, which struck me as overly emotional. A key barometer for me is how the Dollar is holding up against emerging markets (EM), which in my mind offers a better gauge for market sentiment than G10 crosses. As the blue line in the chart below shows, the Dollar has been falling steadily against EM since the Dec. 10 Fed cut. If the Fed ends up easing more than is priced – to my first point – the Dollar could fall a lot further.

-
Japan’s Yen is increasingly distressed: the Dollar isn’t the only currency that’s in trouble. As the black line in the chart below shows, the trade-weighted Yen has fallen to an all-time low versus the G10, even as long-term rate differentials have moved sharply in favor of the Yen (blue line). This kind of decoupling is a telltale indication of fiscal distress and parallels the UK bond market blow-up in 2022. Japan is trapped by its high public debt. Yen depreciation is the safety valve.

-
The Euro zone stumbles towards deflation: a large output gap has been opening up in Germany and markets are starting to recognize this. As the blue line in the chart below shows, 5y5y forward breakeven inflation is only 0.4 percent, which is – stunningly – below COVID levels. The ECB has been doing things it shouldn’t – it’s morphed into a fiscal bailout agency for high-debt sovereigns – and thinks a hawkish stance on interest rates will absolve it of its sins. What it’s really doing is compounding one error with another. A major policy mistake is unfolding here, which will only end when Germany puts its foot down at the ECB.

-
The debasement trade roars ahead: towards the end of 2025, there were lots of questions whether year-end dynamics were driving precious metals higher and whether the start of the new year would see a sharp pull-back. As the chart below shows, that clearly hasn’t happened. All indications are that the debasement trade is much stronger than any of us had expected. As crazy as it sounds, I think this means precious metals can go a lot higher.
