We began by collecting COCs from large antral follicles of eCG-primed mice and incubating them in medium supplemented with EGF to induce expansion. After 4 h of incubation, no change in the volume of the COCs was apparent, as assessed by measuring the surface area of optical images (Fig. 1A, B). By 8 h of incubation, the surface area had increased by a factor of 3.18 ± 0.15 (mean, sem, p < 0.0001) as compared to the 0 h group. Thus, EGF-triggered expansion of COCs begins 4–8 h after addition of the ligand. This is similar to the timing of expansion in vivo after injection of human chorionic gonadotropin, which activates the LH receptor46,47 and in vitro after adding EGF48. We therefore focused the subsequent studies within this time range.
COCs were collected from eCG-primed mice and incubated with recombinant EGF for 8 h. At 0, 4, and 8 h after initial EGF exposure, brightfield pictures (A) were taken to assess cumulus cell displacement by measuring the COC area (B). COCs were fixed and stained with an antibody raised against di-phosphorylated MYL9 (C) to assess NMII activation (D). COCs were also stained with phalloidin (c) to assess cell morphology and the percentage of membrane blebbing cells (E). Ovary sections obtained 0, 4 or 8 h post hCG injections were stained with anti- di-phosphorylated MYL9 (F) to assess in vivo NMII activation (G). DNA is shown in light blue, filamentous actin (F-actin) in red, and ppMYL9 foci in yellow. White arrowheads indicate membrane blebs. The number of values recorded for each group was B Fresh: 36, 4 h EGF: 60, 8 h EGF: 45. D Fresh: 33, 4 h EGF: 43, 8 h EGF: 27. E Fresh: 3, 4 h EGF: 3, 8 h EGF: 3. F 0 h: 18, 4 h post hCG: 23, 8 h post hCG: 32.
To study the potential role of NMII in cumulus cell displacement during expansion, COCs were treated with EGF as above, fixed and stained with an antibody previously used to detect the active di-phosphorylated form of MYL9 (ppMYL9) by immunofluorescence in numerous cell types including mouse embryos49,50,51, as well as with phalloidin to label the cell cortex, then examined using confocal microscopy. Prior to EGF treatment, a small number of fluorescent foci were visible in some cumulus cells (Fig. 1C, D). No change was observed after 4 h. By 8 h post-EGF, however, the number of foci had increased almost three-fold (2.81 ± 0.33, p < 0.0001) compared to the 0 h group. This increase was substantially attenuated in the presence of a chemical inhibitor of EGFR signaling, AG1478, confirming that it was dependent on activation of EGFR (Supplemental Fig. S1A, B). We also observed that the percentage of cells containing membrane blebs remained statistically unchanged between 0 h and 4 h post-EGF (3.61 ± 1.81 vs 13.8 ± 2.74, p = 0.2) but had increased substantially by 8 h (68.06 ± 5.37, p < 0.0001) (Fig. 1C, E). A focal pattern of MYL9 immunostaining in blebbing cells has previously been reported52.
To test whether NMII became activated during cumulus layer expansion in vivo, we examined histological sections of ovarian antral follicles following injection of human chorionic gonadotropin (hCG, an LH analogue) into equine chorionic gonadotropin-primed mice. We found that, as observed in vitro in response to EGF, the number of foci remained unchanged between 0 h and 4 h post-hCG and then increased by 8 h (Fig. 1F, G). In contrast, no increase was detectable in the mural granulosa cells (Supplemental Fig. S1C, D). Thus, NMII activity in the cumulus cells of COCs increases between 4 and 8 h after exposure to EGF in vitro or injection of hCG in vivo.
We then tested whether NMII activity was required for cumulus cell displacement. COCs were treated with EGF in the presence of para-amino blebbistatin (PAB), which specifically binds and inhibits the ATPase subunit of NMII, preventing actomyosin contraction53. As PAB does not block MYL9 phosphorylation, its effectiveness could not be tested using anti-ppMYL9 immunofluorescence. We instead examined cell blebbing as a readout of NMII activity. Blebs were apparent in most cumulus cells of COCs exposed to EGF alone, but in very few of those exposed to EGF and PAB (Fig. 2A, B). This result implies that, as expected, PAB inhibited NMII activity. The cumulus cells of COCs exposed to PAB also often manifested an elongated ‘tail’ (Fig. 2A, dotted lines). We quantified this using a morphological descriptor, the cell elongation index (CEI), defined as the ratio between cell length and width (Fig. 2C). While the cumulus cells from freshly collected COCs and the ones from COCs exposed exclusively to EGF presented a CEI around 1 (0.86 ± 0.21 vs. 1.16 ± 0.21, p = 0.2156), the cumulus cells of COCs exposed to the inhibitor reached a CEI greater than 2, denoting an elongated morphology. We then assessed expansion, by measuring the surface area in images of COCs treated with EGF and PAB for 8 h. Whereas the area increased about 3-fold in the control group (2.91 ± 0.17 vs. 1.00 ± 0.01, p < 0.0001), the increase was reduced in a dose-dependent manner in the presence of PAB, declining to 1.46 ± 0.07 at 100 µM (p < 0.0001 vs EGF alone) (Fig. 2D, E). Thus, NMII activity is required for full expansion. Because expansion depends on the production of the hyaluronan matrix that provides the substrate for cell displacement, we tested whether PAB affected expression of the genes whose activation is required for matrix production. No change in the quantity of the encoded mRNAs (Fig. 2F) or TNFAIP6 expression (Supplemental Fig. S2) was detectable, implying that the drug did not impair the ability of the cells to produce the matrix. Taken together, these results indicate that NMII activity is required for cumulus cell displacement during expansion.
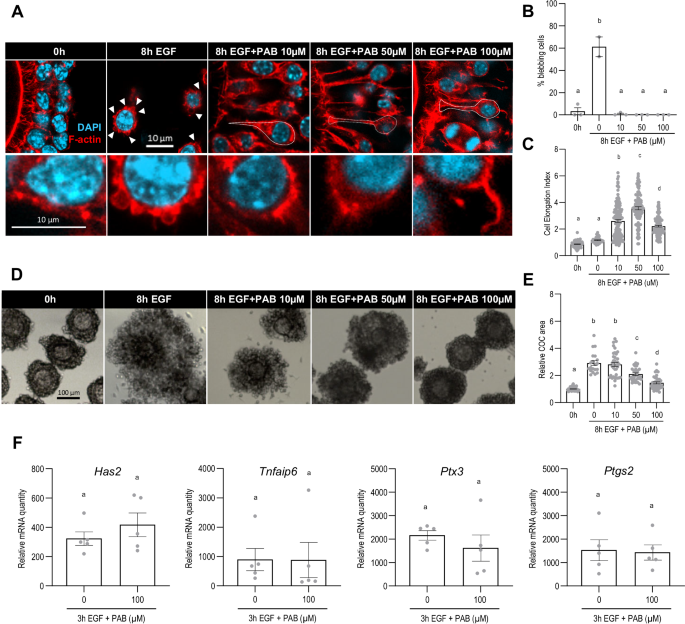
COCs were collected from eCG-primed mice and incubated with recombinant EGF for 8 h with or without the molecular inhibitor of NMII ATPase, para-amino Blebbistatin (PAB), at a final concentration of 10, 50 or 100 µM. COCs were fixed and stained with phalloidin (A) to assess the percentage of blebbing cumulus cells (B, insets in A) and their morphology by measuring the Cell Elongation Index (CEI, ratio between cell length and cell width) (C). DNA is shown in light blue, and filamentous actin (F-actin) in red. White arrowheads show membrane blebs, and dotted lines highlight cell morphology. Cumulus cell displacement was assessed based on brightfield pictures obtained before and after the culture (D) by measuring the COC area (E). In (F), COCs were collected from eCG-primed mice and incubated with recombinant EGF for 3 h with or without PAB at a final concentration of 100 µM. COCs were harvested for quantitative PCR analysis to assess mRNA quantity of cumulus matrix-related genes Has2, Tnfaip6, Ptx3, and Ptgs2. The number of values recorded for each group was B Fresh: 3, 8 h EGF: 3, 8 h EGF + PAB 10 μM: 3, 8 h EGF + PAB 50 μM: 3, 8 h EGF + PAB 100 μM: 3. C Fresh: 110, 8 h EGF: 63, 8 h EGF + PAB 10 μM: 142, 8 h EGF + PAB 50 μM: 98, 8 h EGF + PAB 100 μM: 127. E Fresh: 73, 8 h EGF: 29, 8 h EGF + PAB 10 μM: 52, 8 h EGF + PAB 50 μM: 31, 8 h EGF + PAB 100 μM: 55. F Fresh: 5, 8 h EGF: 5, 8 h EGF + PAB 10 μM: 5, 8 h EGF + PAB 50 μM: 5, 8 h EGF + PAB 100 μM: 5.
The ERK pathway is a key downstream effector of EGFR signaling and cumulus expansion is blocked when the pathway is pharmacologically inhibited or genetically disabled21,22. We therefore tested whether ERK signaling mediated the activation of NMII. U0126, a widely used inhibitor of ERK signaling, inhibited cumulus layer expansion (Fig. 3A, B) and blocked transcriptional up-regulation of the expansion-enabling genes (Supplemental Fig. S3) in EGF-treated COCs, confirming these well-established functions21,22. In contrast, the number of ppMYL9 foci per cell increased in the presence of EGF and U0126 as compared to pre-treatment controls (2.67 ± 0.24 vs 1.00 ± 0.08, p < 0.0001), although it remained below the number observed in COCs exposed to EGF alone (3.51 ± 0.23, p = 0.02) (Fig. 3C, D). Similarly, the percentage of cells that contained blebs increased in COCs treated with EGF and U0126 compared to pre-treatment controls (32.89 ± 6.39 vs 8.64 ± 1.10, p = 0.01), although not to the same extent as EGF alone (73.16 ± 1.70, p < 0.0001) (Fig. 3C, E). These results indicate that, in contrast to its essential role in up-regulating expression of the expansion-related genes, ERK signaling is not required for EGFR-dependent activation of NMII. Therefore, we sought other pathways that might mediate this response.
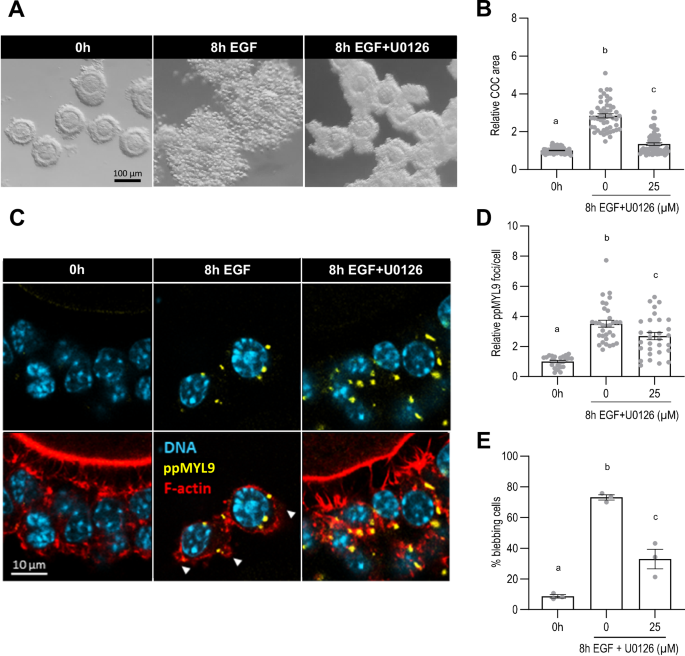
COCs were collected from eCG-primed mice and incubated with recombinant EGF for 8 h with or without the ERK signaling inhibitor U0126 at a final concentration of 25 µM. Brightfield images of the COCs (A) were acquired to assess cumulus cell displacement by measuring the COC area (B). COCs were fixed and stained with anti- di-phosphorylated MYL9 (C) to assess NMII activation (D). COCs were also stained with phalloidin (C) to assess cell morphology and the percentage of membrane-blebbing cells (E). DNA is shown in light blue, filamentous actin (F-actin) in red, and ppMYL9 foci in yellow. White arrowheads show membrane blebs. The number of values recorded for each group was B Fresh: 99, 8 h EGF: 51, 8 h EGF + U0126: 68. D Fresh: 28, 8 h EGF: 34, 8 h EGF + U0126: 32. E Fresh: 3, 8 h EGF: 3, 8 h EGF + U0126: 3.
As discussed in the Introduction, RhoA and its downstream effectors, ROCK1/2, can be activated by EGF and trigger activation of NMII. We tested whether EGF acts through RhoA to activate NMII during expansion in two ways. First, we collected and cultured COCs for 8 h in the presence of EGF and Y27632 (Y27), an inhibitor of ROCK activity. Whereas the number of ppMYL9 foci increased by a factor of 5.13 ± 0.43 in the COCs treated with EGF alone, the fold-increase was only 3.26 ± 0.32 (p = 0.0009 vs EGF alone) and 3.17 ± 0.24 (p = 0.0013 vs EGF alone) in the COCs also exposed to Y27 at a concentration of 10 µM and 50 µM, respectively (Fig. 4A, B). Consistent with this result, virtually none of the cells exposed to Y27 at these concentrations generated blebs (Fig. 4A, C). Rather, many cells were elongated with the long axis oriented radially with respect to the COC, a morphology that strikingly resembles that of COCs exposed to PAB (Fig. 2A). Moreover, the extent of cumulus layer expansion was significantly, albeit modestly, reduced in the presence of Y27 (EGF alone: 1.76 ± 0.04; 50 µM: 1.46 ± 0.03, p < 0.0001) (Fig. 4D, E).
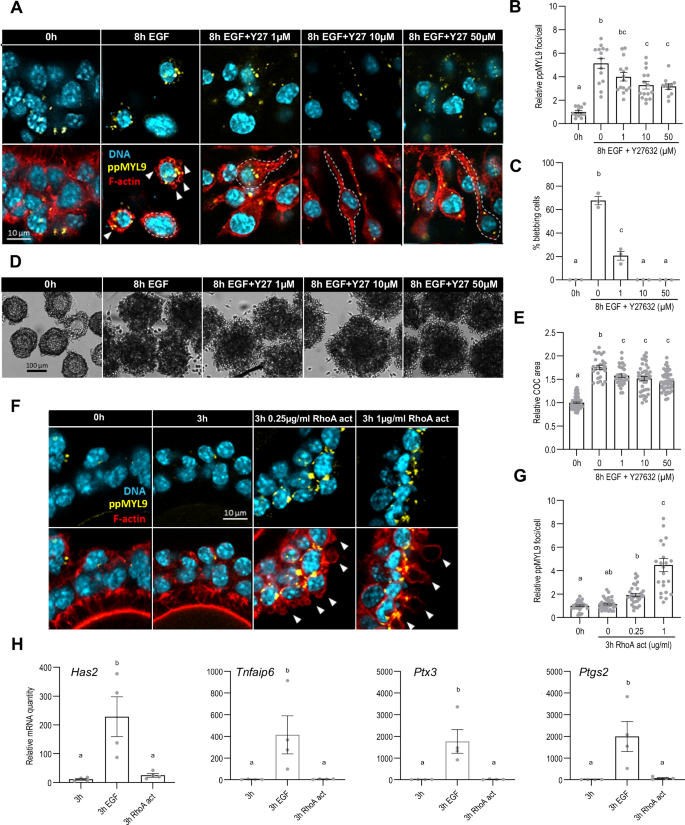
COCs were collected from eCG-primed mice and incubated with recombinant EGF for 8 h with or without Y27632 (Y27), a ROCK inhibitor, at final concentrations of 1, 10, or 50 µM. COCs were fixed and stained with anti-di-phosphorylated MYL9 (A) to assess NMII activation (B). COCs were also stained with phalloidin (A) to assess the percentage of membrane-blebbing cells (C). DNA is shown in light blue, filamentous actin (F-actin) in red, and ppMYL9 foci are shown in yellow. White arrowheads show membrane blebs and dotted white lines show cumulus cell morphology. Cumulus cell displacement was assessed based on brightfield pictures obtained before and after the culture (D) by measuring the COC area (E). In (F, G, H), COCs were incubated with a RhoA activator (RhoA act) at final concentrations of 0, 0.25 or 1 µg/ml and then stained with anti-di-phosphorylated MYL9 (F) to assess NMII activation levels (G). COCs cultured for 3 h either in plain media, with recombinant EGF or with RhoA activator (1 µg/ml) alone were submitted to quantitative PCR analysis to assess mRNA quantity of the matrix-related genes Has2, Tnfaip6, Ptx3, and Ptgs2 (H). The number of values recorded for each group was B: Fresh: 15, 8 h EGF: 18, 8 h EGF + Y27 1 μM: 19, 8 h EGF + Y27 10 μM: 18, 8 h EGF + Y27 50 μM: 18. C: Fresh: 3, 8 h EGF: 3, 8 h EGF + Y27 1 μM: 3, 8 h EGF + Y27 10 μM: 3, 8 h EGF + Y27 50 μM: 3. E Fresh: 89, 8 h EGF: 28, 8 h EGF + Y27 1 μM: 32, 8 h EGF + Y27 10 μM: 43, 8 h EGF + Y27 50 μM: 49. G Fresh: 31, 3 h: 34, 3 h 0.25 μg/ml: 31, 3 h 1 μg/ml: 23. H Fresh: 4, 3 h EGF: 4, 3 h RhoA act: 4.
Next, COCs were cultured for 3 h in the presence of a chemical activator of RhoA in the absence of EGF. This brief period of exposure was chosen to favor detection of direct effects of the activator. The results revealed a dose-dependent increase in the number of ppMYL9 foci in the presence of the activator (1 µg/ml: 4.47 ± 0.55 vs 1.00 ± 0.07, p < 0.0001) (Fig. 4F, G). Notably, the magnitude of the increase at 1 µg/ml was similar to the increase that is induced by EGF (Fig. 1D). At this concentration, almost all cumulus cells displayed blebs (Fig. 4F). Importantly, in contrast to its ability to activate NMII and cell blebbing, the RhoA activator did not increase expression of the expansion-associated genes (Fig. 4H). Because the hyaluronan matrix was not produced in the presence of the RhoA activator alone, it was not possible to assess displacement of the cumulus cells. These results support the idea that RhoA mediates the EGF-induced activation of NMII in the cumulus cells. Conversely, it does not mediate EGF-induced up-regulation of the expansion-enabling genes.
Although Y27 reduced EGF-induced MYL9 di-phosphorylation and impaired cumulus layer expansion, both remained elevated compared to pre-treatment COCs (Fig. 4B, E). MYL9 can also be phosphorylated by MRCK, which is activated by the Rho family member CDC42. To investigate its role, COCs were treated with EGF in the presence of BDP9066 (BDP), a highly selective inhibitor of MRCK54. Whereas the number of ppMYL9 foci increased about four-fold after 8 h in the presence of EGF alone compared to the 0 h control (3.81 ± 0.38 vs 1.00 ± 0.09, p < 0.0001), this increase was reduced to two-fold in the presence of BDP (10 µM: 1.89 ± 0.16, p < 0.0001 vs EGF alone; 50 µM: 2.08 ± 0.23, p < 0.0001 vs EGF alone) (Fig. 5A, B). BDP also attenuated the increase in the percentage of cells showing blebs following EGF treatment (0 h: 6.62 ± 3.73; EGF alone: 58.69 ± 1.09; 10 µM: 18.59 ± 4.71; 50 µM: 2.22 ± 2.22; p < 0.0001 vs EGF alone) (Fig. 5A, C), and impaired cumulus layer expansion (EGF alone: 2.99 ± 0.09; 10 µM: 2.27 ± 0.06; 50 µM: 1.84 ± 0.04; p < 0.0001 vs EGF alone) (Fig. 5D, E). We then examined the effect of blocking both ROCK and MRCK. The increase in the number of ppMYL9 foci observed after addition of EGF (2.82 ± 0.28 vs 1.00 ± 0.10, p < 0.0001) was largely prevented in the presence of Y27 and BDP (1.35 ± 0.13 vs 2.82 ± 0.28, p < 0.0001) (Fig. 5F, G). Cell blebbing was completely blocked (Fig. 5F, H) and cumulus layer expansion was considerably attenuated (3.39 ± 0.13 vs 1.72 ± 0.05, p < 0.0001) (Fig. 5I, J).
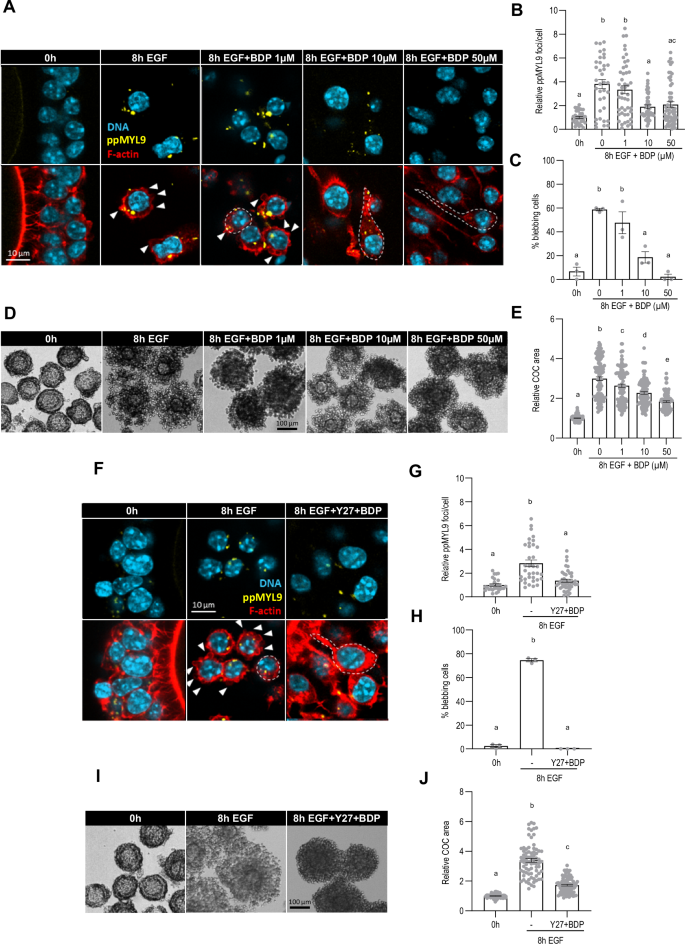
COCs were collected from eCG-primed mice and incubated with recombinant EGF for 8 h with or without BDP9066, an MRCK inhibitor, at final concentrations of 1, 10, or 50 µM. COCs were fixed and stained with anti-di-phosphorylated MYL9 (A) to assess NMII activation (B). COCs were also stained with phalloidin (A) to assess the percentage of membrane blebbing cells (C). DNA is shown in light blue, filamentous actin (F-actin) in red, and ppMYL9 foci are shown in yellow. White arrowheads show membrane blebs, and dotted white lines show cumulus cell morphology. Cumulus cell displacement was assessed based on brightfield pictures obtained before and after the culture (D) by measuring the COC area (E). In (F–J), COCs were incubated with recombinant EGF for 8 h with or without Y27632 and BDP9066 at a final concentration of 50 µM each. COCs were fixed and stained with anti-di-phosphorylated MYL9 (F) to assess NMII activation (G). COCs were also stained with phalloidin (F) to assess the percentage of membrane blebbing cells (H). Cumulus cell displacement was assessed based on brightfield pictures obtained before and after the culture (I) by measuring the COC area (J). The number of values recorded for each group was B Fresh: 25, 8 h EGF: 20, 8 h EGF + BDP 1 μM: 24, 8 h EGF + BDP 10 μM: 19, 8 h EGF + BDP 50 μM: 25. C Fresh: 3, 8 h EGF: 3, 8 h EGF + BDP 1 μM: 3, 8 h EGF + BDP 10 μM: 3, 8 h EGF + BDP 50 μM: 3. E Fresh: 176, 8 h EGF: 83, 8 h EGF + BDP 1 μM: 90, 8 h EGF + BDP 10 μM: 86, 8 h EGF + BDP 50 μM: 103. G Fresh: 29, 8 h EGF: 35, 8 h EGF + Y27 + BDP: 53. H Fresh: 3, 8 h EGF: 3, 8 h EGF + Y27 + BDP: 3. J Fresh: 91, 8 h EGF: 76, 8 h EGF + Y27 + BDP: 90.
The experiments described so far established that NMII activity is required for displacement of the cumulus cells in response to EGF, but did not demonstrate that it conferred the ability to actively migrate. We tested this in two ways. First, COCs were submitted to a transwell migration assay, where the ability of cells to migrate across a membrane is quantified42,55. COCs were incubated for 4 h in the presence of CNP to maintain the non-expanded condition or EGF to induce cumulus layer expansion. They were then transferred to the upper surface of cell membrane inserts placed in wells containing media supplemented with either CNP or EGF and incubated overnight (about 16 h), after which the inserts were fixed and stained. The migration index of the EGF group was about 10-fold greater than the control CNP group (11.02 ± 1.54, p < 0.0001) (Fig. 6A, B), establishing that cumulus cells acquired the ability to migrate in response to EGF. Blocking the activity of NMII using PAB decreased the relative migration index to 1.46 ± 0.57 (p < 0.0001 vs EGF), and blocking its activation (ie, phosphorylation of MYL9) by targeting either or both of ROCK and MRCK reduced the migration index to the same extent.
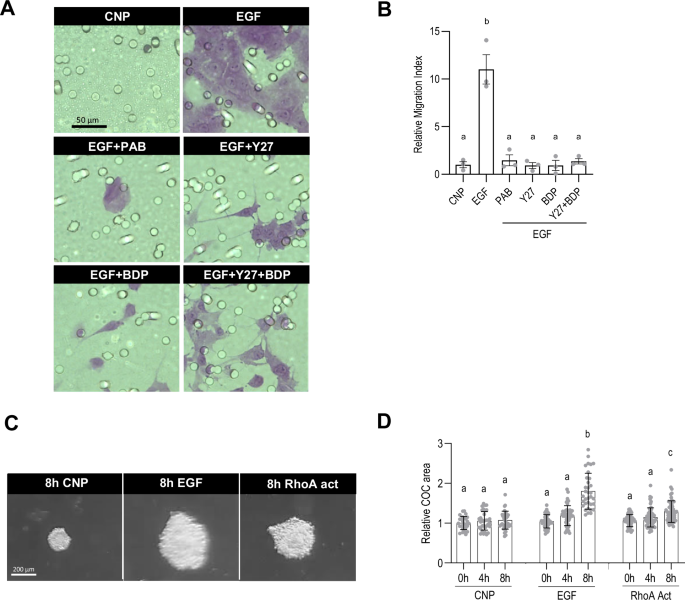
COCs were collected from eCG-primed mice and incubated for 4 h in one of the following conditions: CNP (100 nM), recombinant EGF alone or with the addition of inhibitors targeting NMII (PAB, 100 µM), ROCK (Y27632, 50 µM), MRCK (BDP9066, 50 µM), or ROCK + MRCK (Y27632 + BDP9066, 50 µM each). Transwell migration assays were then performed in the presence of the inhibitors, with either CNP or EGF in the bottom chamber. After an overnight incubation, the membranes were fixed, stained (A) and the images used to quantify the relative migration index for each condition (B). COCs collected from eCG-primed mice were also embedded in commercial hyaluronan hydrogels, and exposed to either CNP, EGF or RhoA act (RhoA activator). Cumulus cell migration was assessed based on brightfield pictures obtained at 0, 4, and 8 h after the start of the culture (C) by measuring the COC area (D). The number of values recorded for each group was B: EGF: 3, PAB: 3, Y27: 3, BDP: 3, Y27 + BDP: 3. D: CNP 0 h: 27, CNP 4 h: 33, CNP 8 h: 37, EGF 0 h: 44, EGF 4 h: 48, EGF 8 h: 34, RhoA act 0 h: 42, RhoA act 4 h: 53, RhoA act 8 h: 58.
Next, we reasoned that if the COCs were embedded in a substrate that supported cell migration, the RhoA activator might trigger this process even in the absence of the endogenous hyaluronan matrix. Freshly isolated COCs were embedded in a commercially supplied hyaluronan matrix and incubated for 8 h in the presence of CNP, EGF, or RhoA act (Fig. 6C, D). No change in the diameter of the COCs occurred in the presence of CNP, whereas it had increased significantly by 8 h after addition of EGF (1.71 ± 0.07 vs 1.00 ± 0.02 at 0 h, p < 0.0001), demonstrating that expansion could occur under these experimental conditions. Strikingly, the COC diameter also increased 8 h after addition of the RhoA activator (1.28 ± 0.03 vs 1.04 ± 0.02 at 0 h, p < 0.0001). The reduced expansion triggered by RhoA activator as compared to EGF may indicate that the commercial hyaluronan matrix is less supportive of migration than the endogenous matrix, which also contains other components. Thus, activation of RhoA in intact COCs is sufficient to trigger migration of the cumulus cells.
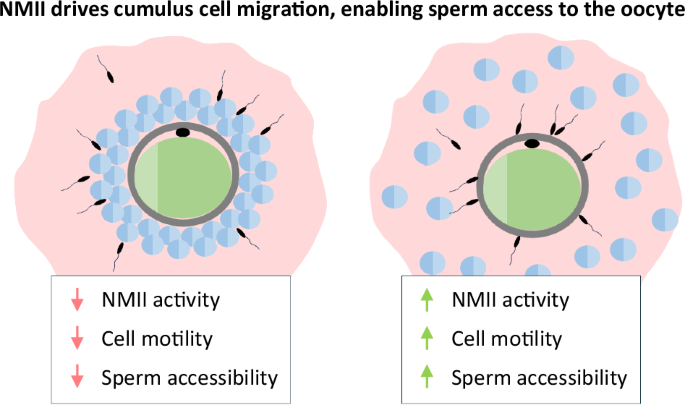
Finally, we examined whether blocking NMII impaired the ability of sperm to penetrate through the cumulus cell layers to reach the oocyte. COCs were incubated for 8 h in the presence of EGF, in the presence or absence of the inhibitors of NMII activity. During this period, sperm were collected and incubated in the presence of Hoechst 22378, a fluorescent dye that stains the DNA of living cells, but without the NMII inhibitors to avoid potential effects on sperm motility. After washing, sperm and COCs were incubated together in the absence of the inhibitors for 1 h. The COCs were then fixed, imaged, and the number of sperm that had reached the neighborhood of the oocyte, as defined by a circle whose diameter was 15% larger than the oocyte, thus approximating the thickness of the zona pellucida, was counted. In each experiment, the values were normalized to the value obtained for COCs treated with EGF alone, whose mean was set to one.
The number of sperm that were able to penetrate through the cumulus cell layers was decreased to 0.19 ± 0.02 in the COCs expanded in the presence of PAB (p < 0.0001 vs EGF) (Fig. 7). The inhibitors of ROCK and MRCK similarly reduced the number of penetrating sperm compared to the EGF group – to about half when applied individually and to 0.14 ± 0.02 when applied together (p < 0.001 vs EGF for all treatment conditions). Notably, the number of sperm that were associated with the COCs remained unchanged among the different experimental groups (Supplemental Fig. S4), implying that the sperm ability to reach the COCs was not impaired. These results indicate that NMII-dependent cumulus cell migration is required for efficient penetration through the cumulus matrix by sperm.
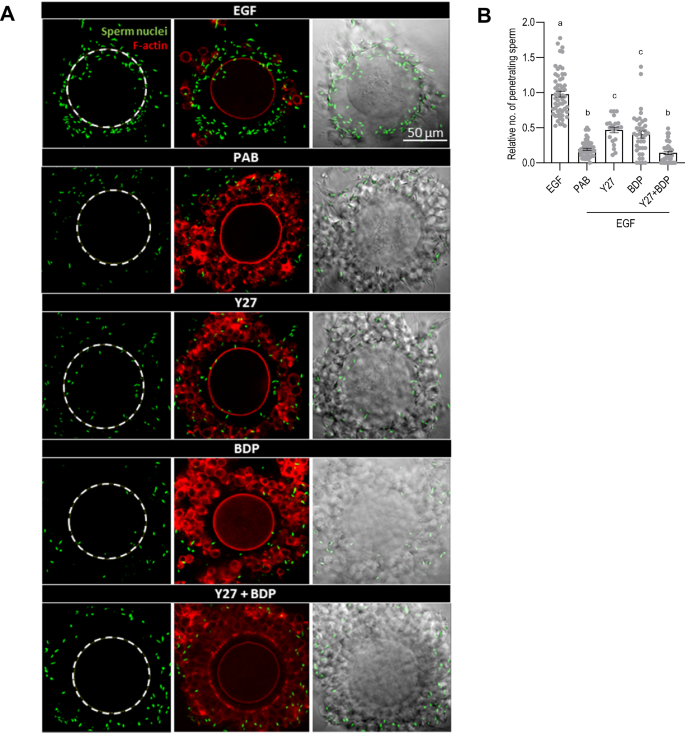
COCs were collected from eCG-primed mice and incubated for 8 h in one of the following conditions: recombinant EGF alone or with the addition of inhibitors targeting NMII (PAB, 100 µM), ROCK (Y27632, 50 µM), MRCK (BDP9066, 50 µM), and ROCK + MRCK (Y27632 + BDP9066, 50 µM each). COCs were washed and incubated with nuclei-stained and capacitated sperm. After 1 h, the complexes were fixed, stained with phalloidin and imaged (A). The images were used to quantify the number of sperm close to the oocyte (i.e., inside drawn dotted circle) (B). Sperm nuclei are shown in green and filamentous actin (F-actin) in red. The number of values recorded for each group was B: EGF: 58, PAB: 51, Y27: 28, BDP: 31, Y27 + BDP: 42.