Enhanced growth in E. coli LG101 through cscR deletion predominantly observed under aerobic conditions
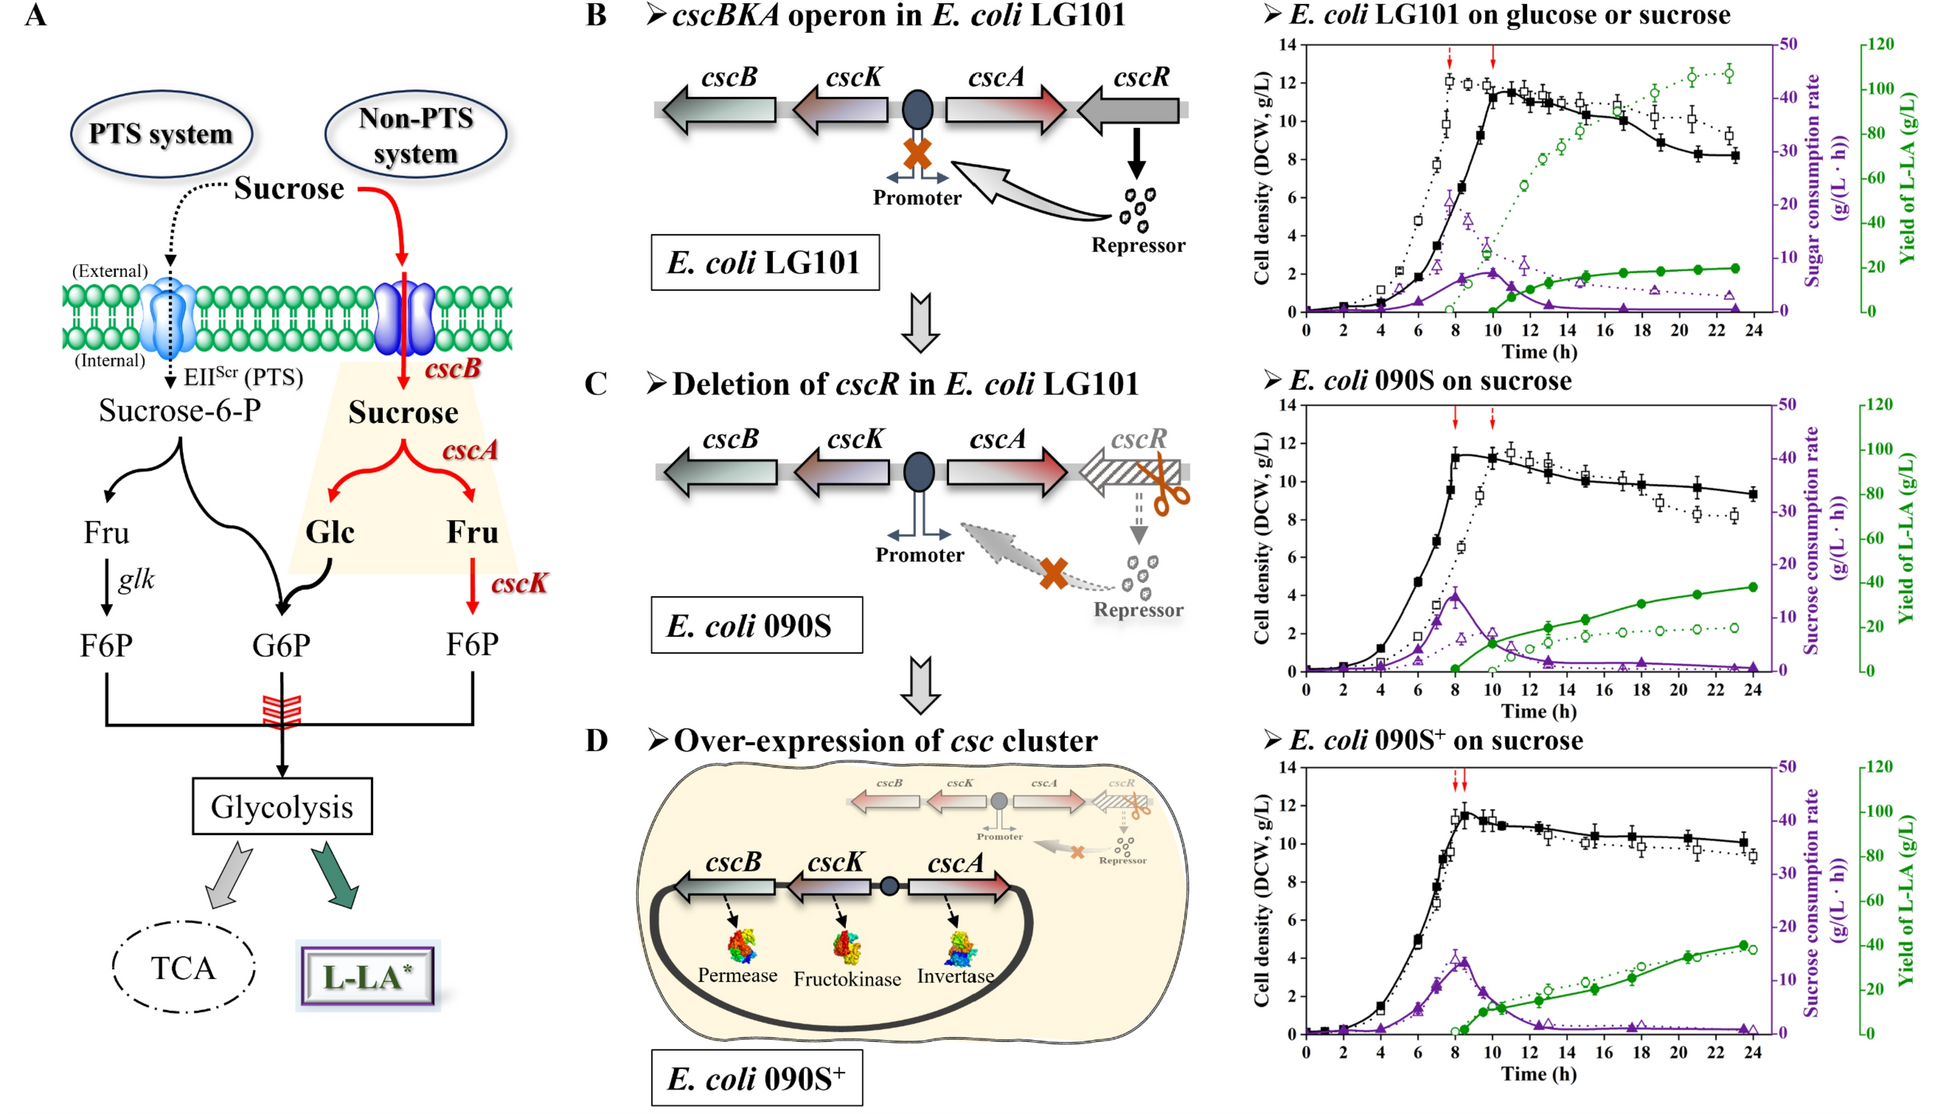
Two pathways for sucrose metabolism in strains have been extensively studied, as delineated in Fig. 1A. The first pathway, the sucrose-6-phosphotransferase system (sucrose PTS) [39], involves the uptake and phosphorylation of sucrose to sucrose-6-phosphate in a phosphoenolpyruvate (PEP)-dependent manner, which is subsequently hydrolyzed by intracellular sucrose invertase into glucose-6-phosphate and fructose. However, the metabolism of sucrose in E. coli is mainly achieved through a non-PTS sucrose metabolism system. The non-PTS sucrose system encompasses a proton symport transport system (encoded by cscB), an invertase (encoded by cscA), a fructokinase (encoded by cscK), and a regulatory repressor (encoded by cscR) [16].
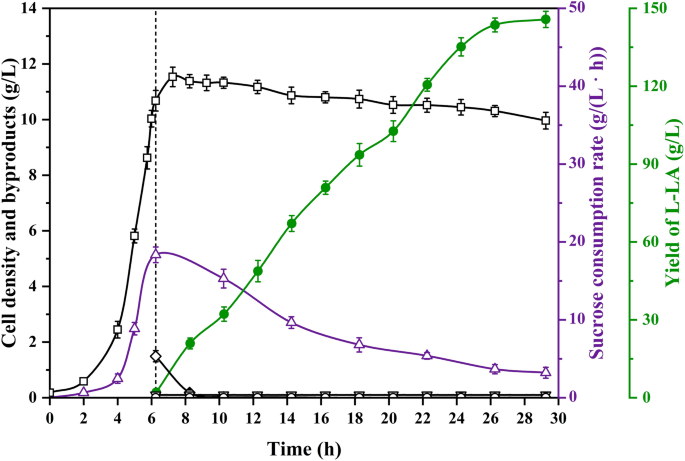
The possible role of cscBKA operon for sucrose metabolism in E. coli. A The overview of sucrose metabolism pathways in E. coli. B Left: The structure of cscBKA operon in E. coli. Right: L-LA producing E. coli LG101 metabolized glucose (dot lines) or sucrose (solid lines) to yield cell density (square), glucose or sucrose consumption rate (triangle) and yield of L-LA (circle). C Left: Deletion of cscR in E. coli LG101; Right: Cell density (square), sucrose consumption rate (triangle) and L-LA formation (circle) with strain 090S (solid lines) comparison with that of strain LG101 (dot lines). D Left: E. coli 090S+ was developed with E. coli 090S carrying a multiple copy number recombinant plasmid pSK-csc. Right: Its cell density (square), sucrose consumption rate (triangle) and L-LA formation (circle) was measured of strain 090S+ (solid lines) comparison with that of strain 090S (dot lines). The red arrow indicates the point in time when fermentation transitions from aerobic to anaerobic. The fermentation test was carried out in a 5-L bioreactor with glucose or sucrose as sole substrate. Genes encoding related enzymes are indicated in italics and include: cscB, sucrose permease; cscK, fructokinase; cscA, sucrose invertase; glk, glucokinase. The remaining abbreviations are as follows: Glc, glucose; Fru, fructose; G6P, glucose-6-phosphate; F6P, fructose-6-phosphate; TCA, tricarboxylic acid cycle; L-LA*: the strain producing L-LA was developed previously [9]
Previously, we reported on a L-LA-producing strain, E. coli LG101 (ack–pta pps pflB dld poxB adhE frdA ldhA lldD::ldhAp–ldhBcoa pflCD pflEF tdcE), that produces a high level of L-LA using glucose as the carbon source and has a low level of by-products [28]. This study found that strain LG101 was capable of utilizing sucrose as a carbon source to produce L-LA by a non-PTS system, but its growth rate, sucrose consumption rate, and L-LA production capacity were both lower than those when glucose was used (Fig. 1B). Previous studies have demonstrated that the deletion of cscR, which negatively regulates the csc locus, markedly enhances sucrose uptake rates [18]. Accordingly, cscR in strain LG101 was excised, resulting in strain 090S. Subsequently, fermentation experiments were carried out in a 5-L bioreactor with sucrose as carbon source, and the results showed that the growth rate, the maximum sucrose consumption rate, and the L-LA yield of 090S were increased by 20%, 93%, and 92%, respectively, compared with strain LG101 (Fig. 1C). However, compared with the fermentation of strain LG101 using glucose as carbon source, the aerobic growth rate of strain 090S was the same, but the anaerobic L-LA yield was only 35.6%. Despite advancements in enhancing sucrose catabolism efficiency through laboratory adaptive evolution [25, 26], the underlying causes of this phenotype remain elusive, and L-LA production levels have not been optimized relative to controls. It is hypothesized that the observed limitations in sucrose transport and conversion, potentially attributable to insufficient transcription or transcription levels of csc cluster (cscB, cscK and cscA) under anaerobic conditions, may impede cell metabolism on sucrose. Therefore, we tried to overexpress the csc cluster, including cscB, cscK, and cscA, by cloning the csc cluster in a multiple copy plasmid, pSK-csc, and transformed it into strain 090S, resulting in strain 090S+. The fermentation experiments on sucrose with strain 090S+ were then examined. The results showed that the utilization efficiency of sucrose in strain 090S+ was not consequently improved under either aerobic or anaerobic conditions, as shown in Fig. 1D. This finding suggests that the metabolism of sucrose in E. coli LG101 is likely governed by more complex regulatory mechanisms and that simply increasing gene dosage by using the native oxygen-sensitive promoter is insufficient, thus necessitating the promoter replacement strategy. Adapting the operon’s functionality to meet the needs of lactic acid monomer synthesis in specific engineering contexts could be a viable approach for leveraging this strain to generate lactic acid monomers using sucrose as the primary carbon source. Such optimization has the potential to enhance the efficiency and feasibility of bioproduction in industrial settings, highlighting the importance of further research into the regulatory networks at play.
Transcriptomic insights into E. coli‘s response to oxygen availability
The aforementioned results strongly suggest that a detailed analysis of the metabolic characteristics of E. coli, particularly during the anaerobic fermentation stage of lactic acid monomer synthesis, is essential for understanding the metabolic processes involved in synthesizing lactic acid monomers from sucrose. As shown in Fig. 2A, this investigation focused on three critical phases of the 090S strain in the aerobic and anaerobic transition. During the aerobic exponential growth phase, the cell density (OD600) reached about 10 (approximately 5.5 h, marked as S1); the strain was in an active state, and both the cell density and sucrose consumption rate gradually increased. In the anaerobic fermentation phase, the sucrose metabolic rate drops sharply and stabilizes (approximately 3 h, marked as S2); the strain grew slowly, and the production of L-LA gradually increased. In the aerobic recovery phase, the strain completely returned to the aerobic growth state; the cell density increased rapidly, and L-LA was completely consumed (approximately 3 h, marked as S3). This phenomenon confirms the previous conjecture that the metabolism of sucrose by E. coli is regulated by oxygen.
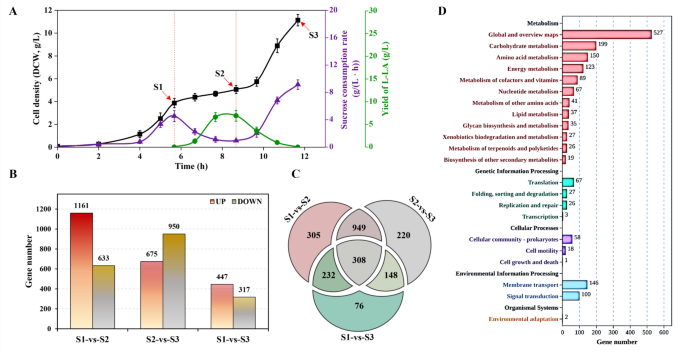
The transcriptional analysis of 090S strain with sucrose as carbon source. A The time courses of cell density (solid squares), sucrose consumption rate (solid triangles) and L-LA formation (circles) of cells sampled for transcriptome analysis. Red lines indicate the time points when fermentation switched from aerobic to anaerobic (dotted line) and from anaerobic to aerobic (solid line). B The number of genes with up- or down-regulation between different fermentation stages. C The Venn diagram of DEGs at different fermentation stages. D The KEGG enriched pathway analysis of DEGs in aerobic/anaerobic conversion fermentation. The “S1”, “S2”, and “S3” indicate the transcriptional profiles of the exponential growth phase, anaerobic fermentation phase, and aerobic recovery phase, respectively
To elucidate the impact of oxygen availability on E. coli growth on sucrose at a transcriptomic scale, we conducted a comprehensive analysis wherein E. coli cultures, utilizing sucrose as the primary carbon source, were subjected to RNA extraction and subsequent transcriptome sequencing. Differential gene expression analysis revealed a total of 1794 genes with significant expression changes in the S2 stage compared to S1, with 1161 genes being upregulated and 633 downregulated. In the S3 stage, 1625 genes exhibited differential expression, with an upregulation in 675 genes and a downregulation in 950 genes, and the comparison between S1 and S3 identified 764 differentially expressed genes (DEGs) (Fig. 2B). These genes were rigorously selected based on an absolute fold change (FC) of ≥ 2 (or log2 |FC|≥ 1) and a false discovery rate (FDR) below 0.05. Additionally, the Venn diagram in Fig. 2C identifies the shared DEGs between different fermentation conditions (S1-vs-S2, S2-vs-S3, and S1-vs-S3). The results showed that 1257 genes were enriched during the conversion process of aerobic and anaerobic fermentation. Among them, 308 genes still showed significant differences in expression levels after returning to aerobic conditions, which means that these genes were more susceptible to the influence of oxygen levels.
Further classification of these DEGs through KEGG pathway analysis illuminated their distribution across several key pathways, notably within “metabolic” and “environmental information processing” categories. This encompassed pathways such as “carbohydrate metabolism”, “amino acid metabolism”, “energy metabolism”, “global and overview maps”, “membrane transport”, and “signal transduction” (Fig. 2D). The differential expression of these transcripts under varying oxygen conditions underscores a broad metabolic reprogramming, highlighting the intricate relationship between oxygen levels and transcriptomic adaptations. This reprogramming not only sheds light on the metabolic flexibility of E. coli in response to oxygen availability but also lays the groundwork for optimizing L-LA production through engineered metabolic pathways.
Dynamic expression patterns of the differentially expressed genes
To elucidate the impact of oxygen availability on sucrose metabolism, we meticulously categorized DEGs into eight distinct expression profiles (ranging from profile 0 to 7) during various fermentation stages (S1, S2, and S3), as delineated in Fig. 3A–H). This classification was carried out using the Short Time-series Expression Miner (STEM) software, revealing significant variances in gene expression patterns across these stages. Notably, profiles 5 and 2 emerged as significantly overrepresented (p < 0.05), indicating distinct transcriptional responses to the aerobic–anaerobic transition (Fig. 3A, B). Specifically, profile 5 encompassed 1260 gene transcripts that exhibited an increase in expression from S1 (aerobic phase) to S2 (anaerobic phase), followed by a decline in S3 (resumption growth phase). Conversely, profile 2 was characterized by a reduction in the expression of 803 gene transcripts exclusively during S2. Additionally, an upsurge in expression was observed in 735 gene transcripts during S2 (profiles 6 and 7; Fig. 3C, G), whereas 288 gene transcripts demonstrated a decrease following the shift to anaerobic conditions (profiles 0 and 1; Fig. 3F, H), and 603 gene transcripts did not change significantly compared to S1 (profiles 3 and 4; Fig. 3D, E). To further understand the biological implications of these transcriptional alterations, we identified the five most significantly enriched KEGG pathways in each profile that had significant change trends in the first two phases. Intriguingly, profiles 5, 6, and 7 predominantly exhibited an increasing trend in gene expression from S1 to S2, significantly enriching pathways such as the two-component system, porphyrin metabolism, mismatch repair, DNA replication, and nucleotide excision repair (Fig. 3A, C and G). In contrast, the 1091 DEGs within profiles 0, 1, and 2 displayed a decreasing expression trend from S1 to S2, highlighting a potential bottleneck in anaerobic sucrose metabolism, particularly in oxidative phosphorylation and ribosome pathways, where a significant reduction in transcript abundance was observed (Fig. 3B, F and H).
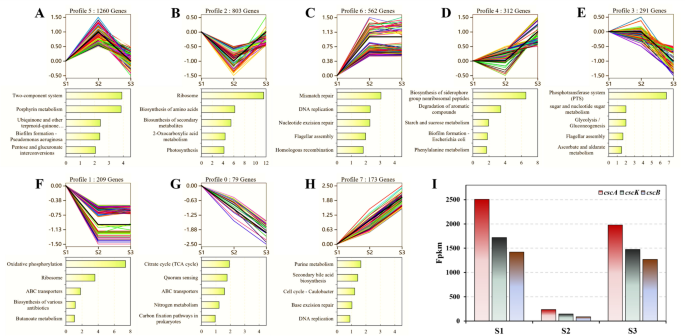
Dynamic expression pattern analysis of differentially expressed genes (DEGs). The dynamic expression patterns of differentially expressed genes (DEGs) in three stages (S1, S2, and S3), which were grouped into eight significant clusters (p < 0.05) based on the similarity of their abundance profiles (A–H). Below each cluster, the top five most significantly enriched KEGG pathways are graphically represented according to their adjusted p-values. I Comparison of FPKM values of the csc operon genes
Moreover, our focused analysis on the csc operon, pivotal for sucrose catabolism, unveiled a consistent expression pattern across cscB, cscK, and cscA, with cscA showing the highest expression, followed by a sequential decrease in cscK and cscB (Fig. 3I). This trend aligns with prior findings by Carruthers et al. [22], and suggests a structural influence of the csc operon on gene expression, potentially through reverse transcriptional regulation of cscB and cscK within the same operon, and separate transcription of cscA. Remarkably, all three genes experienced a significant reduction in expression during S2, retaining less than 10% of their expression levels compared to S1, a phenomenon likely attributable to the restrictive effects of low oxygen levels on the transcription of csc operon genes, particularly impacting the activation of the csc promoter (Fig. 3I). This insight underscores the intricate relationship between oxygen availability and the regulation of sucrose metabolism in E. coli, highlighting potential avenues for optimizing lactic acid monomer production from sucrose through targeted genetic manipulation.
Exploration of promising candidate promoters for enhanced anaerobic sucrose metabolism in E. coli
The above analysis revealed that the sucrose metabolism process of E. coli is aerobic in nature, which is opposite to the anaerobic biosynthesis process of lactic acid monomer. Therefore, we sought to make the key genes of the csc operon of sucrose metabolism also functional under anaerobic conditions through genetic modification, which is the most likely way to directly achieve efficient synthesis of lactic acid monomer from sucrose. This research marks a pioneering approach in the rational enhancement of industrial microbial strains for sucrose metabolism under anaerobic conditions, diverging from the conventional method of adaptive laboratory evolution. It posits that promoters linked to genes exhibiting elevated expression during the anaerobic phase (S2) are likely to possess robust transcription initiation capabilities under similar conditions. Drawing upon the above analysis of anaerobic-induced gene transcription levels, this study systematically identified potential candidate promoters that could significantly augment sucrose catabolism in an anaerobic environment.
Initially, an examination of the entire genome, comprising 3689 genes, led to the identification of 323 genes specifically involved in “carbohydrate metabolism” (Fig. 4A). Subsequent comparative analysis between the S1 and S2 phases revealed 144 genes with upregulated expression and 110 genes with downregulated expression, applying a threshold of a false discovery rate (FDR) < 0.05 and an absolute Log2 fold change > 1. The upregulated genes were then prioritized based on their expression levels (quantified by FPKM values), with the top 20 exhibiting significantly higher expression levels. These were further categorized into three tiers based on FPKM values, with thresholds set at 1300 and 5000, respectively (Fig. 4B).
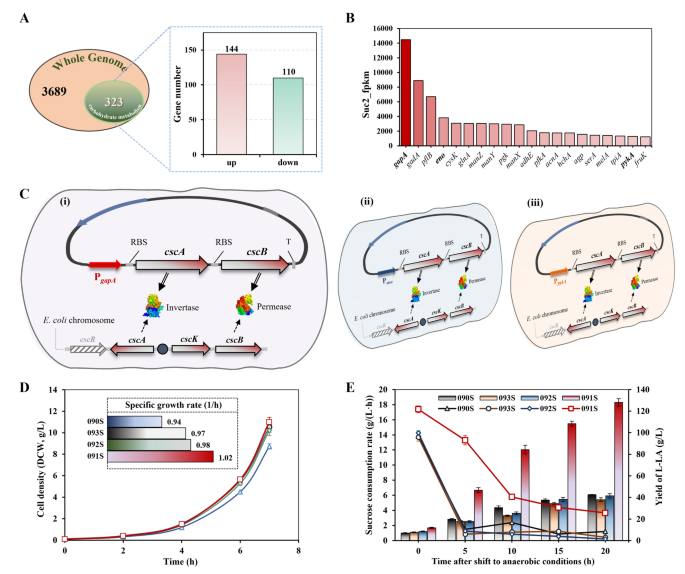
Mining potential promoters and comparison of L-LA fermentation parameters. A The number of genes with up- or down-regulation involved in “carbohydrate metabolism” in the whole genome identified. B Comparison of FPKM values of the top 20 genes in S2. C Construction of recombination strains with different promoters driving cscA and cscB expression plasmids. D Comparison of cell density during aerobic phase. E Comparison of L-LA production (histogram) and sucrose consumption rate (solid lines) during anaerobic phase. PgapA, Peno, and PpykA: Promoters that control the transcriptional initiation of genes encoded by glyceraldehyde-3-phosphate dehydrogenase A, enolase, and pyruvate kinase 2, respectively. RBS: ribosome-binding site, T: terminator
From this refined selection, three promoters, PgapA (b1779, coding for glyceraldehyde-3-phosphate dehydrogenase A), Peno (b2779, coding for enolase), and PpykA (b1854, coding for pyruvate kinase 2), were used as exemplars of strong, moderate, and weak transcriptional activity under anaerobic conditions, respectively. These promoters were chosen to supplant the native promoter of the cscA and cscB genes. The construction of the new expression vectors incorporating these selected promoters is depicted in Fig. 4C. The resulting recombinant plasmids pSK01-cscA/B, pSK02-cscA/B, and pSK03-cscA/B were then transformed into strain 090S, resulting in the recombinant strains 091S, 092S, and 093S.
To ascertain the enhancements in anaerobic sucrose metabolism achieved through promoter replacement, the modified E. coli strains were fermented in a 5-L bioreactor. Comparative analysis of fermentation parameters across all strains under identical conditions is depicted. During the aerobic phase, cell densities were measured, with findings illustrated in Fig. 4D. Compared with the control strain 090S, the time for the modified strain 091S to reach a DCW of 9.5 g/L (equivalent to a cell density (OD600) of 25) and specific growth rate were marginally reduced by 6% and increased by 8%, respectively, suggesting that sucrose utilization in E. coli 090S can be modestly improved through the co-overexpression of cscB and cscA. Prior research has demonstrated that overexpression of cscAB significantly enhances sucrose utilization in strains previously incapable of sucrose metabolism. Contrarily, during the anaerobic phase, neither the sucrose consumption rate nor the L-LA production rate showed improvement across all strains [19]. Despite the high expression levels of the three selected genes at the S2 stage, only 091S exhibited a significant enhancement in fermentation performance. Specifically, the sucrose consumption rate of 091S was maintained at over 30% of the initial rate (approximately threefold that of the control) during 10 h of anaerobic fermentation, with the highest L-LA production observed (Fig. 4E). This improvement is likely attributable to the elevated expression level of gapA, indicating enhanced transcription initiation efficiency of PgapA. While transcriptomics identified Peno and PpykA as anaerobically active promoters, strains 092S and 093S failed to enhance L-LA production, suggesting that a certain expression threshold may be required to overcome the defect in sucrose metabolism under anaerobic conditions, or that Peno and PpykA may have more complex transcriptional regulatory mechanisms. Notably, the L-LA production and sucrose consumption rates of the other three strains exhibited similar trends during the anaerobic phase, with optimal fermentation performance maintained for approximately 3 h before experiencing a sharp decline. After 5 h of anaerobic fermentation, the sucrose consumption rates of strains 090S, 092S, and 093S were reduced to 10.7%, 6.2%, and 7.6%, respectively. This phenomenon may be linked to the half-life of the enzymes invertase and permease, encoded by cscA and cscB, which, after initial accumulation during aerobic growth, gradually lose activity, impairing the strain’s ability to express new proteins as fermentation progresses, thereby sharply reducing L-LA production.
A comparative analysis of the fermentation parameters between the engineered 091S strain and the control 090S strain during the anaerobic phase. The control strain 090S produced L-LA at 42.6 g/L with a productivity of 1.42 g/(L·h) (Fig. 4E). In contrast, the 091S strain achieved an L-LA concentration of 129.7 g/L in the final broth, and the productivity was 4.32 g/(L·h), which was 304.2% higher than the 090S strain (Fig. 4E). This is one of the recombinant E. coli strains with the highest L-LA production utilizing sucrose as a carbon source reported to date [13, 26]. Additionally, minimal levels of pyruvate and succinate were observed as major by-products, and neither formate nor acetate was detected at the end of L-LA fermentation.
High productivity of L-LA in recombinant E. coli was achieved utilizing sucrose as sole carbon source
As observed above, only E. coli 091S using PgapA showed a better ability to produce L-LA using sucrose. Therefore, the production performance and application value of E. coli 091S were further confirmed under the conditions of 30-L bioreactor scale-up fermentation. The fermentation results are compared in Fig. 5 and Table 3. The L-LA yield of strain 091S using sucrose was 145.7 g/L and contained only a small amount of succinate by-product. The average volumetric productivity of L-lactic acid was 6.62 g/(L·h) in the oxygen-limited fermentation phase, and the conversion rate of sucrose to L-LA was 102.1% (g/g) (Table 3). To the best of our knowledge, this study achieved the highest level of L-LA from sucrose using recombinant E. coli, which is similar to the results of our previous report on the L-LA production level of strain B0013-090B3 using glucose as the carbon source [9].
The time courses of dry cell mass, sucrose consumption rate, yield of L-LA and by-products during fermentation of E. coli 091S in a 30-L bioreactor. The dotted line indicates the transition time from aerobic to anaerobic phase. Open square: cell density, upward-pointing triangle: sucrose consumption rate, solid circle: L-LA, open diamond: pyruvate, downward-pointing triangle: succinate, open circle: acetate
In present studies, transcriptome analysis revealed that the expression level of the cscBKA operon under anaerobic conditions was extremely low, which led to the low efficiency of the strain’s anaerobic sucrose metabolism. This reflects that E. coli, as a facultative anaerobic bacterium, is not only regulated by the cscR gene when metabolizing sucrose, but also affected by a variety of environmental factors such as sucrose concentration, among which oxygen content is a critical factor [16, 19, 27]. In addition, the fermentation of L-LA by E. coli is an anaerobic bioprocess, which is naturally inconsistent with the low efficiency of anaerobic metabolism of sucrose. Therefore, a promoter replacement strategy was developed for csc genes of sucrose metabolism in E. coli. By using anaerobically active promoter PgapA, the expression of cscA and cscB was successfully activated under anaerobic conditions, breaking the metabolic bottleneck and providing sufficient substrate supply for efficient anaerobic production of L-LA.