ANN predictive accuracy
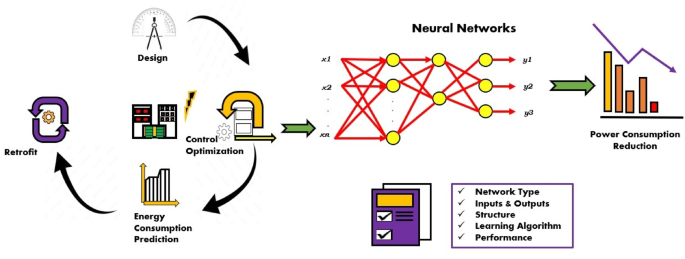
The neuron number in the hidden layer of the FFBP ANN model was varied by trial and error. With R2 > 0.92 for all parameters, the single-layer structure with three neurons (Fig. 5) exhibited the highest descriptive accuracy. Figure 6 shows the fluctuation in R2 with respect to the number of neurons in the buried layer. The optimal arrangement to prevent the propensity of overfitting was determined by selecting the least number of neurons with a decent accuracy, even though a larger number of neurons yielded better accuracy (Fig. 7). The ANN predictions for the experimental data listed in Table 2. The MSE fluctuations and correlation coefficients (R) across the training, validation, and testing stages are shown in Figs. 8 and 10, respectively.
‘2-3-3’ ANN topology.
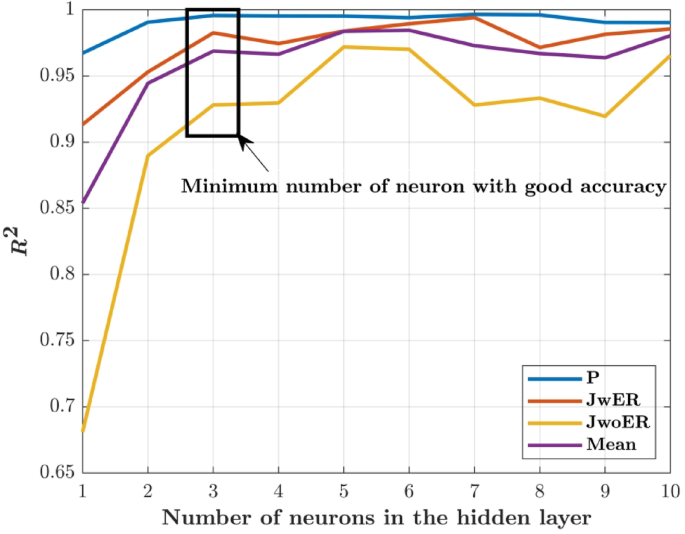
Identification of optimum number of neurons.
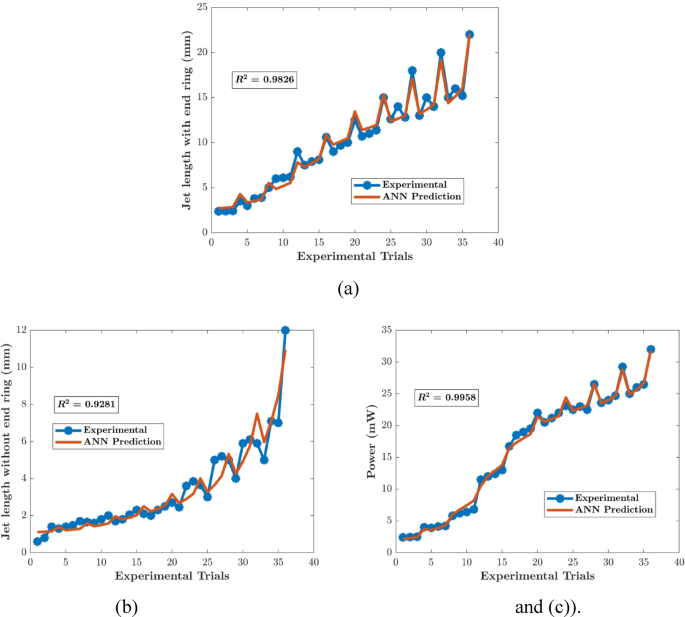
ANN predictions compared with experimental results: (a) JwER, (b) JwoER and (c) P.
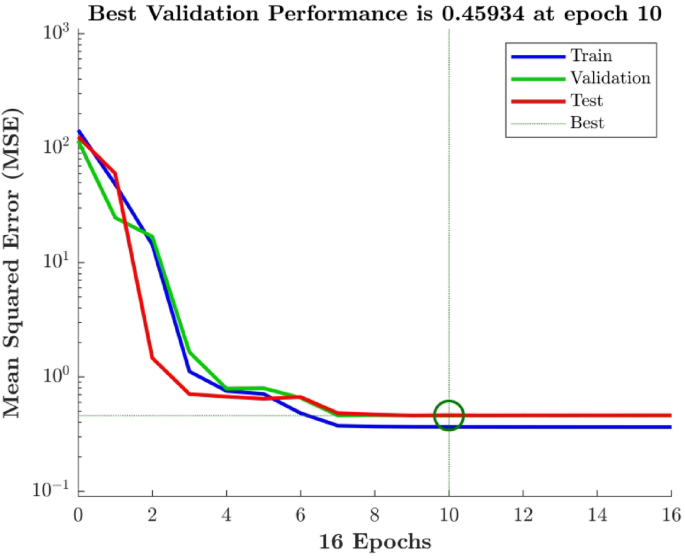
MSE variation during backpropagation.
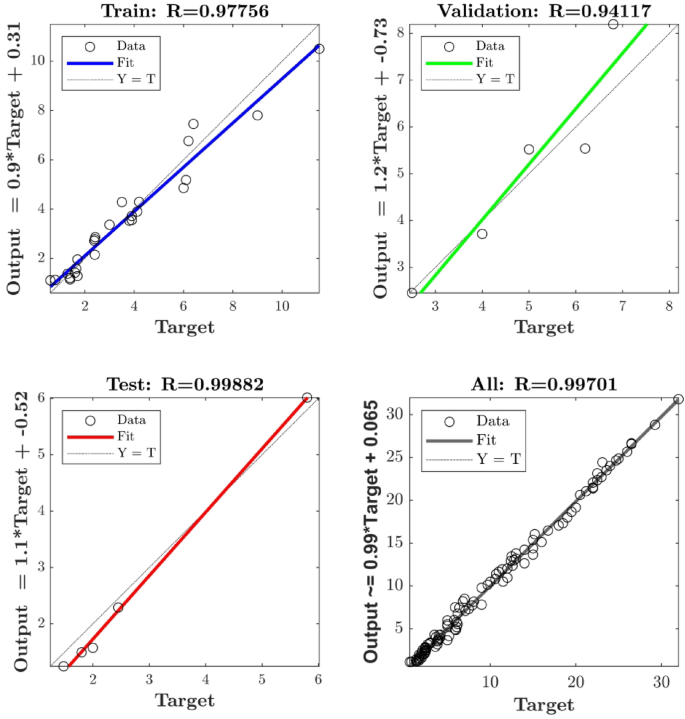
Pearson’s correlation coefficient (R) plots for the optimized ANN.
The predictive capacity of the ANN model was examined by projecting the performance outside the experimental range (Expt. No. 37–68 in Table 2). A linear relationship was observed between the supply frequency of up to 20 kHz and the power utilized for supply voltages between 2 and 5 kV. Nevertheless, there was a decrease in the power used when the supply frequency was increased to 25 kHz. This is caused by memory charges, which can also lead to ionization of argon atoms and a decrease in power. During the first half of the applied voltage phase in DBDs, the remaining species allow for subsequent discharge processes by initiating the creation of seeding electrons and elevating the initial field. This phenomenon is often called the “memory effect”43. Higher voltages, such as 6 kV and 10–15 kHz, result in an increase in power consumption because the input energy is wasted as heat in the dielectrics and does not help to create plasma.
Additionally, as shown in Table 2, the plasma jet lengths with end rings are longer than the jet lengths without end rings for the majority of supply voltage and frequency instances (2.5 kV − 6 kV, 10–25 kHz). The plasma jet was focused and extracted via the quartz tube exit with the assistance of a floating end ring. The increased jet lengths in Table 2 clearly demonstrate the significant rise in power consumption for SV and SF (6.5 kV − 8.5 kV, 10–25 kHz), where the input power is used for plasma formation. The power usage varies only slightly (2 mW − 6 mW) at even higher voltages of 9 kV − 10 kV (10–25 kHz), as the supply power is lost as thermal dissipation and lost in the dielectric material as seen Table-2.
In contrast to the lower voltage range (8.5 kV, 25 kHz), where JwER = 54.54 mm and JwoER = 44.31 mm, it is important to highlight that the jet length considerably reduced at higher voltages (9 kV, 10 kHz), where JwER = 45.97 mm and JwoER = 33.94 mm. This advocates that up to SV = 8.5 kV, SF = 25 kHz, the power supplied was efficiently used for generation of plasma, as evidenced by the power consumed (38.74 mW at 6.5 kV, 25 kHz). Moreover, at higher voltages (SV = 9 kV − 10 kV, SF = 10–25 kHz), most of the supplied power is lost due to thermal dissipation, consequently, leads to heating of quartz tube instead of utilized for plasma formation. This leads to a decrease in plasma jet lengths at 9 kV, 10 kHz (JLwER = 45.97 mm, JwER = 33.94 mm) and 10 kV, 25 kHz (JwER = 41.81 mm, JwoER = 31.01 mm) proves this point. For every type of working gas medium and DBD-APCPJ arrangement, there is, thus, an optimal operating zone.
Multi-response optimization
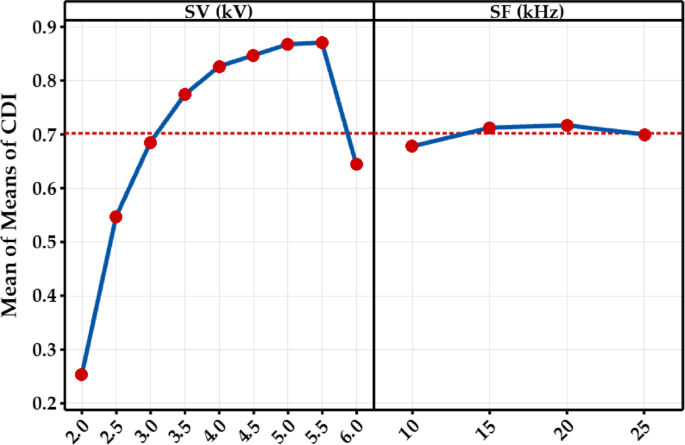
Table 3 presents the DI values for the experimental trials and CDI to optimize the parameters for multiple responses. The CDI was ranked in descending order to assess the best combination of operating parameters to achieve the best performance of the floating helix electrode-based DBD-APCPJ. It was found that SV = 5.5 kV and SF = 25 kHz (corresponding to Expt. No. 32) exhibited the best performance. The factorial effects on CDI were assessed using main effect analysis (Fig. 11). The mean of means of CDI is maximized for 5 kV ≤ SV ≤ 5.5 kV with a marginal effect of SF, which aligns with the results from DFA. Furthermore, Expt. No. 32, with SV = 5.5 kV and SF = 25 kHz achieved glow discharge (see Table 1), meeting the necessary conditions for biomedical applications.
The frequency (25 kHz) falls within the biologically safe range (1–30 kHz) to minimize cellular stress, and the low power consumption (5.90 mW) further reduces thermal risks. The resultant jet lengths (JwER = 29.25 mm) are practical for targeted treatments, as evidenced by prior studies44,45. While DFA guided parameter selection, their alignment with plasma physics and biomedical standards underscores their suitability for future in vivo validation.
Regression model sensitivity
The The responsiveness of the optimized ANN model (with the “2-3-3” topology) was evaluated by eliminating one input at a time. The accuracy of the prediction remained almost constant at R = 0.98 when SF was not supplied to the model but significantly decreased to R = 0.25 when SV was not supplied to the model (Fig. 12). This suggests that SV has a significant effect on the output parameters, whereas SF has a negligible effect. This link is confirmed by the Pearson correlation coefficient (R) between the input and output variables. (Fig. 13), where SF has an R < 0.26 and SV has an R > 0.85. This provides statistical support for the idea that SV has a greater impact on the reaction than SF does.
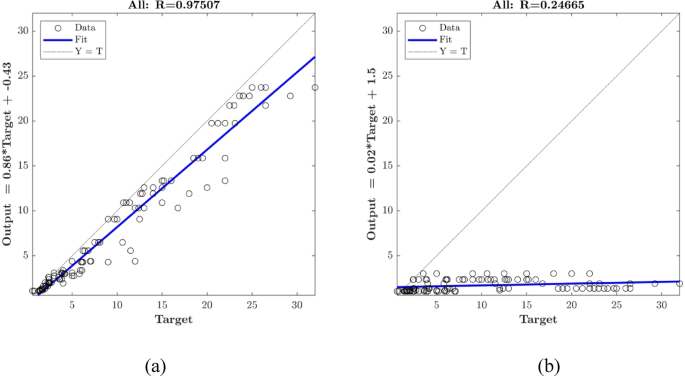
ANN model sensitivity on (a) SF and (b) SV.
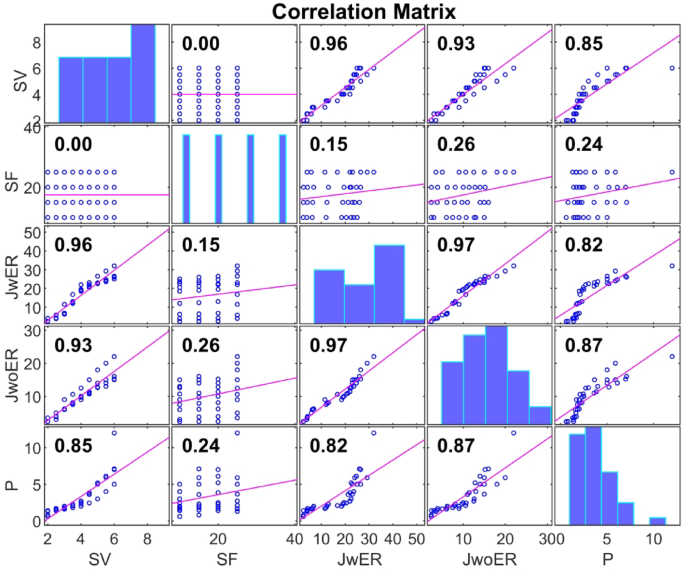
Pearson’s correlation coefficient matrix for experimental results.
Discharge type prediction performance
The KNN model (K = 3, correlation distance metric) achieved 96.6% accuracy for arc discharge but only 50% accuracy for transition phases, with an overall AUC of 0.84 ± 0.03 (95% CI). This performance gap reflects the model’s sensitivity to class imbalance in our dataset. The confusion matrix shows particular weakness in identifying transition states between glow and arc discharges. (Fig. 13). In contrast, the SVM model with quadratic kernel function demonstrated superior performance, achieving perfect classification (100% accuracy) for glow discharge and 75% accuracy for transition states. Its exceptional overall AUC of 0.99 ± 0.01 (Fig. 14) for glow discharge classification makes it the most reliable predictor among the tested models. The single-layer ANN Classifier (25 neurons, ReLU activation) showed strong but slightly inferior performance to SVM, with 96.6% accuracy for arc discharge, 75% accuracy for transitions, and an AUC of 0.98 ± 0.01 (Fig. 14).
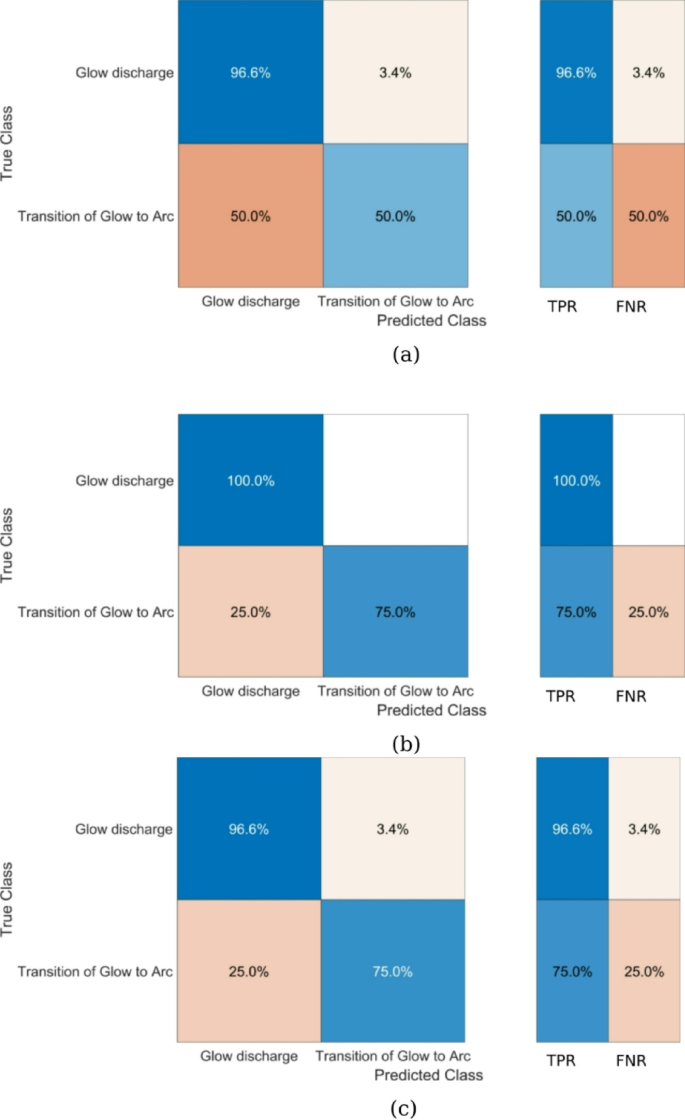
Confusion matrix for (a) KNN, (b) SVM and (c) ANNC models.
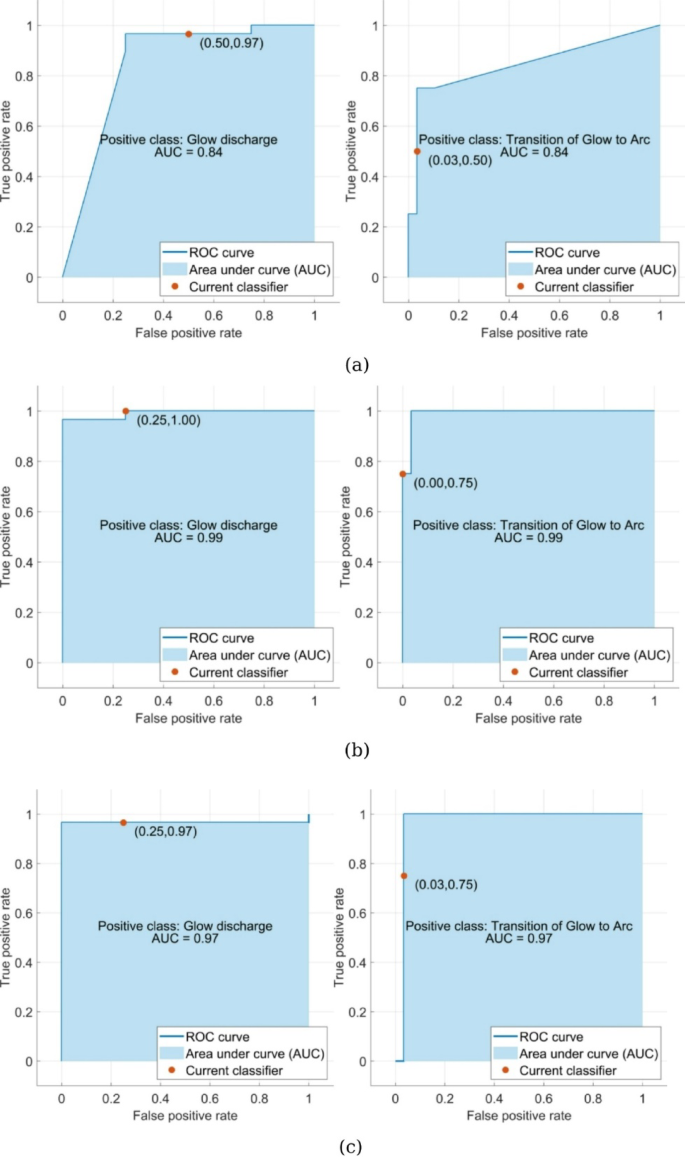
ROC for transition from glow to arc discharge (right column) & glow discharge (left column) with respect to (a) KNN, (b) SVM and (c) ANNC models.
The LIME analysis revealed that all three models considered P and SV as the predominant factors for making predictions on the type of discharge (refer Fig. 15). This is consistent with experimental findings of power consumption being an important indicator on the type of discharge being generated. Typically, higher power consumption indicates transfer of this energy in the form of thermal dissipation leading to the shift from glow to arc discharge. Secondly, voltage level also dictates the thermal dissipation. As observed from the experimental results (refer Table 1), at higher supply voltages there is a tendency to transition to arc discharge. Notably, both SVM and ANNC models showed similar qualitative contributions by the process parameters (refer Fig. 15b,c), whereas KNN showed a distinct sensitivity towards the parameters (refer Fig. 15 a) The negative coefficient scores for P and SV exhibited by SVM and ANNC are realistic due to the fact that higher values of P and SV increase the chances of arc discharge. This verifies the physical interpretation of the SVM and ANNC models.
While the current models, particularly SVM, show excellent predictive capability (especially for stable glow discharge states), we note two limitations: (1) Transition state prediction remains challenging (max 75% accuracy), and (2) Model confidence intervals, while generally narrow (± 1–3% for SVM), could be further improved with larger datasets. Future work will focus on expanding the training dataset and implementing ensemble methods to enhance prediction reliability for transitional states.
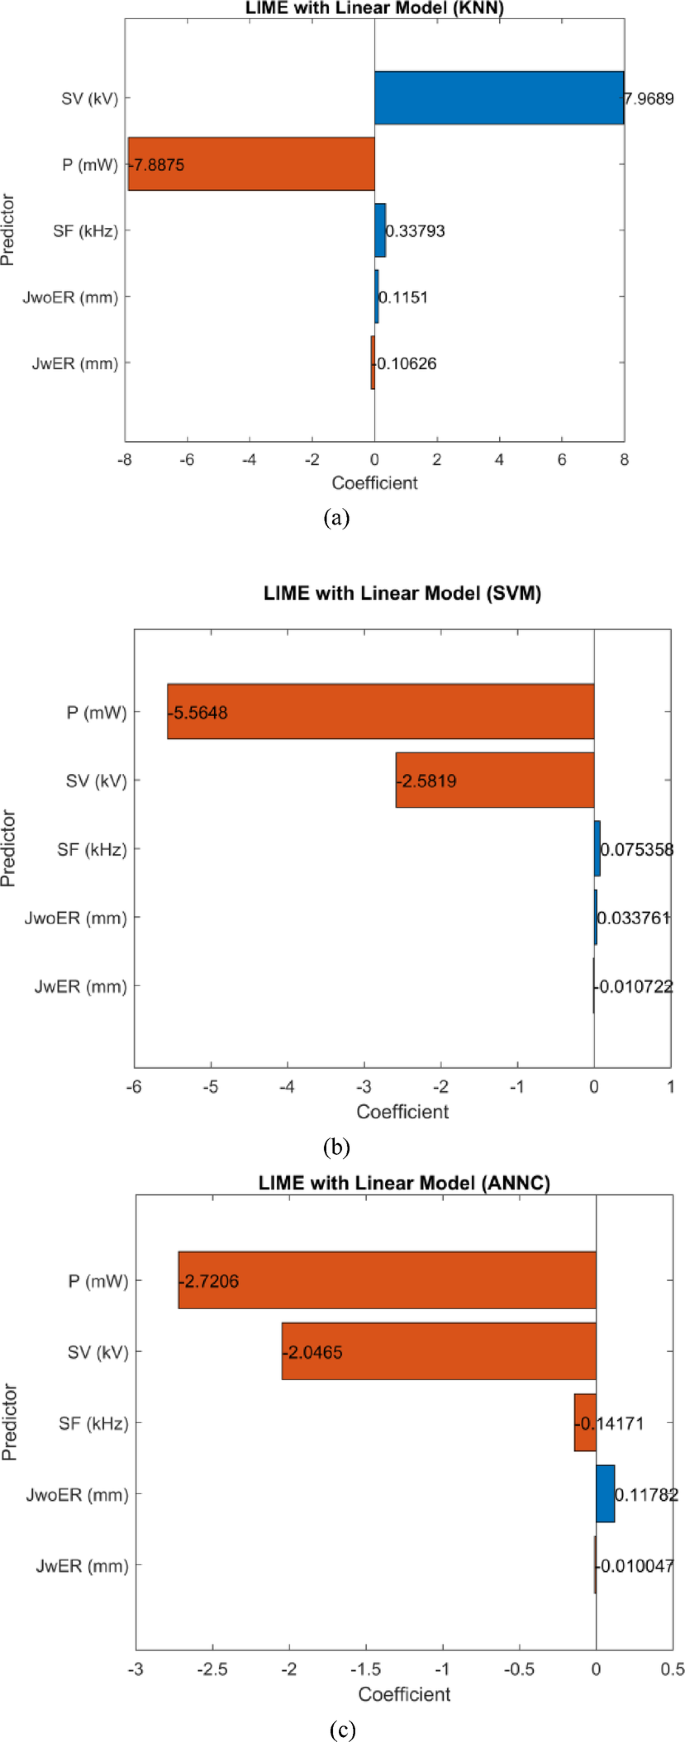
LIME coefficient scores representing relative importance of each parameter on model predictions in: (a) KNN, (b) SVM and (c) ANNC models.
Combinatorial responses effects
The 3D surface plots of the experimental responses, JwER, JwoER, and P were plotted with respect to SV and SF (Fig. 16) to assess their inter-relationships. JwER reaches a maximum at the maximum experimental levels of both SV and SF (6 kV, 25 kHz) (Fig. 16a). JwoER also achieves its maximum value at the maximum experimental settings of both control parameters (6 kV, 25 kHz) (refer to Fig. 16b). However, the effect on P shows an abrupt jump at SV values beyond 5.5 kV. This sudden change also coincides with the transition from glow to arc discharge, clearly demonstrating the relationship between higher power consumption and the transition to arc discharge. By re-emphasizing the sensitivity analysis results, all three responses significantly increased with changes in SV compared to SF.
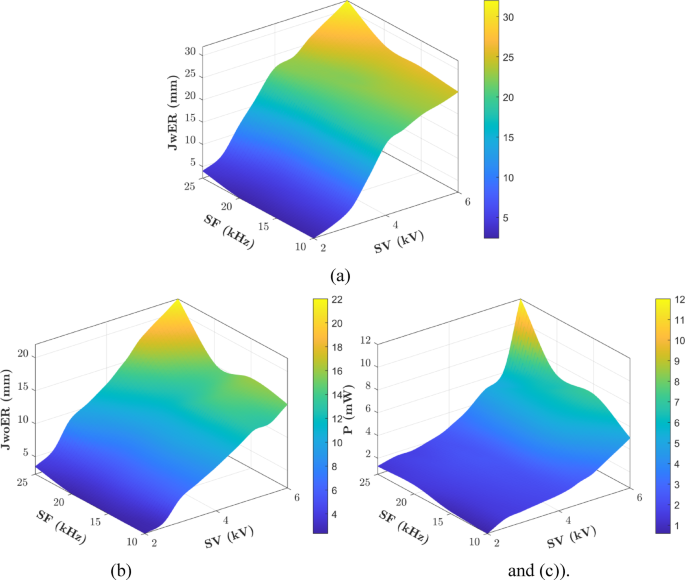
3D surface plots of experimental data shown in Table 1 for (a) JwER, (b) JwoER, (c) P with respect to SV and SF.
Potential of developed device for biomedical applications
Most of the cold atmospheric pressure plasma jets consume power in the range of Watts14,21 but our developed setup consumes it in the range of milliWatts with longer jet lengths which is a significant advancement in the technology for building portable plasma devices which are energy efficient. This system generates cold plasma using Argon gas at atmospheric pressure with longer jet lengths (Jet length with end ring) (49 mm) and lower power consumption (43.20 mW) at 9.5 kV/25 kHz, which could potentially be applied for a range of biomedical applications, such as wound healing and sterilization, and surface performance enhancements of bioimplants3,4. More detailed discussion on practical application of cold plasma for biomedical application can be found in46. Here, it is imperative to note that, this will require in-vitro and in-vivo biomedical laboratory testing and study of biomedical changes and sterilizing effects before its clinical implementation47.
Limitations
The efficacy and safety of cold plasma treatments are significantly influenced by the exposure time and dose. For instance, in cancer therapy, treatment times ranging from 30 s to 5 min have been employed, with variations depending on the cell line and plasma device used48. Longer exposure times can enhance the generation of reactive oxygen and nitrogen species (RONS), which are crucial for therapeutic effects but may also increase the risk of cytotoxicity if not properly controlled49. Literature indicates that for biomedical applications, the electron temperature (Tₑ) of the plasma should be carefully controlled. Typical electron temperatures in cold atmospheric pressure plasmas range from 1 to 10 eV, corresponding to approximately 11,600 to 116,000 K50. Operating within this range is critical to prevent potential damage to biological tissues. Therefore, biological testing (e.g., cell viability, sterilization assays, or tissue interaction studies) are essential before any biomedical use of the cold plasma device can be confirmed.
To overcome these limitations, in future work, we aim to conduct optical emission spectroscopy (OES) to analyze reactive species and measure electron temperature, threshold mapping of the electrical input parameters that induce discharge transitions, and sterility testing and biological assays to correlate plasma states with functional outcomes.
As shown in Table 1, the decrease in jet length beyond a certain voltage threshold is a known phenomenon in atmospheric pressure plasma jets. At higher supply voltages, especially beyond the optimal operation point, increased energy input can lead to thermal instabilities or partial transition toward arc-like behavior. This can cause jet contraction or irregularity rather than elongation, despite increased power consumption. At elevated voltages and frequencies, the plasma may reach a saturation point in ionization efficiency, where further energy input does not proportionally enhance plasma propagation. Additionally, energy losses due to gas heating or increased electron-neutral collisions can reduce the effective jet length. While this behavior is observed and reported, a detailed investigation of the underlying physical mechanisms is an important avenue of future investigation, particularly involving time-resolved imaging and optical diagnostics.
We acknowledge that additional data points, especially beyond the glow-to-arc transition region, would be needed for a more comprehensive understanding and generalization of the model. Future work will focus on exploring the plasma behavior at higher voltages, which will provide a larger dataset that includes the arc discharge regime and allow us to refine and extend the model’s predictive capability. A dedicated follow-up study will be planned to systematically characterize the 5.5-7 kV transition zone with higher sampling density (≥ 50 additional points). This will enable development of a hybrid physics-ML model specifically for transition prediction, combining: (1) stochastic modeling of electron avalanches, and (2) ANN ensembles with uncertainty quantification.
It is important to emphasize here that the scope of the present study was intentionally limited to the cold plasma regime, as defined by non-equilibrium discharge characteristics at atmospheric pressure with low gas temperatures. All modeling, optimization, and classification efforts were conducted within this domain to ensure relevance to biomedical applications and avoid confounding effects from arc-like or thermal plasma behavior. While extension into the glow-to-arc transition regime is a valuable direction for future research, the present focus ensures methodological consistency, safety in experimentation, and practical relevance for cold plasma technologies. This study lays the groundwork for broader modeling in future, multi-regime investigations.