Introduction: To investigate the distribution characteristics of hyperopic reserve across 10 PLADs in China and determine the levels and patterns of change in spherical equivalent after cycloplegic refraction among children and adolescents aged 5–18 years by sex.
Methods: The National Disease Control and Prevention Administration of China conducted a comprehensive study between 2020 and 2024, involving 61,076 students from kindergarten through high school across 10 provincial-level administrative divisions (PLADs) in China. Median [first quartile (Q1), third quartile (Q3)] values were used to describe SE distribution, and the Mann–Whitney U test was employed to compare SE between males and females within the same age group.
Results: The median SE decreased progressively with age in both sexes, with females demonstrating a more rapid decline than males. The median SE reached ≤−0.5 D at age 12 for males and age 11 for females. Among non-myopic participants, both sexes exhibited a consistent decline in median SE from ages 5–12, followed by relatively stable fluctuations from ages 13–18. However, the magnitude of both decline and fluctuations was greater in females than in males.
Conclusion: Hyperopic reserve among Chinese children and adolescents aged 5–18 years is substantially insufficient, with myopia onset occurring at increasingly younger ages, particularly among females approaching puberty and younger children. Early initiation of myopia prevention and control measures is essential, with timely monitoring of hyperopic reserve to prevent premature depletion.
During refractive development, children and adolescents experience a gradual transition from hyperopia to emmetropia, with continued development beyond emmetropia resulting in myopia. In 2022, the overall prevalence of myopia among students from senior kindergarten through high school in China reached 51.9% (1), highlighting the concerning depletion of hyperopic reserve in this population. Cycloplegic refraction represents the internationally recognized gold standard for myopia diagnosis (2). However, previous population-based investigations examining hyperopic reserve status in children and adolescents have been constrained by limited sample sizes (3). Furthermore, comprehensive national studies providing different percentile reference values of spherical equivalent (SE) following cycloplegic refraction in individuals aged 5–18 years remain insufficient, thereby limiting accurate evaluation of hyperopic reserve in this demographic. This study characterizes the distribution patterns of hyperopic reserve across 10 PLADs in China, elucidates the levels and developmental trajectories of spherical equivalent after cycloplegic refraction in children and adolescents aged 5–18 years by sex, addresses the existing data gap in this field, and provides essential evidence to support myopia prevention and control initiatives.
This study utilized data from a national cross-sectional survey examining ocular development in children and adolescents, conducted between 2020 and 2024 under the auspices of the National Disease Control and Prevention Administration of China. The survey encompassed 10 provincial-level administrative divisions (PLADs): Beijing, Shanxi, Liaoning, Zhejiang, Shandong, Henan, Hunan, Guangdong, Chongqing, and Shaanxi. From each PLAD, 1–2 cities were selected through direct sampling based on economic development levels, while municipalities contributed one district each from urban and suburban areas using identical selection criteria. Within each selected city or district, schools were sampled by grade level using multistage cluster sampling, encompassing kindergarten, primary, junior high, and senior high schools. After identifying target schools and classes, all students within selected classes were enrolled as study participants. Inclusion criteria required participants aged 5–18 years who underwent computerized refraction under ciliary muscle paralysis, provided voluntary participation, and had parental informed consent. Exclusion criteria comprised any diseases affecting visual development or interfering with eye examinations.
Participants completed a self-administered electronic questionnaire to collect demographic information, including sex, age, educational level, and geographic area. All participants underwent slit-lamp examination to exclude contraindications to pupil dilation, followed by computerized refraction under ciliary muscle paralysis. Equipment was calibrated before use, and examinations were performed by personnel with certified ophthalmology-related professional qualifications. To ensure data quality, we randomly selected 5% of participants for retesting of visual acuity parameters, including spherical and cylindrical power, before cycloplegic refraction. When differences between any two measurements exceeded 0.5 D, readings were discarded and the eye was re-examined. We used a desktop autorefractor (KR8800; Topcon) to measure refraction under cycloplegia, which was induced by administering 0.5% tropicamide every 5 minutes for four applications. After 30 minutes, we assessed pupil dilation and cycloplegia. SE was calculated as the sum of spherical power plus half the cylindrical power. Myopia was defined as SE ≤−0.5 D.
We performed data analysis using SPSS (version 26.0; IBM Corp., NY, USA). The Kolmogorov–Smirnov normality test indicated that SE data were not normally distributed; therefore, we presented results as M (Q1, Q3). Since SE values in the right and left eyes were significantly correlated (r=0.897, P<0.01), we analyzed only the right eye. We presented count data as frequencies and percentages. The Mann–Whitney U test was used to compare SE between males and females within the same age group. A two-sided P<0.05 was considered statistically significant.
A total of 67,260 students participated in the study. Of these, 22 were excluded due to diseases affecting visual development or interfering with eye examinations, 4,968 were excluded for missing cycloplegic SE (right eye) data, and 1,023 outliers (
Among all participants, the median SE for children and adolescents aged 5–18 years was 0.50 D. The median SE demonstrated a progressive decline with increasing age, with females exhibiting a more pronounced decline than males. Males reached a median SE≤−0.5 D beginning at age 12, while females reached this threshold at age 11. Statistically significant differences in median SE between males and females were observed at ages 5–7, 10–12, 14, and 17–18 (Z=−2.30, −7.86, −5.34, −5.86, −4.00, −4.22, −3.37, −2.10, −3.10, all P<0.05). Notably, females aged 5–7 years demonstrated higher median SE values than males. These comprehensive findings are detailed in Table 1 and Figure 1.
| Age (years) | Males | Females | All | |||||
| n (%) | M (Q1, Q3) | n (%) | M (Q1, Q3) | n (%) | M (Q1, Q3) | |||
| 5 | 583 (1.85) | 1.00 (0.63, 1.50) | 551 (1.86) | 1.13 (0.63, 1.63) | 1,134 (1.86) | 1.13 (0.63, 1.50) | ||
| 6 | 6,808 (21.60) | 1.00 (0.50, 1.38) | 6,215 (21.03) | 1.00 (0.63, 1.50) | 13,023 (21.32) | 1.00 (0.63, 1.38) | ||
| 7 | 7,077 (22.45) | 0.75 (0.25, 1.13) | 6,671 (22.57) | 0.75 (0.38, 1.25) | 13,748 (22.51) | 0.75 (0.25, 1.13) | ||
| 8 | 4,552 (14.44) | 0.50 (−0.13, 1.00) | 4,285 (14.50) | 0.50 (−0.13, 1.00) | 8,837 (14.47) | 0.50 (−0.13, 1.00) | ||
| 9 | 3,334 (10.58) | 0.25 (−0.75, 0.75) | 3,215 (10.88) | 0.13 (−0.88, 0.75) | 6,549 (10.72) | 0.25 (−0.75, 0.75) | ||
| 10 | 2,531 (8.03) | 0.00 (−1.25, 0.63) | 2,247 (7.60) | −0.38 (−1.50, 0.38) | 4,778 (7.82) | −0.13 (−1.38, 0.50) | ||
| 11 | 1,985 (6.30) | −0.38 (−1.75, 0.50) | 1,910 (6.46) | −0.63 (−2.00, 0.25) | 3,895 (6.38) | −0.50 (−1.88, 0.38) | ||
| 12 | 1,576 (5.00) | −0.75 (−2.25, 0.38) | 1,380 (4.67) | −1.13 (−2.49, 0) | 2,956 (4.84) | −1.00 (−2.38, 0.25) | ||
| 13 | 780 (2.47) | −1.25 (−3.00, 0) | 744 (2.52) | −1.63 (−2.88, −0.25) | 1,524 (2.50) | −2.13 (−3.00, −0.13) | ||
| 14 | 595 (1.89) | −1.75 (−3.25, −0.25) | 642 (2.17) | −2.13 (−3.50, −0.88) | 1,237 (2.03) | −2.00 (−3.38, −0.50) | ||
| 15 | 455 (1.44) | −2.13 (−3.63, −0.50) | 488 (1.65) | −2.25 (−3.63, −1.00) | 943 (1.54) | −2.13 (−3.63, −0.75) | ||
| 16 | 475 (1.51) | −2.13 (−3.63, −0.63) | 486 (1.64) | −2.38 (−3.75, −0.88) | 961 (1.57) | −2.38 (−3.63, −0.75) | ||
| 17 | 411 (1.30) | −2.13 (−3.63, −0.75) | 449 (1.52) | −2.63 (−4.00, −1.13) | 860 (1.41) | −2.38 (−3.75, −0.88) | ||
| 18 | 357 (1.13) | −2.00 (−3.50, −0.25) | 274 (0.93) | −2.50 (−4.00, −1.00) | 631 (1.03) | −2.13 (−3.63, −0.50) | ||
| Abbreviation: PLADs=provincial-level administrative divisions; M=median; Q1=first quartile; Q3=third quartile. | ||||||||
Table 1.
Distribution of hyperopic reserve among children and adolescents across 10 PLADs in China, 2020–2024.
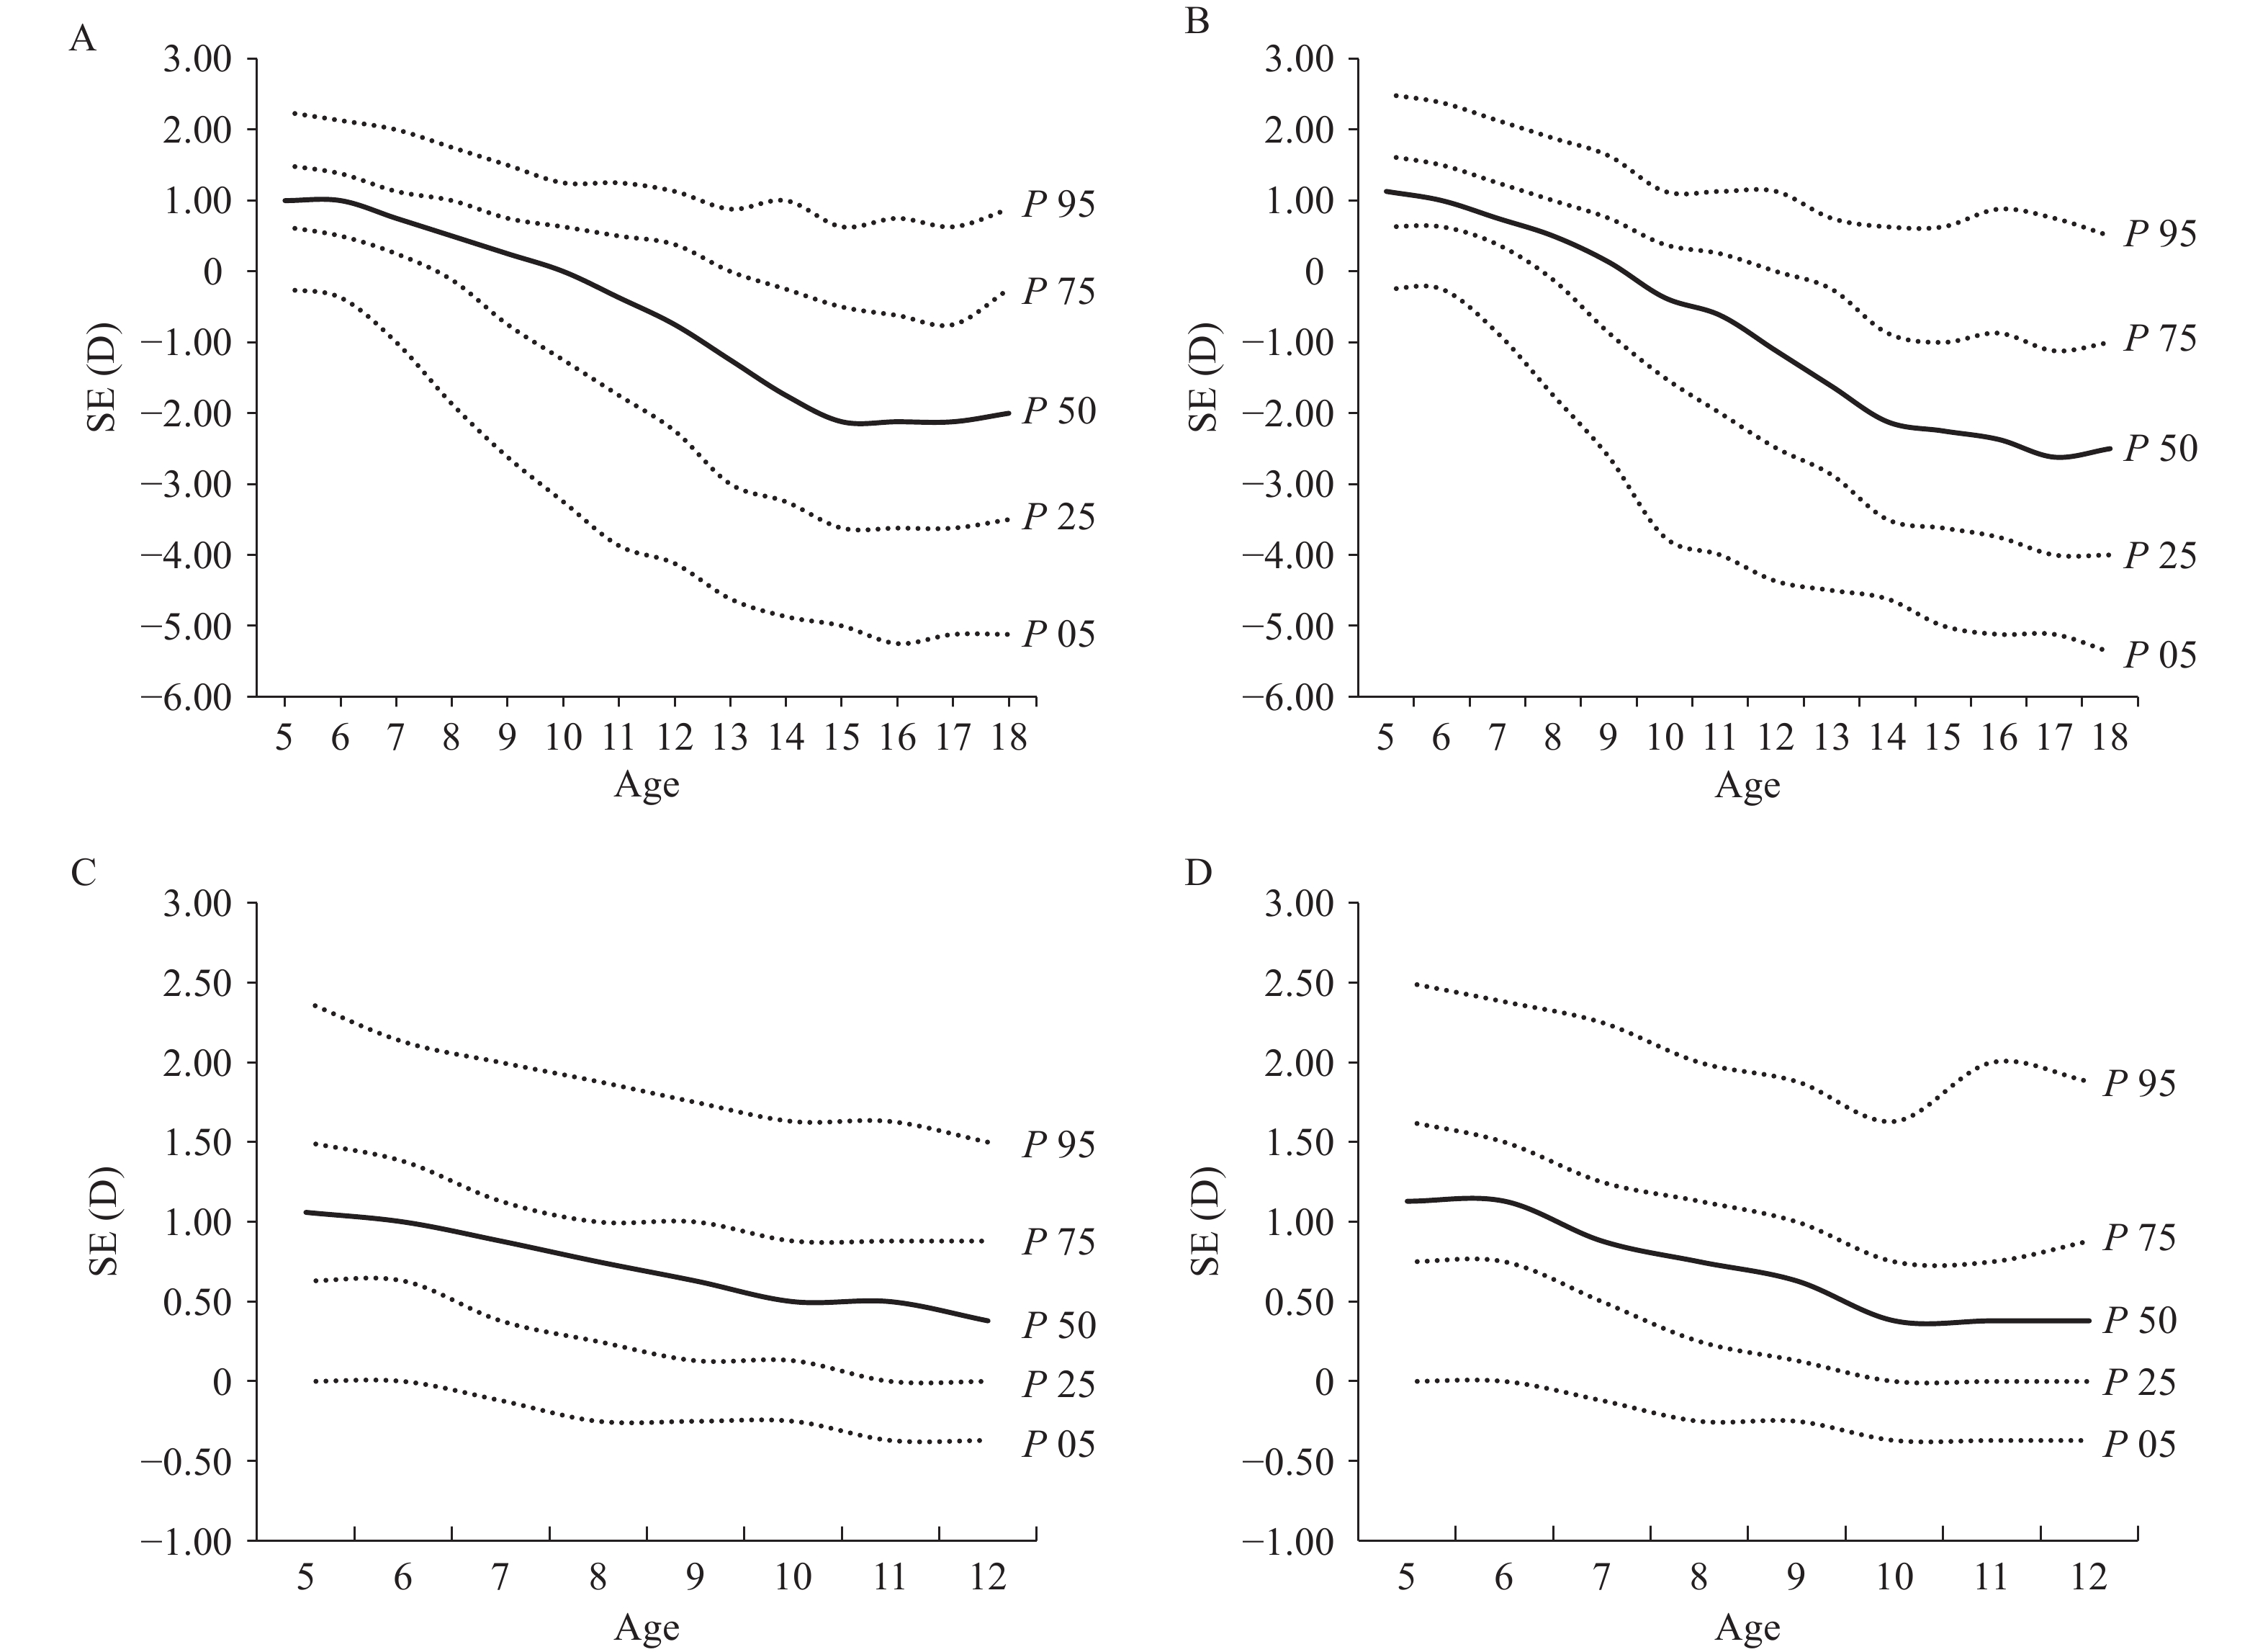
Distribution of hyperopic reserve among children and adolescents across 10 PLADs and cities in China. (A) All males; (B) All females; (C) Non-myopic males; (D) Non-myopic females.
Abbreviation: PLADs=provincial-level administrative divisions; SE=spherical equivalent; D=diopters.
Among non-myopic participants, the median SE for children and adolescents aged 5–18 years was 0.75 D (0.75 D for males and 0.88 D for females). Both sexes demonstrated a decline in median SE from ages 5 to 12, followed by relatively stable fluctuations from ages 13 to 18. The magnitude of decline and subsequent fluctuations was greater in females than in males. Statistically significant differences in median SE between sexes were observed at ages 5–8 and 10–11 (Z=−2.32, −8.21, −4.52, −2.17, −2.86, −2.40, all P<0.05), with females exhibiting higher median SE values than males at ages 5–8. Given the stability of the sample size, the distribution of hyperopic reserve among participants aged 5–12 years without myopia across different sexes is presented in Table 2 and Figure 1.
| Age (years) | Males | Females | All | |||||
| n (%) | M (Q1, Q3) | n (%) | M (Q1, Q3) | n (%) | M (Q1, Q3) | |||
| 5 | 562 (2.38) | 1.06 (0.63, 1.50) | 533 (2.48) | 1.13 (0.75, 1.63) | 1,095 (2.43) | 1.13 (0.75, 1.63) | ||
| 6 | 6,517 (27.59) | 1.00 (0.63, 1.38) | 5,960 (27.73) | 1.13 (0.75, 1.50) | 12,477 (27.66) | 1.00 (0.63, 1.50) | ||
| 7 | 6,403 (27.11) | 0.88 (0.38, 1.13) | 6,127 (28.51) | 0.88 (0.50, 1.25) | 12,530 (27.77) | 0.88 (0.50, 1.25) | ||
| 8 | 3,735 (15.81) | 0.75 (0.25, 1.00) | 3,524 (16.40) | 0.75 (0.25, 1.13) | 7,259 (16.09) | 0.75 (0.25, 1.13) | ||
| 9 | 2,337 (9.89) | 0.63 (0.13, 1.00) | 2,181 (10.15) | 0.63 (0.13, 1.00) | 4,518 (10.01) | 0.63 (0.13, 1.00) | ||
| 10 | 1,528 (6.47) | 0.50 (0.13, 0.88) | 1,183 (5.50) | 0.38 (0, 0.75) | 2,711 (6.01) | 0.50 (0, 0.88) | ||
| 11 | 1,013 (4.29) | 0.50 (0, 0.88) | 857 (3.99) | 0.38 (0, 0.75) | 1,870 (4.15) | 0.50 (0, 0.88) | ||
| 12 | 698 (2.95) | 0.38 (0, 0.88) | 482 (2.24) | 0.38 (0, 0.88) | 1,180 (2.62) | 0.38 (0, 0.88) | ||
| 13 | 261 (1.10) | 0.25 (0, 0.63) | 205 (0.95) | 0.13 (−0.13, 0.63) | 466 (1.03) | 0.13 (0, 0.63) | ||
| 14 | 168 (0.71) | 0.25 (0, 0.75) | 130 (0.60) | 0.25 (−0.13, 0.63) | 298 (0.66) | 0.25 (−0.13, 0.63) | ||
| 15 | 107 (0.45) | 0.38 (0, 0.63) | 86 (0.40) | 0.25 (0, 0.75) | 193 (0.43) | 0.25 (0, 0.63) | ||
| 16 | 103 (0.44) | 0.38 (0, 0.75) | 96 (0.45) | 0.50 (0, 0.88) | 199 (0.44) | 0.38 (0, 0.75) | ||
| 17 | 92 (0.39) | 0.25 (−0.13, 0.56) | 81 (0.38) | 0.25 (−0.13, 0.75) | 173 (0.38) | 0.25 (−0.13, 0.63) | ||
| 18 | 97 (0.41) | 0.38 (0, 0.63) | 48 (0.22) | 0 (−0.13, 0.69) | 145 (0.32) | 0.25 (−0.13, 0.63) | ||
| Abbreviation: PLADs=provincial-level administrative divisions; M=median; Q1=first quartile; Q3=third quartile. | ||||||||
Table 2.
Distribution of hyperopic reserve among non−myopic children and adolescents in 10 PLADs of China, 2020–2024.