Characterization of APS-PTX NPs. (A) Size distribution of APS-PTX NPs; (B) Zeta potential of APS-PTX NPs; (C) TEM images of APS(1), free PTX(2) and APS-PTX NPs(3); (D) UV-vis spectrum of APS, free PTX and APS-PTX NPs; (E) FT-IR spectrum of APS, free PTX and APS-PTX NPs; (F) CMC values of APS; (G) Stability of APS-PTX NPs in pH 6.8, 7.4 PBS and 10% FBS for 24 h (n = 3); (H) XRD spectrum of APS-PTX NPs, their monomers and their mixtures; (I) Solubility of PTX
Preparation and characterization of APS-PTX NPs
APS-PTX NPs were prepared by a simple one-step sonication method. After process optimization (The optimization process is shown in Table S2-S4), the average particle size of APS-PTX NPs was 191.7 ± 4.6 nm (Fig. 2A), with a polydispersity index (PDI) of 0.15 ± 0.03 and a zeta potential of −18.34 ± 0.43 mV (Fig. 2B). Transmission electron microscopy (TEM) images showed that APS itself could form white spherical self-assembled nanoparticles in aqueous solution, accompanied by the Tyndall effect (Fig. 2C1); free PTX had a black prismatic crystal structure and precipitated in aqueous solution (Fig. 2C2), while APS-PTX NPs consisted of black spherical nanoparticles as the core and white material as the shell, indicating that APS-PTX NPs is formed by APS encapsulation of PTX, and exhibited a more obvious Tyndall effect than the APS aqueous solution (Fig. 2C3). CMC is one of the important parameters to measure the ability of amphiphilic polymers to form nanoparticles [43] and therefore it is necessary to determine the CMC value of APS. In this study, as shown in Fig. 2F two straight lines were obtained (Y1 = 0.56401-0.53398x; Y2 = 0.61841 + 0.01894x), and the intersection point was calculated through Y1 and Y2 to get the CMC. The CMC of APS was 0.79 mg/mL, which meant APS had micelle-like properties. This indicates that after simple co-sonication, APS can encapsulate the hydrophobic chemotherapeutic drug to form new nanoparticles. Interestingly, APS exhibited a solubilization function similar to that of Liposomes. The solubility of free PTX in aqueous solution was 8.78 ± 0.76 µg·mL−1, while the concentration of PTX in APS-PTX NPs was 941.96 ± 29.28 µg·mL−1, with a 107-fold increase in solubility (Figure I). The encapsulation efficiency (EE) and the drug loading (DL) of PTX in APS-PTX NPs were 99.47 ± 0.18% and 9.66 ± 0.12%. UV–visible spectrophotometry of APS-PTX NPs and free APS and PTX at the same concentration was performed. As shown in Fig. 2D, free PTX exhibited maximum absorption peaks at 230 nm. In contrast, the absorption intensity of APS-PTX NPs significantly decreased at 230 nm, indicating that PTX were successfully loaded into APS-PTX NPs. The FTIR results (Fig. 2E) showed that the absorption peak of hydroxyl group stretching vibration of APS was at 3394.27 cm−1, and the vibrational absorption peak of free carboxyl group in APS galacturonic acid was at 1637.04 cm−1. The peak at 1732.02 cm−1 corresponded to the carbonyl group (C = O) stretching vibration of PTX, whereas, in the APS-PTX NPs, the The peak at 3394.27 cm−1 is shifted to 3376.35 cm−1, the absorption peak at 1637.04 cm−1 is shifted to 1645.04 cm−1 and the absorption peak at 1732.02 cm−1 is shifted to 1715.93 cm−1. These results indicate that the carbonyl band of PTX and the hydroxyl band of galacturonic acid and the methylated free carboxyl band in APS have undergone significant changes after assembly, suggesting that an assembly has occurred between APS and PTX. XRD analysis was performed to evaluate the crystalline structure of APS, PTX, and their physical mixture (Fig. 2H). PTX exhibited characteristic diffraction peaks at 5.6°, 8.8°, 10.0°, 12.2°, 12.5°, 15.8°, 18.6°, and 19.6°, while APS showed no distinct peaks. The physical mixture retained the sharp peaks of PTX, whereas these peaks disappeared in APS-PTX NPs, demonstrating the amorphous state of PTX within the NPs. This XRD pattern shift further confirmed the effective encapsulation of PTX by APS, highlighting the protective role of APS in maintaining PTX in an amorphous form.
Furthermore, APS-PTX NPs demonstrated minimal drug leakage over a 60-day period, as detailed in Table S5 (Supporting Information). To assess their stability and biocompatibility within the circulatory system, in vitro evaluations were conducted. Figure 2G illustrates that the particle size of APS-PTX NPs remained stable in PBS supplemented with 10% fetal bovine serum (FBS) at 37 °C for 24 h, suggesting their potential stability during blood circulation. Additionally, hemolysis assays were performed, with results presented in Table S6 and Figure S6. The hemolysis rate of APS-PTX NPs was consistently below 5%, and erythrocyte morphology remained unaffected, confirming negligible hemolytic toxicity at the tested concentrations. These findings underscore the favorable stability and safety profile of APS-PTX NPs for systemic applications. Finally, the in vitro release of APS-PTX NPs was performed in PBS solution containing 3% SDS (pH = 7.4). As shown in Figure S5, cumulative PTX release from APS-PTX NPs was significantly lower than that from PTX at all time points, indicating a sustained release behavior.
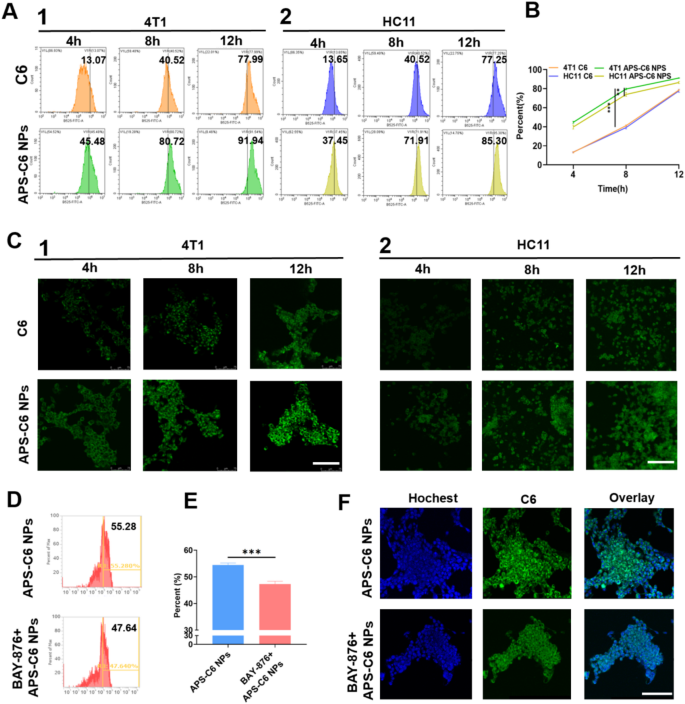
Cell uptake and targeting effect of APS-PTX NPs. (A) Fluorescence intensity results of free C6 and APS-C6 NPs in 4T1(1) and HC11(2) cells was analyzed by FCM assay at 4, 8, 12 h after incubation, and the quantitative analysis of FCM results (B). (C) CLSM fluorescence images results of C6 in 4T1 and HC11 cells after free C6 and APS-C6 NPs treatment for 8 h. (D) Fluorescence intensity and quantitative results of 4T1 cells incubated with APS-C6 NPs and APS-C6 NPs after BAY-876 pretreatment at 8 h, and the quantitative analysis of FCM results (E). (F) CLSM fluorescence images results of C6 in 4T1 cells after APS-C6 NPs and APS-C6 NPs after BAY-876 pretreatment at 8 h. Scale bar 100 μm
In vitro cell uptake
To evaluate the targeting capability of APS-PTX NPs, coumarin 6 (C6)-loaded APS nanoparticles (APS-C6 NPs) were successfully synthesized. As depicted in Fig. 3A1, the APS-C6 NPs group displayed stronger and more widespread green fluorescence signals in the cytoplasm of 4T1 cells compared to the free C6 group, indicating enhanced cellular uptake efficiency. We also conducted cell uptake tests in HC11 cells (Mammary Epithelium) (Fig. 3A2), which showed no significant difference in FITC fluorescence intensity between HC11 and 4T1 cells for free C6. However, APS-PTX NPs exhibited significantly higher uptake in 4T1 cells than in HC11 cells (Fig. 3B), a finding further confirmed by FCM analysis (Fig. 3C). In addition, tumor cells overexpress GLUT1 to Fuel their rapid proliferation and metabolism. APS is rich in glucose residues. We hypothesized that APS could selectively target 4T1 cells through GLUT1. In order to further prove that the tumor targeting of APS-PTX NPs is correlated with GLUT, we used BAY-876, a highly selective and cell-permeable GLUT1 inhibitor. At a safe concentration, when BAY-876 blocked GLUT1 in 4T1 cells, the uptake rate of APS-PTX NPs dropped from 55.28 to 47.64% (Fig. 3D, E). The result was further validated by FCM analysis (Fig. 3F). This suggests that APS-PTX NPs, having numerous surface glucose residues, are endocytosed via GLUT1. APS can actively target tumor cells through specific binding to GLUT1, achieving precise drug delivery while reducing damage to normal tissues. Hence, the findings collectively confirmed the efficacy of APS-PTX NPs in selectively target tumor cells rather than normal cells.
In vitro anti-tumor effects of APS-PTX NPs
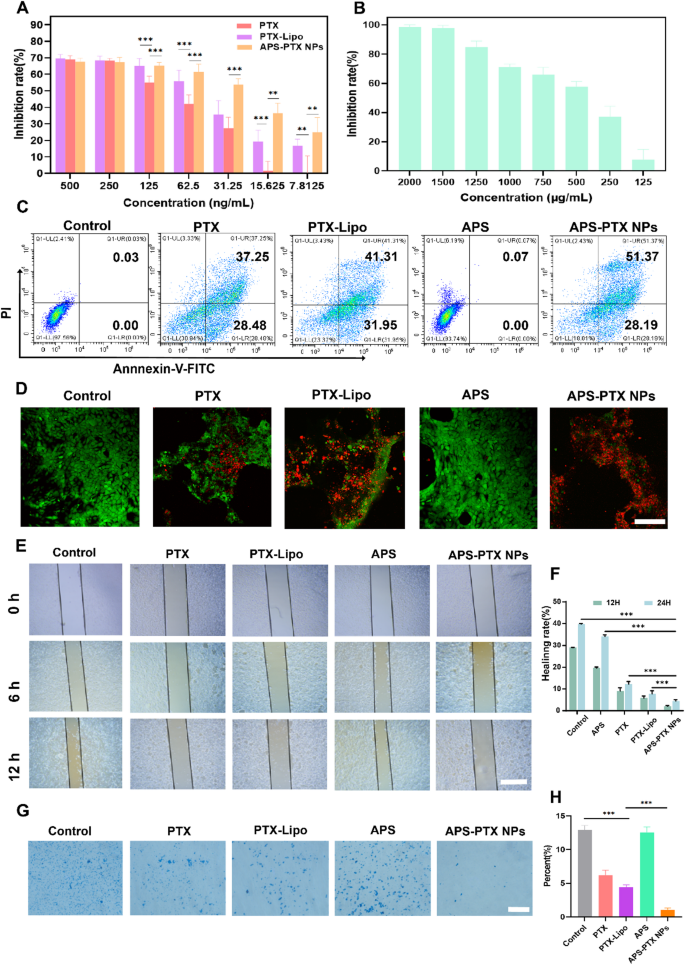
In vitro metastasis inhibition of APS-PTX NPs on 4T1 cell. (A) 4T1 cell viability. The cells were incubated with various concentrations of free PTX, PTX-Lipo and APS-PTX NPs for 48 h and the viability of cells was followed detected by CCK8 (n = 3 samples per group). (B) 4T1 cell viability. The cells was incubated with various concentrations of APS for 48 h and the viability of cells was followed detected by CCK8. (C) Flow cytometry expression of PI and Annexin V for apoptosis. (D) Live/dead staining images of 4T1 cells. (E) Representative images of scratch wound-healing assays on 4T1 cell after treated with free PTX, PTX-Lipo, APS and APS-PTX NPs. (F) Statistical results of scratch wound-healing assays. (G) Representative images of transwell invasion assays on 4T1 cell after treated with free PTX, PTX-Lipo, APS and APS-PTX NPs. (H) Statistical results of transwell invasion assays. Scale bar 100 μm (***p < 0.001, **p < 0.01, *p < 0.05)
The APS-PTX NPs promoted drug uptake by 4T1 cells, so we further studied the effect of APS-PTX NPs on PTX cytotoxicity. To compare the antitumor activity of APS-PTX NPs with free PTX and the marketed preparation PTX-Lipo, we incubated 4T1 cells with APS, free PTX, PTX-Lipo, and APS-PTX NPs. The cytotoxicity of APS was weak, while the cytotoxicity of APS-PTX NPs was the strongest, significantly higher than that of free PTX and PTX-Lipo. The IC50 of free PTX, PTX-Lipo, and APS-PTX NPs were 116.27 ± 8.08 ng/mL, 68.64 ± 2.15 ng/mL, and 42.14 ± 1.82 ng/mL, respectively (Fig. 4A and B). According to the cell uptake results, free PTX is taken up by cells through passive diffusion; PTX-Lipo enters cells through endocytosis and exhibits stronger cytotoxicity, while APS-PTX NPs are taken up by cells through GLUT1-mediated endocytosis and thus exhibit the strongest cytotoxicity. In addition, we also analyzed the apoptosis of cells under different treatments. The result showed that APS did not take obvious effect, and the total apoptosis rates of APS, PTX, PTX-Lipo and APS-PTX NPs were 0.10 ± 0.04, 63.51 ± 2.15%, 72.17 ± 1.20%, and 75.41 ± 3.75%, respectively (Fig. 4C and Figure S7). These results were consistent with the trends observed in the cytotoxicity experiments.
To assess cell viability and mitochondrial permeability, Calcein AM, a green fluorescent probe capable of penetrating live cells, and propidium iodide (PI), a red fluorescent dye specific to dead cells, were utilized. Figure 4D illustrates the viability of 4T1 cells after 24 h of treatment with various formulations. Compared to the control group, the APS-treated groups exhibited minimal PI staining, indicating low cell death. In contrast, the APS-PTX NPs group displayed the highest number of red-stained dead cells, aligning with the trends observed in CCK-8 assays. These results once again validate the glucose-targeting capability provided by APS.
Additionally, the impact of APS-PTX NPs on 4T1 cell migration and invasion was evaluated using wound-healing and transwell assays. The migration ability of 4T1 cells was inhibited to varying degrees in wound-healing assay by different groups (Fig. 4E, F). Compared to control group, the extent of wound healing in other groups was reduced. Notably, the change of scratch gaps could barely be observed in APS-PTX NPs group and relative rate of wound healing were 2.05 ± 0.61% and 4.46 ± 1.03% after 12 and 24 h respectively. And the rate of invasion had the similar downward trend as healing rates after treatment (Fig. 4G, H). These results indicated the combination of APS-PTX NPs had a better effect than free PTX and PTX-Lipo in inhibition of migration and invasion, and the advantage of APS as a nano-delivery carrier in anti-tumor metastasis.
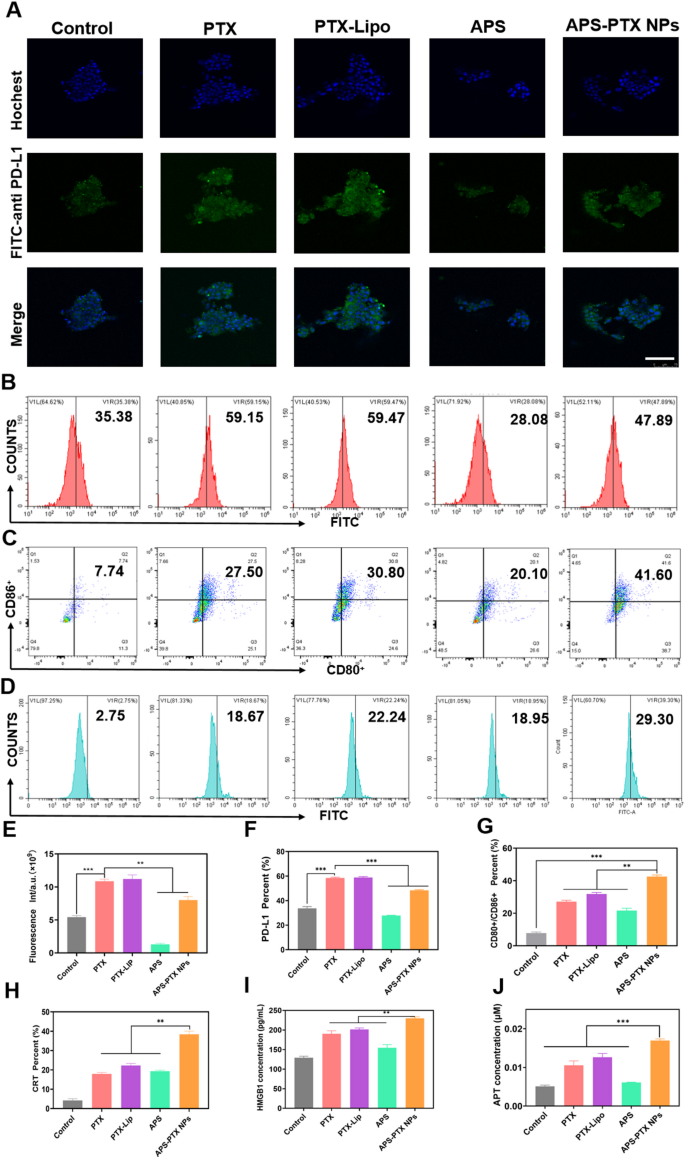
APS-PTX NPs reduce PD-L1 expression and induce ICD in vitro (A) CLSM fluorescence images of PD-L1 in the tumor sphere after incubation by free PTX, PTX-Lipo, APS and APS-PTX NPs. The blue and green fluorescence represented hochest and anti-PD-L1 antibody, respectively. Scale bar: 100 μm. (B) Flow cytometry images of PD-L1 in the tumor sphere after incubation by free PTX, PTX-Lipo, APS and APS-PTX NPs. (C) Expression of CD80+/CD86+ on BMDCs after incubation with free PTX, PTX-Lipo, APS and APS-PTX NPs based on flow cytometry. (D) Expression of CRT on 4T1 after incubation with free PTX, PTX-Lipo, APS and APS-PTX NPs based on flow cytometry. (E) Semi-quantitative analysis red fluorescence of anti-PD-L1. (F) Quantitative analysis of PD-L1 expression. (F) Quantitative analysis of PD-L1 expression. (G) Quantitative analysis of FCM results of the expression of CD80+/CD86+ on DCs. (H) Quantitative analysis of CRT expression. (I) HMGB1 secretion measured by HMGB1 assay kits (n = 3). (J) ATP secretion measured by ATP assay kits (n = 3). (***p < 0.001, **p < 0.01)
APS-PTX NPs induced ICD activity and decreased PD-L1 in vitro
PTX, a widely used chemotherapeutic agent, is known to trigger ICD in tumor cells [44]. To assess the ability of APS-PTX NPs to induce ICD, the externalization of CRT in 4T1 cells induced by APS-PTX NPs was first investigated using flow cytometry. In comparison to the control group, PTX, PTX-Lipo, and APS-PTX NPs were all capable of significantly inducing CRT expression. Notably, the induction effect of APS-PTX NPs was markedly more potent than that of PTX-Lipo. This could potentially be ascribed to the augmented endocytosis efficiency and elevated cytotoxicity, as depicted in Fig. 5D and H. High mobility group box 1 protein (HMGB1) and adenosine triphosphate (ATP) were quantified with the utilization of relevant kits. The release of HMGB1 and the secretion of ATP in the APS – PTX NPs group were found to be higher than those in the other groups, as shown in Fig. 5I and J. These results indicate that APS-PTX NPs can induce ICD through the synergistic effect of APS and PTX and the enhanced endocytosis effect targeting GLUT.
DCs are crucial for triggering antigen – specific anti – tumor immune responses. They identify damage – associated molecular patterns (DAMPs) that are discharged during ICD. Subsequently, DCs present the antigens to T cells, thereby playing an essential part in kick – starting the anti – tumor immune process. Given that APS-PTX NPs induce CRT exposure and the secretion of ATP and HMGB1 in tumor cells, their potential to stimulate DC maturation was Further investigated. 4T1 cells were treated with PBS, free PTX, PTX-Lipo, APS, and APS-PTX NPs, and their supernatants were used to culture bone marrow-derived dendritic cells (BMDCs). Flow cytometry analysis revealed that all PTX-based treatments significantly enhanced DC maturation compared to the control, with APS-PTX NPs exhibiting the most potent effect (Fig. 5C, G). Notably, APS could also induce DC maturation, which may be related to the release of DAMPs induced by APS. These results are consistent with the ICD detection.
However, high expression of PD-L1 in breast cancer tumor cells is often associated with poor prognosis in patients [45, 46]. PTX can further induce an upregulation of PD-L1 expression [47]. APS may ingeniously circumvent the drawback of PTX-induced PD-L1 upregulation. To demonstrate whether APS-PTX NPs can reduce the PTX-induced upregulation of PD-L1 expression, 4T1 cells were cultured with PBS, PTX, PTX-Lipo, APS, and APS-PTX NPs. Then, an anti-PD-L1 fluorescent antibody was added, and the samples were detected by FCM. Compared with the control group, PTX and PTX-Lipo could induce an upregulation of PD-L1 expression. APS could significantly reduce the PD-L1 expression on the surface of 4T1 cells. Compared with free PTX and PTX-Lipo, APS-PTX NPs could significantly decrease the PD-L1 expression (Fig. 5A, B, E, F). According to previous reports, APS inhibit PD-L1 expression in 4T1 cells via the AKT/mTOR signaling pathway [48]. Therefore, we investigated the role of the AKT/mTOR/p70S6K signaling pathway in the reduction of PD-L1 expression by APS and APS-PTX NPs through western blotting experiments. The results showed that treatment with APS and APS-PTX NPs decreased the phosphorylation levels of AKT, mTOR, and p70S6K, indicating that APS and APS-PTX NPs treatment downregulated the AKT/mTOR/p70S6K pathway in 4T1 cells (Figure S8). These findings suggest that the reduction of PD-L1 by APS and APS-PTX NPs in tumor cells is associated with the downregulation of the AKT/mTOR/p70S6K pathway. The above results indicate that APS, as a novel drug carrier, can significantly reduce the PTX-induced high expression of PD-L1 on the surface of tumor cells, which is not achievable with common liposomes.
In vivo pharmacokinetics and tumor targeting evaluation of APS-PTX NPs
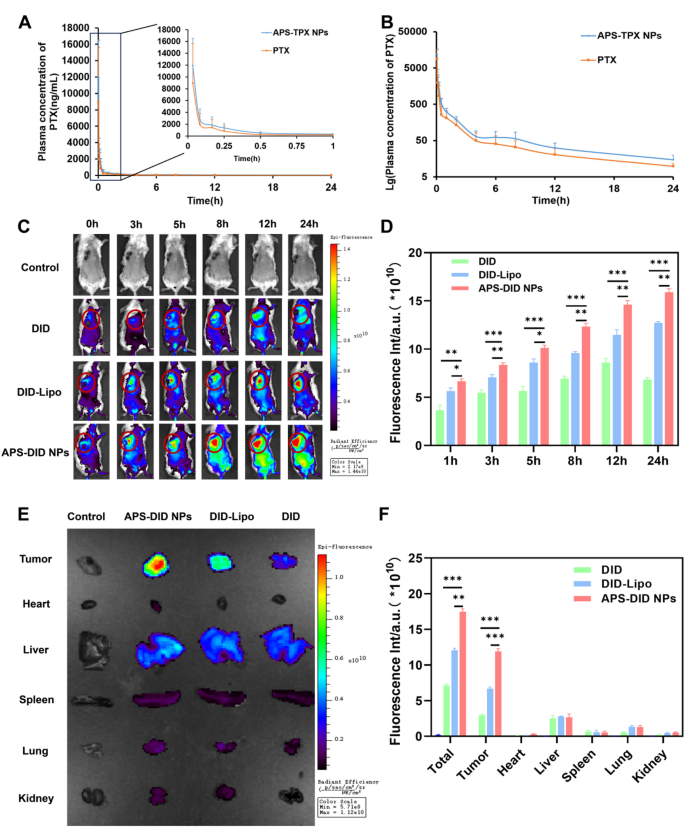
The drug concentration–time curve of free PTX and APS-PTX NPs, and the targeting ability in vivo and tissue biodistribution of APS-PTX NPs. (A) Blood concentration-time profile of PTX in rats after administration of free PTX and APS-PTX NPs (n = 6). (B) Lg blood concentration-time profile of PTX in rats after oral administration of free PTX and APS-PTX NPs (n = 6). (C) Fluorescence images and quantitative analysis (D) of 4T1 tumor-bearing mice after intravenous injection of DID, DID-Lipo and APS-DID NPs. (E) Fluorescence images of tissues, including tumor, heart, Liver, spleen, lung, and kidneys after 4T1 tumor-bearing mice sacrificed at 24 h. (F) Fluorescence quantitative analysis of tumors, heart, liver, spleen, lung, kidney and all tissues. (***p < 0.001, **p < 0.01, *p < 0.05)
The rapid clearance in systemic circulation and lack of tumor specificity often necessitate high drug doses, leading to adverse effects. The in vivo targeting ability and pharmacokinetic properties of APS-PTX NPs remain to be further investigated. The influence of APS coating on the pharmacokinetics of PTX in nanoparticles was determined by monitoring the plasma drug concentration in the body and the results were shown in Fig. 6A, B and Tables S7 (Supporting Information). Compared with free drugs, pharmacokinetic parameters of PTX in APS-PTX NPs, such as average blood concentration, peak concentration Cmax, half-life t1/2, mean retention time (MRT 0−∞), and area under the curve (AUC0−∞) were significantly improved or extended, highlighting the advantages of APS-PTX NPs. This further indicates that APS as a nanocarrier can enhance the in vivo long circulation of PTX. The tumor targeting ability and tissue biodistribution of APS-PTX NPs were Further evaluated in 4T1 tumor bearing mice. The fluorescence intensities of the tumor sites are shown in Figs. 6C and D. From 0 h to 24 h, the fluorescence intensities of each group continuously increased. Specifically, only a small amount of free DID reached the tumor site. In contrast, the fluorescence intensity of DID-Lipo at the tumor site was significantly higher than that of free DID, mainly attributed to the EPR effect. Moreover, compared with DID-Lipo, starting from 3 h, APS-DID NPs exhibited a stronger fluorescence signal at the tumor site due to the targeting ability of APS. Additionally, at 24 h, the mice were sacrificed, and relevant tissues and organs were collected. The results in Fig. 6E, F indicated that the fluorescence intensity in the major organs (tumor, liver, heart, spleen, lung, kidney and all organs) of each group was far lower than that at the tumor site. The total fluorescence intensity of APS-DID NPs was the strongest, indicating that their clearance effect in vivo was the lowest. Among all the total fluorescence intensities, the ratio of APS-DID NPs to free DID was 2.45, while the ratio in tumor tissues was 4.03, which demonstrates that APS-DID NPs possess significant tumor-targeting ability. At the tumor site, the accumulation of free DID was the lowest, followed by DID-Lipo, and APS-DID NPs showed the highest accumulation, with significant differences among the groups. Compared with the free DID group, the fluorescence intensity of DID-Lipo was 2.26-fold higher, and that of APS-DID NPs was 4.03-fold higher. This suggests that the GLUT-mediated targeting can significantly enhance the accumulation of APS-DID NPs at the tumor site. Compared with DID-Lipo, the fluorescence intensity of APS-DID NPs was 1.78-fold higher, which was mainly due to the enhanced accumulation resulting from the targeting of APS to the tumor site. The above experimental results demonstrate that APS-DID NPs can actively target the tumor site through APS, which is beneficial for the treatment of nanoparticles at the tumor site.
In vivo anti-tumor and anti-metastasis efficacy of APS-PTX NPs
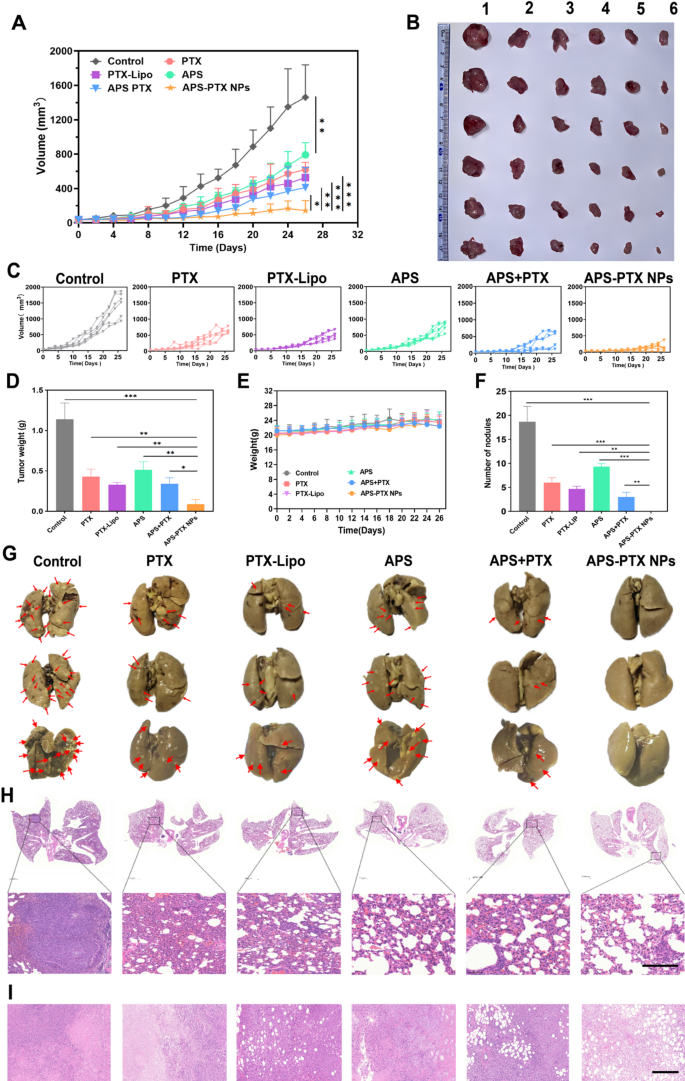
In vivo antitumor and anti-metastasis effect of systemic administration of APS-PTX NPs in 4T1 tumor-bearing mice (n = 6). (A) Tumor volume growth curves due to in vivo antitumor effects of different groups. (B) Photographs of the stripped tumors from the sacrificed mouse after the last administration (1: Control; 2: APS; 3: PTX; 4: PTX-Lipo; 5: APS + PTX; 6: APS + PTX NPs). (C) The specific growth curve of 4T1 tumor-bearing mice. (D) The tumor weights were presented in the different treatment groups. (E) The body weight of mice among the different treatment groups. (F) Quantitative analysis of the inhibition of node numbers. (G) Images of lungs in different groups and the red arrows represented metastatic nodules on lungs. (H) H&E staining of lungs from 4T1 tumor-bearing mice in the five groups, and the dark purple parts represented tumor metastasis. (I) H&E staining of tumor in the five groups (scale bar: 200 μm) (***p < 0.001, **p < 0.01, *p < 0.05)
In vivo antitumor efficacy was evaluated in tumor-bearing mice after treatment with PBS (control), PTX, PTX-Lipo, APS, APS + PTX and APS-PTX NPs. The growth trend of tumor volume, tumor morphology and the tumor weight of each group were compared to evaluate the antitumor efficacy (Fig. 7A–D). The tumor weight of the saline group was 1.14 ± 0.20 g. Compared to PBS group, the tumor weight in the treatment groups all reduced. Specifically, the tumor weights of the PTX, PTX-Lipo, APS, APS + PTX and APS-PTX NPs groups were 1.17 ± 0.46 g, 0.43 ± 0.09 g, 0.39 ± 0.08 g, 0.51 ± 0.10 g, 0.40 ± 0.12 g and 0.09 ± 0.06 g, respectively. The tumor volume of the control, PTX, PTX-Lipo, APS, APS + PTX and APS-PTX NPs groups were 1462.07 ± 376.59 mm3 619.08 ± 84.39 mm3 526.73 ± 122.35 mm3 719.88 ± 141.36 mm3 410.80 ± 232.21 mm3 and 143.03 ± 116.84 mm3 respectively, indicating a strong synergistic anti-tumor effect of the APS and PTX in combination. Compared with the control group, APS showed a certain antitumor effect in vivo (54.90%), which was related to the enhancement of immunity by APS [37]. Increasingly, both free PTX and PTX-Lipo groups exhibited stronger inhibition, the inhibition rates of free PTX and PTX-Lipo were 62.39% and 71.16% relative to PBS, respectively. Specifically, APS-PTX NPs demonstrated the most potent inhibitory effect on tumor growth (92.28%), which was significantly higher than that of the physical mixture group of APS and PTX. This further validates the advantages of APS-PTX NPs in exerting anti-tumor effects via the EPR effect and GLUT-mediated targeting. Moreover, hematoxylin and eosin (H&E) (Fig. 7I), Ki67 (Fig. 8A, B), and terminal-deoxynucleotidyl transferase mediated nick end labeling (TUNEL) (Fig. 8C, D) assay were used to detect tumor tissue after treatment. In results of the above assay, APS-PTX NPs also showed the best efficiency accordingly, with serious apoptosis of the tumor cells, more obvious destruction of tumor cell, and deformation or shrinking of nuclei, and a larger percentage of the Ki67 positivity tumor sections when compared with other groups, which validated that APS-PTX NPs could inhibit tumor growth by inducing tumor necrosis and apoptosis, as well as inhibiting proliferation.
Metastasis is the main cause of death in TNBC patients, and 4T1 cells are highly invasive and prone to lung metastasis. The metastasis inhibition of APS-PTX NPs was inspected, and the lung tissues were carefully collected and photographed at the end of the experiment (Fig. 7G). The number of visible metastatic nodules on the surface of lung tissue was recorded to evaluate its anti-metastasis effect (Fig. 7F). A large number of tumor metastases were observed on the surface of lung tissues in the control group (18.67 ± 3.21). The number of metastatic lesions on the lung surface was significantly reduced in both the PTX group (6.00 ± 1.00) and the PTX-lipo group (4.67 ± 0.58). The surface structure of lung tissues in the APS-PTX NPs group was close to normal, with almost no metastases (0.00 ± 0.00). The results of H&E staining of lung tissue sections also confirmed that APS-PTX NPs could significantly reduce the number of metastases in lung tissues (Fig. 7H). Paraffin-embedded sections of the lungs from mice in each group were subjected to immunohistochemical staining for MMP-9 and Vimentin. The results demonstrated that the expression levels of MMP-9 (Figure S9. A and C) and Vimentin (Figure S9. B and D) in the lung tissue regions of the APS-PTX NPs group were the lowest. These findings indicate that APS-PTX NPs can significantly reduce the invasiveness of tumor cells and suppress lung metastasis, which may be attributed to the synergistic effect and targeting effect of APS and PTX, enabling the drug to penetrate into tumors and metastases.
In vivo immune response elicited by APS-PTX NPs
Immunotherapy efficiency of APS-PTX NPs was investigated after in vivo anti-tumor experiment. Furthermore, the capacity of APS-PTX NPs to induce ICD was assessed by measuring key immune-stimulatory markers, including extracellular ATP secretion, cell surface exposure of CRT, and intracellular release of HMGB1. These markers play critical roles in recruiting immune cells and facilitating antigen presentation, thereby enhancing anti-tumor immune responses [49]. As shown by CLSM, the exposure level of CRT in cells was demonstrated. As depicted in Fig. 8E, consistent with the in vitro results, all the PTX treatment groups exhibited an increase in CRT exposure. APS alone could induce the exposure of CRT in tumor cells. In particular, the exposure of CRT induced by APS-PTX NPs was significantly higher compared to that in the free PTX group and the PTX-Lipo group. Semi-quantitative analysis Further revealed that compared with the free PTX group and the PTX-Lipo group, the CRT exposure in the APS-PTX NPs group increased by 55.58% and 37.30%, respectively (Fig. 8F). The release of HMGB1 was also shown by CLSM, as illustrated in Fig. 8G and H. APS alone effectively triggered the release of HMGB1, while APS-PTX NPs caused the most significant release of HMGB1. Semi-quantitative analysis further indicated that compared with the free PTX group and the PTX-Lipo group, the release of HMGB1 in the APS-PTX NPs group increased by 62.13% and 46.48%, respectively. Therefore, APS-PTX NPs possess the strongest ability to trigger the release of immunostimulatory signals. Next, we investigated the expression of PD-L1 in the tumors of mice (Fig. 8I, J). Compared with the control group, free PTX significantly upregulated the expression of PD-L1. Conversely, in line with the results of the in vitro study, APS markedly reduced the expression of PD-L1. The relative level of PD-L1 decreased by approximately 19.23% compared with that in the control group. When compared with the free PTX group and the PTX-Lipo group, the relative levels of PD-L1 in the tumor tissues of the APS-PTX NPs group decreased by approximately 65.88% and 69.08%, respectively. Therefore, APS-PTX NPs induced effective in vivo degradation of PD-L1 during the treatment.
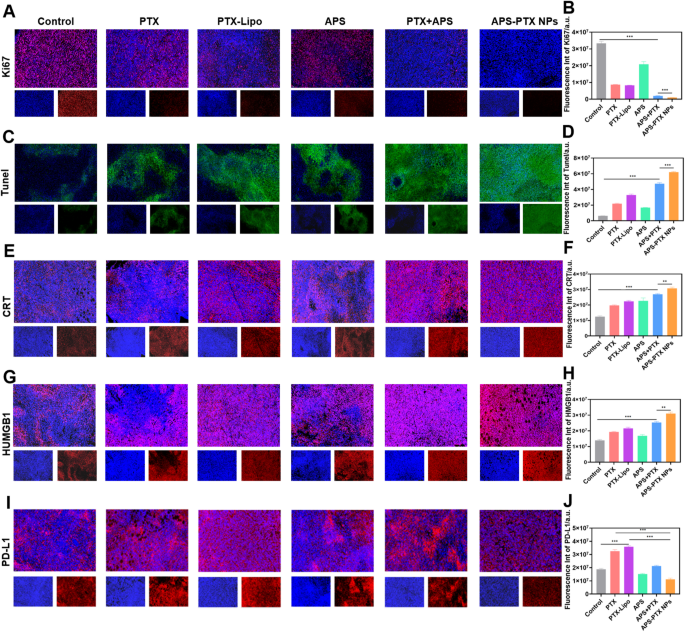
The Ki67 (A, B), TUNEL (C, D), CRT (E, F), HMGB1 (G, H) and PD-L1 (I, J) staining and quantitative analysis in tumor tissues harvested from different groups. (scale bar = 200 μm) (**p < 0.01 and ***p < 0.001)
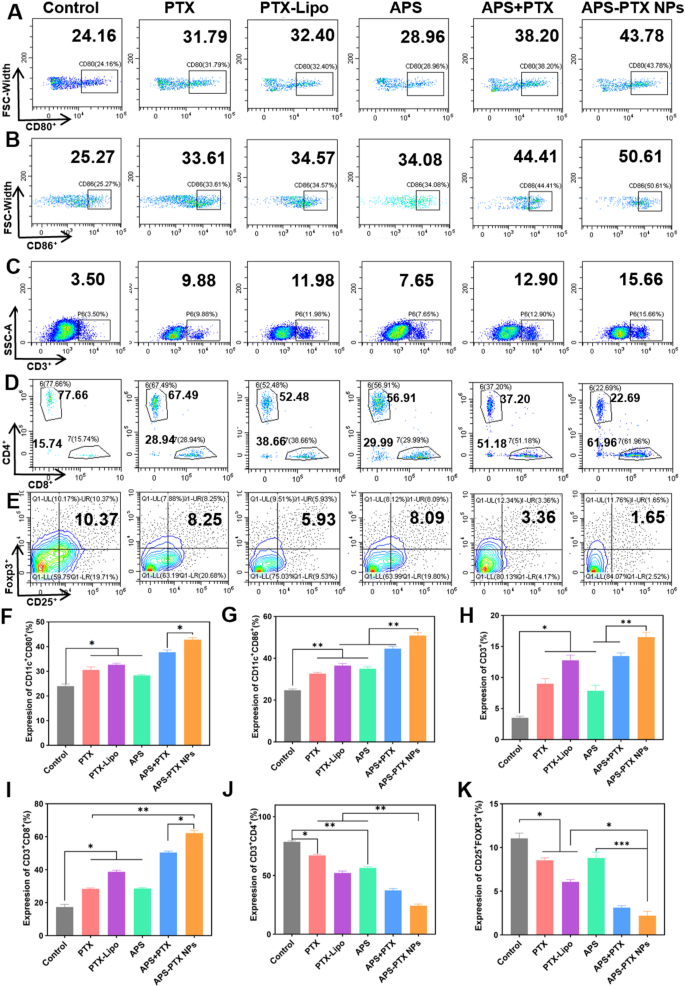
Immunological responses induced by different treatments in vivo. Flow cytometric assay of the expression of A) CD80+ and B) CD86+ on DCs in tumor-draining lymph nodes. Flow cytometric assay of (C) total T lymphocytes (CD3+), D) cytotoxic T lymphocytes (CD3+CD8+) and helper T lymphocytes (CD3+CD4+), and E) Tregs (CD4+CD25+Foxp3+) in tumors. Quantitative analysis of the expression of F) CD80+ and G) CD86+ on DCs, and H) total T lymphocytes (CD3+), I) cytotoxic T lymphocytes (CD3+CD8+), J) helper T lymphocytes (CD3+CD4+), and K) Tregs (CD4+CD25+Foxp3+) in tumors. Data represents mean ± s.d (n = 3) (* p < 0.05, ** p < 0.01, *** p < 0.001)
DC maturation in the lymph nodes is a critical process to initiate immune response. As shown in Fig. 9A, B, F and G, all treatments containing free PTX, PTX-Lipo, APS, APS + PTX, and APS-PTX NPs, promoted DC maturation. The expression of CD80+ and CD86+ on the surface of DC in the lymphatic tissue in all groups became higher. APS stimulated the maturation of DC as reported [50]. In our study, APS significantly promoted the maturation of DC cells, with 28.86% (CD80+DC) and 34.08% (CD86+DC). The final formulation effectively combined APS and PTX, and delivered the drug to the tumor site with a higher proportion to exert its efficacy. And the effects of APS-PTX NPs and APS + PTX were better than those of PTX and PTX-Lipo. Among them, APS-PTX NPs group had highest proportion of mature DC cells, with 43.78% (CD80+DC) and 50.61% (CD86+DC), respectively. With the activation of mature DCs, the increase of helper CD4 positive T lymphocytes (CD4+T cell) and positive cytotoxic T lymphocyte (CD8+T cell) in the tumors were observed after treatment with APS-PTX NPs (Fig. 9D, I and J). While the proportion of CD8+T cells in tumor tissue of each treatment group significantly increased. Compared with the control group, the proportion of CD8+T cells increased by 2.9 times (APS-PTX NPs) or 0.9 times (APS).
On the other side, relieving immunosuppression plays a decisive role in building the normal antitumor immune barrier. Treg cells and M2 macrophages are key inhibitory cells in the immune system. The immune regulatory T cells (Treg cells) in tumor tissue were Further investigated to study the regulation of APS-PTX NPs to immunosuppressive cells. Relative to the control group, the ratio of Treg decreased to below 9% (APS) or 2% (APS-PTX NPs) (Fig. 8E and K).
Tumor associated macrophages is also a very important category among immunosuppressive cells in TIME, mainly divided into intratumoral M2 macrophages (M2) with alternative activation, and immune-promoting M1 macrophages (M1) with classical activation recruit and activate adaptive immune cells. And the proportion of M1 increased about 1.7 times (APS) and 2.6 times (APS-PTX NPs), and the proportion of M2 decreased, compared with control group (Figure S10 A-D). Combination of APS and PTX using indeed achieved lower rate of M2/M1 than single use. These results also showed that the proportion of immunosuppressive cells decreased significantly after APS-PTX NPs treatment.
In vivo safety of APS-PTX NPs
To evaluate the in vivo safety of APS-PTX NPs, weight was monitored every other day and blood related biochemical indexes were measured at the end of treatment (Fig. 10C-F). The weight of mice in each group increased normally without any significant fluctuations, indicating the safety of APS-PTX NPs (Fig. 7E). Moreover, H&E staining images of main organs from different treatment groups were observed with no pathological damage such as lesions or necrosis (Fig. 10A).
PTX, a member of the taxane family of chemotherapy drugs, demonstrates outstanding therapeutic efficacy against a diverse range of cancers, with a particularly pronounced effect on breast cancer. It has been extensively adopted in clinical oncological practice. Nevertheless, the clinical application of PTX is hampered by severe adverse effects, chief among which is myelosuppression. This limitation restricts its more widespread utilization in cancer treatment [30]. APS has been reported to be used for improving the myelosuppression of patients after chemotherapy [51,52,53]. Therefore, we Further determined the number of white blood cells in the peripheral blood of mice in each group after administration. Compared with the 4T1 control group, the number of white blood cells in the blood of all mice treated with PTX was significantly reduced, but it was significantly improved after combination treatment with APS (Fig. 10G). The evaluation of differential white blood cell counts showed that compared with the control group, the numbers of neutrophils, lymphocytes, and monocytes in the free PTX group were significantly decreased. In contrast, compared with the free PTX group, the numbers of neutrophils (Fig. 10H), lymphocytes (Fig. 10I), and monocytes (Fig. 10J) in the APS-PTX NPs group were significantly increased. To assess the impact of APS-PTX NPs on PTX-related bone marrow toxicity, histological alterations in the femur were examined using hematoxylin and eosin (H&E) staining. As depicted in Fig. 10B, treatment with free PTX and PTX-Lipo resulted in a reduction in bone marrow cellularity and disrupted tissue architecture. In contrast, APS administration effectively mitigated these adverse effects, restoring bone marrow organization and cellular density. These findings prove the protective role of APS against PTX-induced bone marrow damage. These results indicate that compared with free PTX, APS-PTX NPs enhanced bone marrow hematopoiesis.
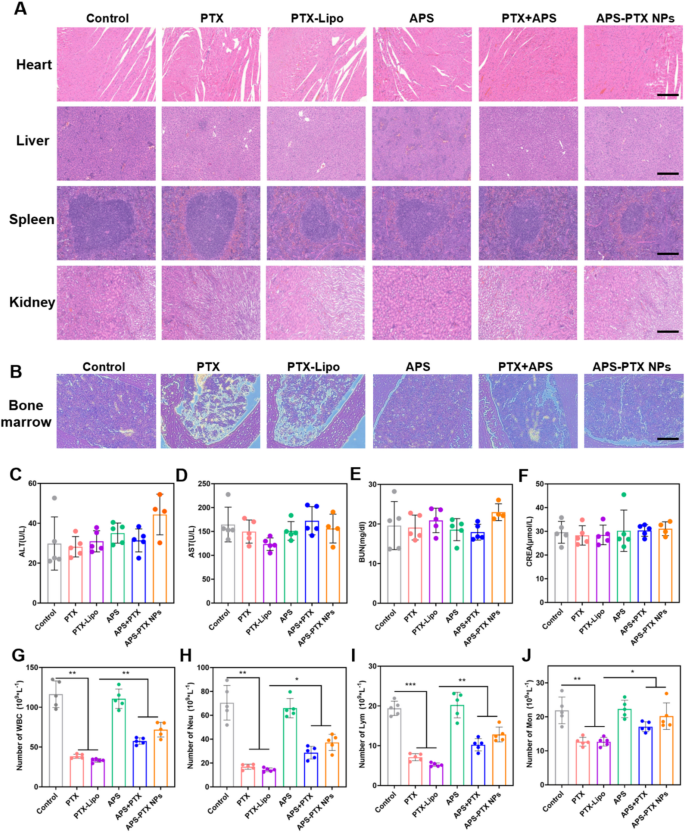
The in vivo safety evaluation of each group and the effect of treatments on the total and differential leukocyte counts. (A) The H&E staining of main organs (heart, liver, spleen, kidney) from 4T1 tumor-bearing mice in the five groups (scale bar = 200 μm). (B) Histopathology changes of bone marrow detected by H&E staining. The analysis result of ALT (C), AST (D), BUN (E) and CREA (F) in serum of 4T1 tumor-bearing mice after treatment. The analysis result of WBC (G), Neu (H), Lym (I) and Mom (J) in peripheral blood of mice after treatment. (n = 5)